Grundlæggende statistik
| Institutionelle aktier (lange) | 79.720.677 - 101,76% (ex 13D/G) - change of -19,77MM shares -19,87% MRQ |
| Institutionel værdi (lang) | $ 1.508.199 USD ($1000) |
Institutionelt ejerskab og aktionærer
Adient plc (US:ADNT) har 294 institutionelle ejere og aktionærer, der har indsendt 13D/G- eller 13F-formularer til Securities Exchange Commission (SEC). Disse institutioner har i alt 79,720,677 aktier. Største aktionærer omfatter BlackRock, Inc., Vanguard Group Inc, Dimensional Fund Advisors Lp, Pzena Investment Management Llc, D. E. Shaw & Co., Inc., State Street Corp, Hotchkis & Wiley Capital Management Llc, Morgan Stanley, Arrowstreet Capital, Limited Partnership, and HITE Hedge Asset Management LLC .
Adient plc (NYSE:ADNT) institutionel ejerskabsstruktur viser aktuelle positioner i virksomheden efter institutioner og fonde, samt seneste ændringer i positionsstørrelse. Større aktionærer kan omfatte individuelle investorer, investeringsforeninger, hedgefonde eller institutioner. Skema 13D angiver, at investoren besidder (eller besidder) mere end 5 % af virksomheden og har til hensigt (eller har til hensigt at) aktivt at forfølge en ændring i forretningsstrategi. Skema 13G indikerer en passiv investering på over 5%.
The share price as of April 13, 2026 is 20,66 / share. Previously, on April 14, 2025, the share price was 10,96 / share. This represents an increase of 88,50% over that period.

Fondens stemningsscore
Fund Sentiment Score (fka Ownership Accumulation Score) finder de aktier, der bliver mest købt af fonde. Det er resultatet af en sofistikeret, multi-faktor kvantitativ model, der identificerer virksomheder med de højeste niveauer af institutionel akkumulering. Scoringsmodellen bruger en kombination af den samlede stigning i oplyste ejere, ændringerne i porteføljeallokeringer i disse ejere og andre målinger. Tallet går fra 0 til 100, hvor højere tal indikerer et højere niveau af akkumulering for sine jævnaldrende, og 50 er gennemsnittet.
Opdateringsfrekvens: Dagligt
Se Ownership Explorer, som giver en liste over højest rangerende virksomheder.
AI+ Ask Fintel’s AI assistant about Adient plc.
Select a question to share a public post with an AI-crafted answer.
Thinking of good questions…
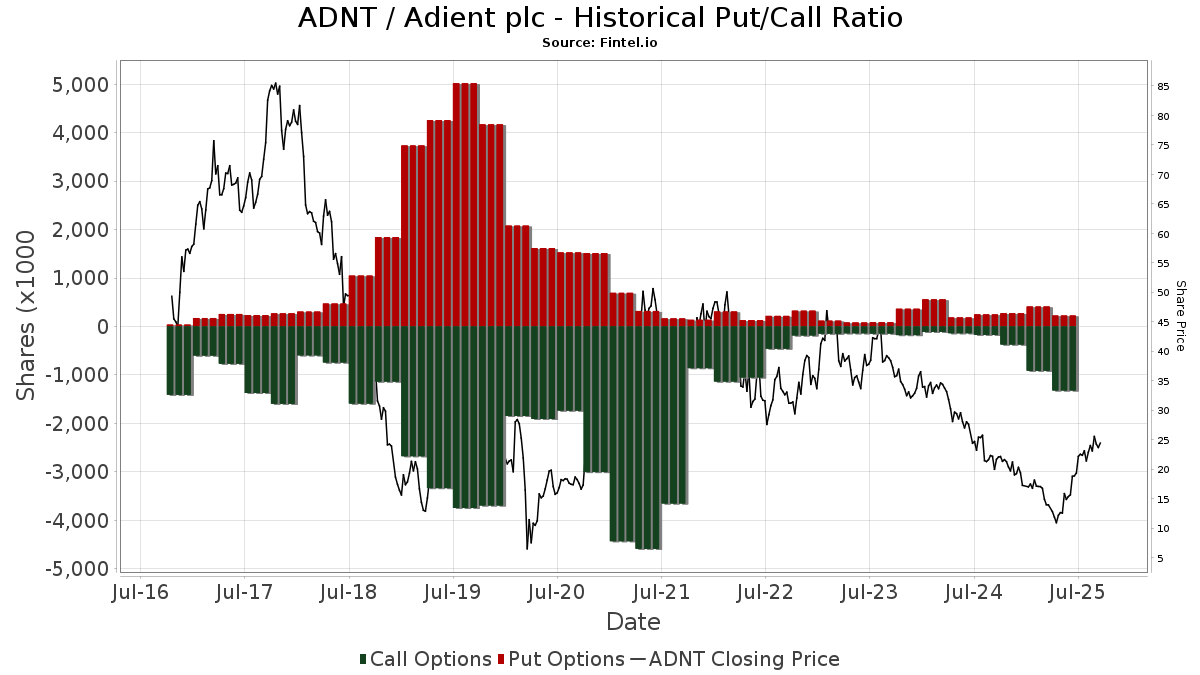
Institutionel Put/Call-forhold
Ud over at indberette standardaktie- og gældsudstedelser skal institutter med mere end 100 mill. aktiver under forvaltning også oplyse deres put- og call-optionsbeholdninger. Da salgsoptioner generelt indikerer negativ stemning, og købsoptioner indikerer positiv stemning, kan vi få en fornemmelse af den overordnede institutionelle stemning ved at plotte forholdet mellem put og kald. Diagrammet til højre viser det historiske put/call-forhold for dette instrument.
Brug af Put/Call Ratio som en indikator for investorernes stemning overvinder en af de vigtigste mangler ved at bruge totalt institutionelt ejerskab, som er, at en betydelig mængde af aktiver under forvaltning investeres passivt for at spore indekser. Passivt forvaltede fonde køber typisk ikke optioner, så indikatoren for put/call-forholdet følger mere nøje følelsen af aktivt forvaltede fonde.
13D/G-arkivering
Vi præsenterer 13D/G ansøgninger separat fra 13F ansøgninger på grund af den forskellige behandling af SEC. 13D/G-ansøgninger kan indgives af grupper af investorer (med én ledende), hvorimod 13F-ansøgninger ikke kan. Dette resulterer i situationer, hvor en investor kan indsende en 13D/G, der rapporterer én værdi for de samlede aktier (der repræsenterer alle de aktier, der ejes af investorgruppen), men derefter indsender en 13F, der rapporterer en anden værdi for de samlede aktier (der udelukkende repræsenterer deres egne) ejendomsret). Det betyder, at aktieejerskab af 13D/G-arkiver og 13F-arkiveringer ofte ikke er direkte sammenlignelige, så vi præsenterer dem separat.
Bemærk: Fra den 16. maj 2021 viser vi ikke længere ejere, der ikke har indsendt en 13D/G inden for det seneste år. Tidligere viste vi den fulde historie af 13D/G-arkiver. Generelt skal enheder, der er forpligtet til at indgive 13D/G-ansøgninger, indgive mindst årligt, før de indsender en afsluttende ansøgning. Dog forlader fonde nogle gange positioner uden at indsende en afsluttende ansøgning (dvs. de afvikler), så visning af den fulde historie resulterede nogle gange i forvirring om det nuværende ejerskab. For at undgå forvirring viser vi nu kun 'aktuelle' ejere - det vil sige - ejere, der har anmeldt inden for det seneste år.
Upgrade to unlock premium data.
| Fil dato | Form | Investor | Forrige Aktier |
Seneste Aktier |
Δ Aktier (Procent) |
Ejendomsret (Procent) |
Δ Ejerskab (Procent) |
|
|---|---|---|---|---|---|---|---|---|
| 2026-03-26 | VANGUARD GROUP INC | 4,309,625 | 0 | -100.00 | 0.00 | -100.00 | ||
| 2026-02-05 | FMR LLC | 4,985,555 | 1,608,973 | -67.73 | 2.00 | -67.21 | ||
| 2025-10-09 | DIMENSIONAL FUND ADVISORS LP | 3,984,111 | 4,215,764 | 5.81 | 5.20 | 10.64 | ||
| 2025-08-13 | HOTCHKIS & WILEY CAPITAL MANAGEMENT LLC | 4,500,736 | 3,251,560 | -27.75 | 3.87 | -27.80 | ||
| 2025-05-14 | ALLIANCEBERNSTEIN L.P. | 5,414,519 | 119,725 | -97.79 | 0.10 | -98.39 | ||
| 2025-05-02 | Pacer Advisors, Inc. | 1,124,978 | 1.34 | |||||
| 2025-04-23 | BlackRock, Inc. | 16,064,663 | 12,681,039 | -21.06 | 15.10 | -17.93 |
13F og NPORT arkivering
Detaljer om 13F-arkivering er gratis. Detaljer om NP-ansøgninger kræver et premium-medlemskab. Grønne rækker angiver nye positioner. Røde rækker angiver lukkede positioner. Klik på linket ikon for at se den fulde transaktionshistorik.
Opgrader
for at låse premium-data op og eksportere til Excel ![]() .
.
| Fil dato | Kilde | Investor | Type | Gennemsnitlig pris (Øst) |
Aktier | Δ Aktier (%) |
Rapporteret Værdi ($1000) |
Δ Værdi (%) |
Port Alloc (%) |
|
|---|---|---|---|---|---|---|---|---|---|---|
| 2026-02-09 | 13F | Royce & Associates Lp | 30.099 | 0,00 | 577 | -20,44 | ||||
| 2026-01-27 | 13F | TD Waterhouse Canada Inc. | 16 | 0,00 | 0 | |||||
| 2025-11-12 | 13F | Group One Trading, L.p. | 0 | -100,00 | 0 | -100,00 | ||||
| 2026-02-11 | 13F | Los Angeles Capital Management Llc | 3.343 | 77 | ||||||
| 2026-02-11 | 13F | Buckingham Strategic Partners | 0 | -100,00 | 0 | |||||
| 2026-02-12 | 13F | Hrt Financial Lp | 97.435 | 256,46 | 2 | |||||
| 2025-11-12 | 13F | Group One Trading, L.p. | Put | 0 | -100,00 | 0 | -100,00 | |||
| 2026-02-13 | 13F | Alerus Financial Na | 3 | 0,00 | 0 | |||||
| 2026-02-13 | 13F | Charles Schwab Investment Management Inc | 1.303.352 | -2,50 | 24.985 | -22,38 | ||||
| 2026-02-10 | 13F | State of Wyoming | 23.992 | 128,06 | 460 | 81,42 | ||||
| 2026-02-13 | 13F | Mariner, LLC | 0 | -100,00 | 0 | |||||
| 2026-02-12 | 13F | Ankerstar Wealth, LLC | 9 | 0 | ||||||
| 2026-02-12 | 13F | State Board Of Administration Of Florida Retirement System | 27.292 | 0,00 | 523 | -20,40 | ||||
| 2026-02-17 | 13F | Price T Rowe Associates Inc /md/ | 92.947 | 1,16 | 2 | -50,00 | ||||
| 2026-02-02 | 13F | Principal Financial Group Inc | 377.569 | -3,81 | 7.238 | -23,43 | ||||
| 2026-02-10 | 13F | Nomura Asset Management Co Ltd | 3.300 | 0,00 | 63 | -20,25 | ||||
| 2025-10-23 | 13F | Evolution Wealth Management Inc. | 0 | -100,00 | 0 | |||||
| 2026-02-12 | 13F | Hollencrest Capital Management | 1 | 0,00 | 0 | |||||
| 2026-02-13 | 13F | Rhumbline Advisers | 237.617 | -7,84 | 4.555 | -26,63 | ||||
| 2026-02-17 | 13F | Albar Capital Partners LLP | 0 | -100,00 | 0 | |||||
| 2026-02-17 | 13F | Jain Global LLC | 27.691 | 26,32 | 531 | 0,57 | ||||
| 2026-02-11 | 13F | Cedar Mountain Advisors, LLC | 0 | -100,00 | 0 | |||||
| 2026-02-02 | 13F | Mutual Advisors, LLC | 51.753 | 0,00 | 992 | -19,28 | ||||
| 2026-01-28 | 13F | Arizona State Retirement System | 22.682 | -8,76 | 435 | -27,42 | ||||
| 2026-02-11 | 13F | Modus Advisors, LLC | 14 | 0 | ||||||
| 2026-02-12 | 13F | New York State Common Retirement Fund | 26.371 | 0,00 | 506 | -20,47 | ||||
| 2026-02-13 | 13F | Y-Intercept (Hong Kong) Ltd | 82.146 | 1.575 | ||||||
| 2026-02-17 | 13F | Quantedge Capital Pte Ltd | 768.411 | -27,52 | 14.730 | -42,30 | ||||
| 2025-11-14 | 13F | Masters Capital Management Llc | Call | 0 | -100,00 | 0 | ||||
| 2026-02-17 | 13F | Graham Capital Management, L.P. | 0 | -100,00 | 0 | |||||
| 2026-02-12 | 13F | Steward Partners Investment Advisory, Llc | 128 | 0,00 | 2 | -33,33 | ||||
| 2026-01-21 | 13F | Albion Financial Group /ut | 22 | 0,00 | 0 | |||||
| 2026-02-03 | 13F | Mitsubishi UFJ Kokusai Asset Management Co., Ltd. | 76 | 0,00 | 1 | 0,00 | ||||
| 2026-02-13 | 13F | Umb Bank N A/mo | 578 | -5,56 | 11 | -21,43 | ||||
| 2026-01-26 | 13F | Riverview Trust Co | 40 | 0,00 | 1 | |||||
| 2026-02-10 | 13F | Rothschild Investment Llc | 237 | -18,84 | 5 | -42,86 | ||||
| 2026-02-17 | 13F | Hotchkis & Wiley Capital Management Llc | 2.542.760 | -0,93 | 48.745 | -21,13 | ||||
| 2026-02-13 | 13F | Edgestream Partners, L.P. | 327.290 | 205,85 | 6.274 | 143,56 | ||||
| 2026-02-17 | 13F | Fmr Llc | 1.608.973 | -67,73 | 30.844 | -74,31 | ||||
| 2026-02-11 | 13F | Simplex Trading, Llc | Put | 1.400 | -83,72 | 27 | ||||
| 2026-01-30 | 13F | New York State Teachers Retirement System | 88.500 | 0,00 | 2 | -50,00 | ||||
| 2026-02-11 | 13F | Simplex Trading, Llc | 24.870 | -17,94 | 477 | |||||
| 2026-02-02 | 13F | Advisors Preferred, LLC | 0 | -100,00 | 0 | |||||
| 2026-02-11 | 13F | Simplex Trading, Llc | Call | 32.000 | 13,07 | 613 | ||||
| 2026-02-10 | 13F | Envestnet Asset Management Inc | 0 | -100,00 | 0 | |||||
| 2026-04-13 | 13F | Highland Capital Management, Llc | 14.440 | 32,62 | 292 | 39,90 | ||||
| 2026-02-12 | 13F | Federated Hermes, Inc. | 509.906 | 12,98 | 9.775 | -10,07 | ||||
| 2026-01-21 | 13F | Yousif Capital Management, Llc | 26.745 | -14,17 | 569 | -24,27 | ||||
| 2026-02-13 | 13F | Glen Eagle Advisors, LLC | 0 | -100,00 | 0 | |||||
| 2026-02-13 | 13F | Marshall Wace, Llp | 0 | -100,00 | 0 | |||||
| 2026-02-13 | 13F | Quarry LP | 614 | -73,35 | 12 | -80,00 | ||||
| 2026-02-11 | 13F | Cerity Partners LLC | 28.089 | -25,67 | 538 | -40,81 | ||||
| 2026-01-28 | 13F | Klp Kapitalforvaltning As | 17.000 | 0,00 | 326 | -20,54 | ||||
| 2025-11-21 | 13F/A | CIBC Bancorp USA Inc. | 8.977 | 216 | ||||||
| 2026-01-21 | 13F | Flagship Harbor Advisors, Llc | 26 | 0 | ||||||
| 2026-02-17 | 13F | Aqr Capital Management Llc | 639.074 | 3,69 | 12.251 | -17,45 | ||||
| 2026-02-13 | 13F | Sterling Capital Management LLC | 4.699 | -81,31 | 90 | -85,12 | ||||
| 2026-02-17 | 13F | Advisor Group Holdings, Inc. | 4.020 | -26,37 | 77 | -42,54 | ||||
| 2026-02-10 | 13F | Godfrey Financial Associates, Inc. | 90 | 2 | ||||||
| 2026-02-17 | 13F | Russell Investments Group, Ltd. | 82.283 | -13,06 | 1.577 | -30,80 | ||||
| 2026-02-13 | 13F | Schroder Investment Management Group | 213.002 | 140,37 | 4.147 | 92,88 | ||||
| 2026-02-17 | 13F | Aquatic Capital Management LLC | 536 | 10 | ||||||
| 2026-01-29 | 13F | Teachers Retirement System Of The State Of Kentucky | 20.963 | -13,20 | 0 | |||||
| 2026-02-13 | 13F | Verition Fund Management LLC | 87.100 | -10,48 | 1.670 | -28,74 | ||||
| 2026-02-10 | 13F | Axq Capital, Lp | 14.513 | 278 | ||||||
| 2026-02-17 | 13F | Dv Equities, Llc | 400 | 8 | ||||||
| 2026-02-19 | 13F | CI Private Wealth, LLC | 18.117 | 5,22 | 347 | -16,18 | ||||
| 2025-11-14 | 13F | Strategic Wealth Partners, Ltd. | 1 | 0,00 | 0 | |||||
| 2026-01-22 | 13F | Red Tortoise LLC | 169 | 0,00 | 3 | -25,00 | ||||
| 2026-01-28 | 13F | Salomon & Ludwin, LLC | 928 | -0,43 | 18 | -25,00 | ||||
| 2026-02-13 | 13F | Healthcare Of Ontario Pension Plan Trust Fund | 188.839 | 60,17 | 3.620 | 27,51 | ||||
| 2026-01-16 | 13F | Louisiana State Employees Retirement System | 36.300 | -2,68 | 696 | -22,61 | ||||
| 2025-10-17 | 13F | Ethic Inc. | 0 | -100,00 | 0 | -100,00 | ||||
| 2026-02-11 | 13F | Fox Run Management, L.l.c. | 46.629 | 13,47 | 894 | -9,71 | ||||
| 2026-02-10 | 13F | Commonwealth Of Pennsylvania Public School Empls Retrmt Sys | 19.607 | -5,24 | 376 | -24,70 | ||||
| 2026-02-17 | 13F | Optiver Holding B.V. | 0 | -100,00 | 0 | |||||
| 2026-02-05 | 13F | Amalgamated Bank | 23.091 | -0,65 | 0 | |||||
| 2026-02-12 | 13F | Xponance, Inc. | 10.260 | -4,15 | 197 | -23,74 | ||||
| 2026-02-12 | 13F | Bank Of Montreal /can/ | 0 | -100,00 | 0 | |||||
| 2026-04-07 | 13F | Farther Finance Advisors, LLC | 929 | 28,49 | 19 | 46,15 | ||||
| 2026-02-13 | 13F | Ieq Capital, Llc | 104.354 | -14,03 | 2.000 | -31,55 | ||||
| 2026-02-12 | 13F | BRYN MAWR TRUST Co | 0 | -100,00 | 0 | |||||
| 2026-02-17 | 13F | CWM Advisors, LLC | 24.636 | 30,38 | 472 | 3,74 | ||||
| 2026-02-17 | 13F | Tudor Investment Corp Et Al | 206.934 | 21,92 | 3.967 | -2,96 | ||||
| 2025-11-13 | 13F/A | Peak6 Llc | 0 | -100,00 | 0 | -100,00 | ||||
| 2026-02-13 | 13F/A | Ontario Teachers Pension Plan Board | 0 | -100,00 | 0 | |||||
| 2026-01-16 | 13F | Ronald Blue Trust, Inc. | 588 | 4,63 | 11 | -15,38 | ||||
| 2026-02-17 | 13F | Two Sigma Advisers, Lp | 198.300 | 312,27 | 3.801 | 228,24 | ||||
| 2026-01-14 | 13F | Pallas Capital Advisors LLC | 13.098 | -5,84 | 251 | -24,85 | ||||
| 2026-02-06 | 13F | EverSource Wealth Advisors, LLC | 1.014 | -22,60 | 19 | -38,71 | ||||
| 2026-02-04 | 13F | Oregon Public Employees Retirement Fund | 18.100 | -1,09 | 347 | -21,36 | ||||
| 2026-04-08 | 13F | Birchbrook, Inc. | 45 | 0,00 | 1 | |||||
| 2026-01-22 | 13F | Harwood Advisory Group, LLC | 0 | -100,00 | 0 | |||||
| 2026-02-12 | 13F | Quadrant Capital Group Llc | 16.656 | 0,00 | 319 | -20,45 | ||||
| 2026-02-10 | 13F | Iat Reinsurance Co Ltd. | 1.193 | 0,00 | 23 | -21,43 | ||||
| 2026-01-30 | 13F | State of New Jersey Common Pension Fund D | 0 | -100,00 | 0 | |||||
| 2026-02-05 | 13F | Center for Financial Planning, Inc. | 50 | 0,00 | 1 | -100,00 | ||||
| 2026-02-17 | 13F | Canada Pension Plan Investment Board | 23.400 | 449 | ||||||
| 2026-02-12 | 13F | Jane Street Group, Llc | Call | 50.900 | -78,39 | 976 | -82,80 | |||
| 2026-02-12 | 13F | Jane Street Group, Llc | 227.883 | 229,18 | 4.369 | 162,03 | ||||
| 2026-02-17 | 13F | Man Group plc | 444.924 | 50,29 | 8.529 | 19,65 | ||||
| 2026-01-23 | 13F | Private Wealth Management Group, LLC | 392 | 0,00 | 8 | -22,22 | ||||
| 2026-02-13 | 13F | Peak6 Llc | Call | 0 | -100,00 | 0 | ||||
| 2026-01-20 | 13F | Harbor Capital Advisors, Inc. | 87.482 | 19,55 | 2 | 0,00 | ||||
| 2026-02-17 | 13F | Susquehanna International Group, Llp | Call | 56.000 | 18,14 | 1.074 | -5,96 | |||
| 2026-02-02 | 13F | Fifth Third Bancorp | 1.936 | -0,51 | 37 | -19,57 | ||||
| 2026-02-17 | 13F | Captrust Financial Advisors | 0 | -100,00 | 0 | |||||
| 2026-02-13 | 13F | Peak6 Llc | Put | 0 | -100,00 | 0 | ||||
| 2026-04-08 | 13F | Holos Integrated Wealth LLC | 4 | 0,00 | 0 | |||||
| 2026-02-09 | 13F | Huntington National Bank | 36 | 0,00 | 1 | |||||
| 2026-02-09 | 13F | Legal & General Group Plc | 207.939 | -8,31 | 3.986 | -27,00 | ||||
| 2026-02-11 | 13F | Deutsche Bank Ag\ | 852.097 | 20,72 | 16.335 | -3,90 | ||||
| 2026-02-13 | 13F | HITE Hedge Asset Management LLC | 1.924.117 | -2,89 | 36.885 | -22,69 | ||||
| 2026-02-13 | 13F | Walleye Trading LLC | Call | 15.700 | -32,91 | 301 | -46,71 | |||
| 2026-02-13 | 13F | Walleye Trading LLC | Put | 1.400 | -80,00 | 27 | -84,52 | |||
| 2026-02-13 | 13F | Dynamic Technology Lab Private Ltd | 17.943 | 344 | ||||||
| 2026-02-18 | 13F | GWM Advisors LLC | 19 | 0,00 | 0 | |||||
| 2025-11-14 | 13F | Raymond James Financial Inc | 0 | -100,00 | 0 | |||||
| 2026-02-17 | 13F | Ameriprise Financial Inc | 253.264 | -7,53 | 4.855 | -26,38 | ||||
| 2025-11-14 | 13F | Wolverine Trading, Llc | Call | 63.200 | -15,62 | 1.534 | 3,79 | |||
| 2026-01-27 | 13F | Atlantic Edge Private Wealth Management, LLC | 40 | 0,00 | 1 | |||||
| 2025-11-14 | 13F | Wolverine Trading, Llc | Put | 38.500 | -2,28 | 934 | 20,36 | |||
| 2026-04-10 | 13F | Abound Wealth Management | 0 | -100,00 | 0 | |||||
| 2025-11-07 | 13F | Putney Financial Group LLC | 0 | -100,00 | 0 | |||||
| 2026-02-12 | 13F | McMillan Office, Inc. | 15 | 0 | ||||||
| 2026-02-17 | 13F | XTX Topco Ltd | 48.799 | 935 | ||||||
| 2026-01-28 | 13F | Universal- Beteiligungs- und Servicegesellschaft mbH | 13.341 | 256 | ||||||
| 2026-02-17 | 13F | Limestone Investment Advisors LP | 258 | 0,00 | ||||||
| 2026-01-23 | 13F | State of Alaska, Department of Revenue | 44.874 | 0,03 | 1 | -100,00 | ||||
| 2026-02-11 | 13F | CenterBook Partners LP | 24.235 | 465 | ||||||
| 2026-02-13 | 13F | Public Sector Pension Investment Board | 0 | -100,00 | 0 | |||||
| 2026-02-10 | 13F | Bnp Paribas Arbitrage, Sa | 96.375 | 22,62 | 1.848 | -2,38 | ||||
| 2026-04-08 | 13F | Wealth Enhancement Advisory Services, Llc | 37.869 | 19,97 | 771 | 25,16 | ||||
| 2026-02-09 | 13F | Geode Capital Management, Llc | 1.916.522 | -2,67 | 36.748 | -22,51 | ||||
| 2026-02-17 | 13F | Voloridge Investment Management, Llc | 712.467 | 18,51 | 13.658 | -5,66 | ||||
| 2026-03-06 | 13F | Hsbc Holdings Plc | 68.477 | -15,23 | 1.309 | -32,30 | ||||
| 2025-11-14 | 13F | Texas Permanent School Fund | 0 | -100,00 | 0 | -100,00 | ||||
| 2026-04-13 | 13F | St Germain D J Co Inc | 2 | 0,00 | 0 | |||||
| 2026-04-13 | 13F | Trust Co | 26 | 0,00 | 1 | |||||
| 2026-02-17 | 13F | Gotham Asset Management, LLC | 15.026 | 44,37 | 288 | 15,20 | ||||
| 2026-02-12 | 13F | Wealthspire Advisors, LLC | 0 | -100,00 | 0 | |||||
| 2026-02-06 | 13F | Global Retirement Partners, LLC | 132 | 28,16 | 3 | 0,00 | ||||
| 2026-02-13 | 13F | Panagora Asset Management Inc | 113.329 | 17,44 | 2.173 | -6,50 | ||||
| 2026-02-12 | 13F | Counterpoint Mutual Funds LLC | 26.520 | 27,78 | 508 | 1,80 | ||||
| 2026-01-29 | 13F | UBS Group AG | 1.848.690 | 10,06 | 35.439 | -12,38 | ||||
| 2026-02-04 | 13F | Boyd Watterson Asset Management Llc/oh | 10 | 0,00 | 0 | |||||
| 2026-02-02 | 13F | Wolverine Asset Management Llc | Put | 9.100 | 174 | |||||
| 2026-02-10 | 13F | Natixis Advisors, L.p. | 15.387 | 0 | ||||||
| 2026-02-13 | 13F | Caitong International Asset Management Co., Ltd | 339 | 3,99 | 6 | -14,29 | ||||
| 2026-02-17 | 13F | Engineers Gate Manager LP | 636.138 | 311,47 | 12.195 | 227,62 | ||||
| 2026-02-12 | 13F | BlackRock, Inc. | 13.720.306 | -7,47 | 263.018 | -26,34 | ||||
| 2026-02-17 | 13F | Susquehanna International Group, Llp | 0 | -100,00 | 0 | -100,00 | ||||
| 2025-11-14 | 13F | Skopos Labs, Inc. | 0 | -100,00 | 0 | |||||
| 2026-02-17 | 13F/A | RBF Capital, LLC | 0 | -100,00 | 0 | |||||
| 2025-10-31 | 13F | Whittier Trust Co | 0 | -100,00 | 0 | |||||
| 2026-02-13 | 13F | Aigen Investment Management, Lp | 0 | -100,00 | 0 | |||||
| 2026-04-06 | 13F | Versant Capital Management, Inc | 5.814 | 0,00 | 118 | 5,41 | ||||
| 2026-02-10 | 13F | Connor, Clark & Lunn Investment Management Ltd. | 164.525 | 3.154 | ||||||
| 2026-02-17 | 13F | Tower Research Capital LLC (TRC) | 27.107 | 391,60 | 520 | 293,18 | ||||
| 2026-02-13 | 13F | SRS Capital Advisors, Inc. | 429 | -93,09 | 8 | -94,63 | ||||
| 2026-02-13 | 13F | MAI Capital Management | 394 | 225,62 | 8 | 250,00 | ||||
| 2026-02-02 | 13F | Oppenheimer Asset Management Inc. | 0 | -100,00 | 0 | |||||
| 2026-02-04 | 13F | Ameritas Advisory Services, LLC | 0 | -100,00 | 0 | |||||
| 2026-02-12 | 13F | Brown Brothers Harriman & Co | 0 | -100,00 | 0 | |||||
| 2025-11-14 | 13F | Susquehanna International Group, Llp | Put | 0 | -100,00 | 0 | -100,00 | |||
| 2026-02-13 | 13F | BNP Paribas Asset Management Holding S.A. | 438 | 0 | ||||||
| 2026-02-13 | 13F | Martingale Asset Management L P | 63.977 | -2,53 | 1.226 | -22,41 | ||||
| 2026-02-09 | 13F | Hantz Financial Services, Inc. | 1.263 | 10,79 | 0 | |||||
| 2026-02-12 | 13F | Renaissance Technologies Llc | 799.200 | 9,81 | 15.321 | -12,58 | ||||
| 2026-02-06 | 13F | Larson Financial Group LLC | 4 | 0,00 | 0 | |||||
| 2026-02-10 | 13F | Bruce G. Allen Investments, LLC | 29 | 0,00 | 1 | |||||
| 2026-01-28 | 13F | WPG Advisers, LLC | 4 | 0,00 | 0 | |||||
| 2025-11-13 | 13F | Quadrature Capital Ltd | 0 | -100,00 | 0 | |||||
| 2026-02-02 | 13F | Strs Ohio | 41.800 | 15,15 | 801 | -8,35 | ||||
| 2026-01-30 | 13F | Urban Wealth Management, LLC | 0 | -100,00 | 0 | |||||
| 2026-02-10 | 13F/A | Northwestern Mutual Wealth Management Co | 113 | -92,20 | 2 | -94,12 | ||||
| 2026-02-13 | 13F | Barclays Plc | 264.472 | 15,68 | 5.070 | -7,92 | ||||
| 2026-02-11 | 13F | Letko, Brosseau & Associates Inc | 1.576.385 | 5,31 | 30.219 | -16,16 | ||||
| 2026-02-12 | 13F | Campbell & CO Investment Adviser LLC | 236.893 | 4.541 | ||||||
| 2026-02-13 | 13F | Police & Firemen's Retirement System of New Jersey | 22.001 | -6,51 | 422 | -25,62 | ||||
| 2026-02-06 | 13F | Handelsbanken Fonder AB | 0 | -100,00 | 0 | |||||
| 2026-02-13 | 13F | Manufacturers Life Insurance Company, The | 0 | -100,00 | 0 | |||||
| 2026-02-19 | 13F | Invesco Ltd. | 1.599.937 | 38,57 | 30.671 | 10,32 | ||||
| 2026-01-26 | 13F | Cwm, Llc | 38.829 | -5,55 | 1 | |||||
| 2026-02-17 | 13F | Susquehanna Fundamental Investments, Llc | 40.821 | 0,00 | 783 | -20,37 | ||||
| 2026-02-03 | 13F | Farmers & Merchants Investments Inc | 40 | 0,00 | 1 | |||||
| 2026-02-17 | 13F | SageView Advisory Group, LLC | 50.777 | 0,00 | 973 | -20,38 | ||||
| 2025-11-12 | 13F | Aster Capital Management (DIFC) Ltd | 0 | -100,00 | 0 | |||||
| 2026-02-04 | 13F | Plato Investment Management Ltd | 181 | -94,92 | 3 | -96,47 | ||||
| 2026-02-10 | 13F | Quantbot Technologies LP | 91.379 | 45,39 | 1.752 | 15,73 | ||||
| 2026-02-13 | 13F | Walleye Capital LLC | Call | 0 | -100,00 | 0 | -100,00 | |||
| 2026-02-13 | 13F | Walleye Capital LLC | Put | 0 | -100,00 | 0 | -100,00 | |||
| 2025-11-05 | 13F | Koesten, Hirschmann & Crabtree, INC. | 0 | -100,00 | 0 | |||||
| 2026-04-13 | 13F | Massmutual Trust Co Fsb/adv | 1.564 | -28,06 | 32 | -24,39 | ||||
| 2026-02-12 | 13F | CIBC Private Wealth Group, LLC | 40 | 60,00 | 1 | |||||
| 2026-04-13 | 13F | True Wealth Design, LLC | 652 | 0,00 | 13 | 8,33 | ||||
| 2026-02-17 | 13F/A | Laurion Capital Management LP | 35.350 | 678 | ||||||
| 2026-02-17 | 13F | Quantinno Capital Management LP | 60.793 | 17,38 | 1.165 | -6,58 | ||||
| 2026-02-17 | 13F | Alliancebernstein L.p. | 107.749 | -3,64 | 2.066 | -23,29 | ||||
| 2026-01-29 | 13F | Vanguard Group Inc | 4.684.882 | 4,67 | 89.809 | -16,67 | ||||
| 2025-11-14 | 13F | ISAM Funds (UK) Ltd | 0 | -100,00 | 0 | |||||
| 2026-02-17 | 13F | Maryland State Retirement & Pension System | 11.509 | -1,46 | 221 | -21,71 | ||||
| 2026-02-18 | 13F | Mackenzie Financial Corp | 31.138 | 605 | ||||||
| 2025-11-14 | 13F | Voleon Capital Management Lp | 0 | -100,00 | 0 | |||||
| 2026-02-05 | 13F | Tucker Asset Management Llc | 3 | 0 | ||||||
| 2026-01-27 | 13F | Bayforest Capital Ltd | 9.144 | 947,42 | 175 | 733,33 | ||||
| 2026-02-05 | 13F | Allworth Financial LP | 453 | -1,74 | 9 | -27,27 | ||||
| 2026-01-29 | 13F | Camelot Portfolios, LLC | 7.971 | 153 | ||||||
| 2026-02-17 | 13F | Atom Investors LP | 98.457 | 1.887 | ||||||
| 2026-02-13 | 13F | Entropy Technologies, LP | 21.000 | 403 | ||||||
| 2025-11-12 | 13F | Transce3nd, LLC | 0 | -100,00 | 0 | |||||
| 2026-02-13 | 13F | Arrowstreet Capital, Limited Partnership | 1.957.047 | 3,53 | 37.517 | -17,58 | ||||
| 2026-04-13 | 13F | IFP Advisors, Inc | 4.039 | 1,25 | 82 | 6,58 | ||||
| 2026-02-04 | 13F | Versor Investments LP | 0 | -100,00 | 0 | |||||
| 2025-11-14 | 13F | Balyasny Asset Management Llc | 0 | -100,00 | 0 | |||||
| 2026-02-10 | 13F | Goldman Sachs Group Inc | 1.627.404 | -27,74 | 31.197 | -42,47 | ||||
| 2026-02-12 | 13F | Towle & Co | 425.168 | -4,12 | 8.150 | -23,67 | ||||
| 2026-01-27 | 13F | Zurcher Kantonalbank (Zurich Cantonalbank) | 29.806 | 0,00 | 571 | -20,36 | ||||
| 2026-02-17 | 13F | Soviero Asset Management, LP | 126.059 | -3,03 | 2.417 | -22,81 | ||||
| 2026-01-27 | 13F | Evergreen Capital Management Llc | 10.436 | -1,80 | 200 | -21,57 | ||||
| 2026-02-11 | 13F | Parallel Advisors, LLC | 2.669 | -0,07 | 51 | -20,31 | ||||
| 2026-02-06 | 13F | Pzena Investment Management Llc | 3.677.070 | -0,34 | 70.489 | -20,66 | ||||
| 2026-01-26 | 13F | Private Trust Co Na | 199 | 0,00 | 4 | -25,00 | ||||
| 2026-02-17 | 13F | Lighthouse Investment Partners, LLC | 39.017 | 22,68 | 748 | -2,35 | ||||
| 2026-02-12 | 13F | Nuveen, LLC | 755.317 | -16,67 | 14.479 | -33,66 | ||||
| 2026-02-13 | 13F | Citigroup Inc | 75.995 | 81,99 | 1.457 | 44,88 | ||||
| 2026-02-17 | 13F | Qube Research & Technologies Ltd | 510.807 | 9.792 | ||||||
| 2026-02-09 | 13F | Jefferies Financial Group Inc. | 96.414 | 1.848 | ||||||
| 2025-11-07 | 13F | Readystate Asset Management Lp | 0 | -100,00 | 0 | |||||
| 2026-01-29 | 13F | UMA Financial Services, Inc. | 78 | 0,00 | 1 | 0,00 | ||||
| 2026-02-17 | 13F | Advisory Services Network, LLC | 0 | -100,00 | 0 | -100,00 | ||||
| 2026-02-11 | 13F | Allianz Asset Management GmbH | 573.883 | 55,82 | 11.001 | 24,05 | ||||
| 2026-02-17 | 13F | MIRAE ASSET GLOBAL ETFS HOLDINGS Ltd. | 37.867 | -3,22 | 726 | -23,04 | ||||
| 2026-02-10 | 13F | Greenwich Wealth Management LLC | 31.500 | -0,71 | 1 | |||||
| 2026-01-26 | 13F | Main Street Group, LTD | 0 | -100,00 | 0 | |||||
| 2026-02-03 | 13F | Ballentine Partners, LLC | 10.966 | -4,86 | 210 | -24,19 | ||||
| 2026-02-11 | 13F | Gilpin Wealth Management, Llc | 3 | 0 | ||||||
| 2026-02-02 | 13F | CENTRAL TRUST Co | 5 | 0 | ||||||
| 2026-04-07 | 13F | Signaturefd, Llc | 9.235 | 0,94 | 187 | 6,29 | ||||
| 2026-02-11 | 13F | Brandywine Global Investment Management, LLC | 199.442 | -3,41 | 3.823 | -23,09 | ||||
| 2026-02-17 | 13F | Millennium Management Llc | 700.833 | -10,07 | 13.435 | -28,41 | ||||
| 2026-02-26 | 13F | TD Capital Management LLC | 23 | 0 | ||||||
| 2026-02-11 | 13F | Winton Capital Group Ltd | 40.541 | 777 | ||||||
| 2026-02-12 | 13F | MetLife Investment Management, LLC | 46.087 | -7,44 | 883 | -26,36 | ||||
| 2026-02-13 | 13F | Ubs Asset Management Americas Inc | 148.547 | -3,74 | 2.848 | -23,39 | ||||
| 2026-01-29 | 13F | Pictet Asset Management Holding SA | 12.231 | 12,44 | 234 | -10,34 | ||||
| 2026-02-12 | 13F | Ensign Peak Advisors, Inc | 7.141 | -67,53 | 137 | -74,29 | ||||
| 2026-02-11 | 13F | Meeder Asset Management Inc | 7.093 | 0,00 | 136 | -20,59 | ||||
| 2026-02-11 | 13F | O'shaughnessy Asset Management, Llc | 0 | -100,00 | 0 | |||||
| 2026-02-11 | 13F | Ameritas Investment Partners, Inc. | 7.036 | 135 | ||||||
| 2025-11-14 | 13F | Lazard Asset Management Llc | 0 | -100,00 | 0 | |||||
| 2025-10-30 | 13F | Twin Peaks Wealth Advisors, LLC | 0 | -100,00 | 0 | |||||
| 2026-02-13 | 13F | Pinnacle Wealth Planning Services, Inc. | 3.082 | 59 | ||||||
| 2026-01-09 | 13F | SG Americas Securities, LLC | 419.531 | 5.271,03 | 8 | |||||
| 2025-11-14 | 13F | Walleye Trading LLC | 0 | -100,00 | 0 | -100,00 | ||||
| 2026-02-17 | 13F | Amundi | 117.481 | 9,65 | 2.252 | -18,46 | ||||
| 2026-02-17 | 13F | Watershed Asset Management, L.L.C. | 0 | -100,00 | 0 | |||||
| 2026-02-17 | 13F | PharVision Advisers, LLC | 0 | -100,00 | 0 | |||||
| 2026-04-06 | 13F | GAMMA Investing LLC | 5.163 | -0,69 | 104 | 5,05 | ||||
| 2026-02-11 | 13F | Vise Technologies, Inc. | 11.615 | -5,08 | 223 | -24,49 | ||||
| 2025-11-14 | 13F | Walleye Capital LLC | 0 | -100,00 | 0 | -100,00 | ||||
| 2026-02-12 | 13F | Cibc World Markets Corp | 0 | -100,00 | 0 | |||||
| 2025-11-14 | 13F | Corton Capital Inc. | 11.704 | -27,75 | 282 | -10,79 | ||||
| 2026-02-13 | 13F | Public Employees Retirement Association Of Colorado | 6.751 | 0,00 | 0 | |||||
| 2026-02-03 | 13F | SummerHaven Investment Management, LLC | 37.126 | 0,00 | 712 | -20,38 | ||||
| 2026-02-06 | 13F | Fortis Group Advisors, LLC | 1 | 0,00 | 0 | |||||
| 2026-02-13 | 13F | Kilter Group LLC | 99 | 0,00 | 2 | -50,00 | ||||
| 2026-02-18 | 13F | State of Tennessee, Treasury Department | 17.789 | -47,32 | 370 | -54,49 | ||||
| 2026-02-12 | 13F | Advisors Asset Management, Inc. | 297 | 0,00 | 6 | -95,19 | ||||
| 2026-01-28 | 13F | Teacher Retirement System Of Texas | 28.290 | -59,05 | 542 | -67,41 | ||||
| 2026-02-17 | 13F | Creative Planning | 251.209 | -0,35 | 4.816 | -20,68 | ||||
| 2026-02-06 | 13F | ProShare Advisors LLC | 15.826 | 0,09 | 303 | -20,26 | ||||
| 2026-02-17 | 13F | Schonfeld Strategic Advisors LLC | 0 | -100,00 | 0 | |||||
| 2026-02-17 | 13F | Citadel Advisors Llc | Put | 0 | -100,00 | 0 | ||||
| 2026-02-17 | 13F | State Of Wisconsin Investment Board | 0 | -100,00 | 0 | |||||
| 2026-02-10 | 13F | Bank of New York Mellon Corp | 587.986 | -5,98 | 11.272 | -25,15 | ||||
| 2026-02-13 | 13F | First Trust Advisors Lp | 26.684 | -29,61 | 512 | -43,97 | ||||
| 2026-02-11 | 13F | Barrow Hanley Mewhinney & Strauss Llc | 553 | 0,00 | 11 | -23,08 | ||||
| 2026-02-06 | 13F | Leonteq Securities AG | 1.573 | 30 | ||||||
| 2026-02-14 | 13F | Rockefeller Capital Management L.P. | 814 | 428,57 | 16 | 400,00 | ||||
| 2025-11-14 | 13F | WealthTrak Capital Management LLC | 0 | -100,00 | 0 | |||||
| 2026-02-10 | 13F | Savant Capital, LLC | 0 | -100,00 | 0 | |||||
| 2026-02-17 | 13F | Royal Bank Of Canada | 6.432 | -99,12 | 123 | -99,30 | ||||
| 2026-01-15 | 13F | Nisa Investment Advisors, Llc | 1.898 | -29,05 | 36 | -43,75 | ||||
| 2026-02-11 | 13F | Group One Trading, L.p. | Call | 7.500 | -91,47 | 144 | -93,24 | |||
| 2026-02-11 | 13F | Franklin Resources Inc | 103.446 | -1,72 | 1.983 | -21,74 | ||||
| 2026-02-13 | 13F | Kestra Advisory Services, LLC | 5.013 | 96 | ||||||
| 2026-01-26 | 13F | KBC Group NV | 3.331 | 0,00 | 0 | |||||
| 2026-04-03 | 13F | Investors Research Corp | 931 | 0,00 | 19 | 5,88 | ||||
| 2026-02-13 | 13F | American Century Companies Inc | 186.147 | -12,96 | 3.568 | -30,70 | ||||
| 2026-02-17 | 13F | California State Teachers Retirement System | 75.558 | -0,32 | 1.448 | -20,66 | ||||
| 2026-02-09 | 13F | Smithfield Trust Co | 9 | 0,00 | 0 | |||||
| 2026-04-10 | 13F | Armstrong Advisory Group, Inc | 2 | 0,00 | 0 | |||||
| 2026-02-13 | 13F | Prudential Financial Inc | 64.597 | -6,48 | 1.238 | -25,56 | ||||
| 2026-04-07 | 13F | CoreCap Advisors, LLC | 8 | 0,00 | 0 | |||||
| 2026-02-03 | 13F | Asset Planning,Inc | 15 | 0,00 | 0 | |||||
| 2026-01-26 | 13F | JNBA Financial Advisors | 72 | 0,00 | 1 | 0,00 | ||||
| 2026-02-09 | 13F | Harbour Investments, Inc. | 267 | -3,61 | 5 | -16,67 | ||||
| 2026-02-13 | 13F | Morgan Stanley | 1.968.867 | 18,06 | 37.743 | -6,01 | ||||
| 2026-02-17 | 13F | D. E. Shaw & Co., Inc. | 3.436.583 | 10,47 | 65.879 | -12,06 | ||||
| 2026-02-17 | 13F | Jones Financial Companies Lllp | 4.101 | -14,33 | 79 | -33,33 | ||||
| 2026-02-17 | 13F | Janus Henderson Group Plc | 33.651 | 0,00 | 645 | -20,40 | ||||
| 2026-02-13 | 13F | Sei Investments Co | 171.960 | 63,08 | 3.296 | 29,81 | ||||
| 2026-02-11 | 13F | Manchester Capital Management LLC | 41 | 1 | ||||||
| 2026-01-21 | 13F | Sound Income Strategies, LLC | 503 | 11 | ||||||
| 2026-02-10 | 13F | Intech Investment Management Llc | 47.925 | -83,99 | 919 | -87,26 | ||||
| 2026-02-17 | 13F | Bridgeway Capital Management Inc | 588.455 | -6,11 | 11.281 | -25,25 | ||||
| 2026-02-06 | 13F | Pnc Financial Services Group, Inc. | 6.833 | -7,29 | 131 | -26,55 | ||||
| 2026-02-17 | 13F | Northern Trust Corp | 932.428 | -6,38 | 17.875 | -25,47 | ||||
| 2026-01-30 | 13F | Us Bancorp \de\ | 4.938 | -0,64 | 95 | -21,01 | ||||
| 2026-02-13 | 13F | Missouri Trust & Investment Co | 237 | 0,00 | 5 | -20,00 | ||||
| 2026-01-09 | 13F | Assenagon Asset Management S.A. | 791.499 | -2,56 | 15.173 | -22,43 | ||||
| 2026-02-05 | 13F | Thrivent Financial For Lutherans | 54.421 | -42,05 | 1 | -50,00 | ||||
| 2026-02-13 | 13F | State Street Corp | 3.231.329 | -2,72 | 61.945 | -22,56 | ||||
| 2026-02-12 | 13F | Johnson Financial Group, Inc. | 79 | 0,00 | 2 | 0,00 | ||||
| 2026-02-17 | 13F | Bank Of America Corp /de/ | 490.005 | 114,02 | 9.393 | 70,38 | ||||
| 2025-11-14 | 13F | Centiva Capital, LP | 0 | -100,00 | 0 | |||||
| 2026-02-13 | 13F | Bridgewater Associates, LP | 429.280 | -0,73 | 8.229 | -20,97 | ||||
| 2026-02-13 | 13F | Smartleaf Asset Management LLC | 686 | -4,46 | 13 | -23,53 | ||||
| 2026-01-23 | 13F | Westside Investment Management, Inc. | 552 | 0,00 | 11 | -23,08 | ||||
| 2026-02-05 | 13F | Atria Investments Llc | 10.751 | 4,06 | 206 | -16,94 | ||||
| 2026-02-13 | 13F | Wells Fargo & Company/mn | 100.287 | 10,46 | 1.923 | -12,08 | ||||
| 2026-02-17 | 13F | Woodline Partners LP | 1.531.607 | 113,66 | 29.361 | 70,09 | ||||
| 2026-04-10 | 13F | Matrix Trust Co | 600 | -19,57 | 0 | |||||
| 2026-02-11 | 13F | Prestige Wealth Management Group LLC | 8 | 0,00 | 0 | |||||
| 2026-02-13 | 13F | Squarepoint Ops LLC | 361.001 | 853,01 | 6.920 | 658,77 | ||||
| 2026-02-17 | 13F | Susquehanna Portfolio Strategies, LLC | 163.954 | 64,45 | 3.143 | 30,92 | ||||
| 2026-02-20 | 13F | Sunbelt Securities, Inc. | 50 | 0,00 | 1 | -100,00 | ||||
| 2025-11-14 | 13F | Algert Global Llc | 0 | -100,00 | 0 | |||||
| 2026-02-12 | 13F | Voya Investment Management Llc | 14.716 | -4,45 | 282 | -23,78 | ||||
| 2026-02-11 | 13F | Lyrical Asset Management Lp | 0 | -100,00 | 0 | |||||
| 2025-11-21 | 13F | Nebula Research & Development LLC | 0 | -100,00 | 0 | |||||
| 2026-02-13 | 13F | S&t Bank/pa | 50 | 0,00 | 1 | -100,00 | ||||
| 2026-02-12 | 13F | Federation des caisses Desjardins du Quebec | 28 | 0,00 | 1 | |||||
| 2026-02-17 | 13F | Citadel Advisors Llc | Call | 61.000 | -56,02 | 1.169 | -64,99 | |||
| 2026-02-10 | 13F | Acadian Asset Management Llc | 4.761 | -15,44 | 0 | |||||
| 2026-02-17 | 13F | Citadel Advisors Llc | 395.454 | 45,33 | 7.581 | 15,69 | ||||
| 2026-01-30 | 13F | Richardson Capital Management LLC | 14 | 0,00 | 0 | |||||
| 2026-02-05 | 13F | Navalign, LLC | 125 | 2 | ||||||
| 2026-02-10 | 13F | Globeflex Capital L P | 0 | -100,00 | 0 | |||||
| 2026-02-17 | 13F | Cetera Investment Advisers | 12.596 | 34,72 | 241 | 7,11 | ||||
| 2026-02-18 | 13F | Vident Advisory, LLC | 34.794 | 25,57 | 667 | 0,00 | ||||
| 2026-02-04 | 13F | Atlantic Union Bankshares Corp | 5 | 0,00 | 0 | |||||
| 2026-02-09 | 13F | Hartland & Co., LLC | 0 | -100,00 | 0 | |||||
| 2026-02-17 | 13F | Point72 Asset Management, L.P. | 245.809 | 4.712 | ||||||
| 2026-01-29 | 13F | UBS Group AG | Put | 0 | -100,00 | 0 | -100,00 | |||
| 2026-02-17 | 13F | Capital Fund Management S.a. | 43.463 | -55,06 | 833 | -64,22 | ||||
| 2026-01-15 | 13F | Allspring Global Investments Holdings, LLC | 10.162 | 9,32 | 193 | -14,60 | ||||
| 2026-04-09 | 13F | PFS Partners, LLC | 8 | -27,27 | 0 | |||||
| 2026-02-12 | 13F | Swiss National Bank | 160.298 | -1,60 | 3.073 | -21,67 | ||||
| 2026-01-30 | 13F | Activest Wealth Management | 0 | -100,00 | 0 | |||||
| 2025-11-12 | 13F/A | Norges Bank | 0 | -100,00 | 0 | -100,00 | ||||
| 2026-01-29 | 13F | IMC-Chicago, LLC | Put | 11.800 | 226 | |||||
| 2026-02-11 | 13F | Empowered Funds, LLC | 449.137 | -3,98 | 8.610 | -23,56 | ||||
| 2026-02-13 | 13F | Toroso Investments, LLC | 0 | -100,00 | 0 | |||||
| 2025-11-04 | 13F | High Note Wealth, LLC | 0 | -100,00 | 0 | |||||
| 2026-02-17 | 13F | Oxford Asset Management Llp | 15.359 | 294 | ||||||
| 2026-02-10 | 13F | Hillsdale Investment Management Inc. | 0 | -100,00 | 0 | |||||
| 2026-02-13 | 13F | Victory Capital Management Inc | 0 | -100,00 | 0 | |||||
| 2026-01-30 | 13F | Mitsubishi UFJ Trust & Banking Corp | 170.416 | -16,99 | 3.267 | -33,93 | ||||
| 2026-02-17 | 13F | Sciencast Management LP | 13.557 | 260 | ||||||
| 2026-01-30 | 13F | Caldwell Securities, Inc | 11 | 0,00 | 0 | |||||
| 2026-02-09 | 13F | MQS Management LLC | 13.829 | 265 | ||||||
| 2026-02-17 | 13F | Twinbeech Capital Lp | 105.440 | 2.021 | ||||||
| 2026-02-27 | 13F | Compass Financial Services Inc | 28 | 0,00 | 1 | |||||
| 2026-02-17 | 13F | Petrus Trust Company, LTA | 0 | -100,00 | 0 | -100,00 | ||||
| 2026-02-05 | 13F | Bessemer Group Inc | 532 | 0,00 | 0 | |||||
| 2026-02-17 | 13F | Aequim Alternative Investments LP | 70.000 | 0,00 | 1.342 | -20,42 | ||||
| 2026-02-17 | 13F | Trexquant Investment LP | 240.035 | -9,20 | 4.601 | -27,71 | ||||
| 2026-02-11 | 13F | Illinois Municipal Retirement Fund | 44.987 | -2,46 | 862 | -22,34 | ||||
| 2026-02-06 | 13F | Gsa Capital Partners Llp | 28.997 | -22,86 | 1 | |||||
| 2026-02-11 | 13F | Jpmorgan Chase & Co | 1.169.187 | -11,63 | 22.413 | -29,65 | ||||
| 2026-02-13 | 13F | Parkside Financial Bank & Trust | 65 | 0,00 | 1 | 0,00 | ||||
| 2026-02-17 | 13F | Two Sigma Investments, Lp | 764.184 | 359,42 | 14.649 | 265,77 | ||||
| 2026-02-02 | 13F | Wolverine Asset Management Llc | 104.705 | 3,37 | 2.007 | -17,71 | ||||
| 2025-11-13 | 13F | Glenmede Investment Management, LP | 9.071 | 218 | ||||||
| 2026-01-30 | 13F | Torren Management, LLC | 13 | 0 | ||||||
| 2026-02-10 | 13F | Mutual Of America Capital Management Llc | 0 | -100,00 | 0 | |||||
| 2026-02-17 | 13F | Jump Financial, LLC | 51.802 | 993 | ||||||
| 2026-02-13 | 13F | Evelyn Partners Investment Management LLP | 313 | 0,00 | 6 | -14,29 | ||||
| 2026-02-10 | 13F | Root Financial Partners, LLC | 4 | 0,00 | 0 | |||||
| 2026-02-03 | 13F | CGC Financial Services, LLC | 9 | 0,00 | 0 | |||||
| 2026-02-09 | 13F | Annis Gardner Whiting Capital Advisors, LLC | 59 | 0,00 | 1 | 0,00 | ||||
| 2026-02-12 | 13F | Dimensional Fund Advisors Lp | 4.173.061 | -1,01 | 79.999 | -21,20 |
Other Listings
| DE:18I | 16,96 € |