Grundlæggende statistik
| Institutionelle aktier (lange) | 50.899.663 - 22,86% (ex 13D/G) - change of -7,04MM shares -12,08% MRQ |
| Institutionel værdi (lang) | $ 1.101.056 USD ($1000) |
Institutionelt ejerskab og aktionærer
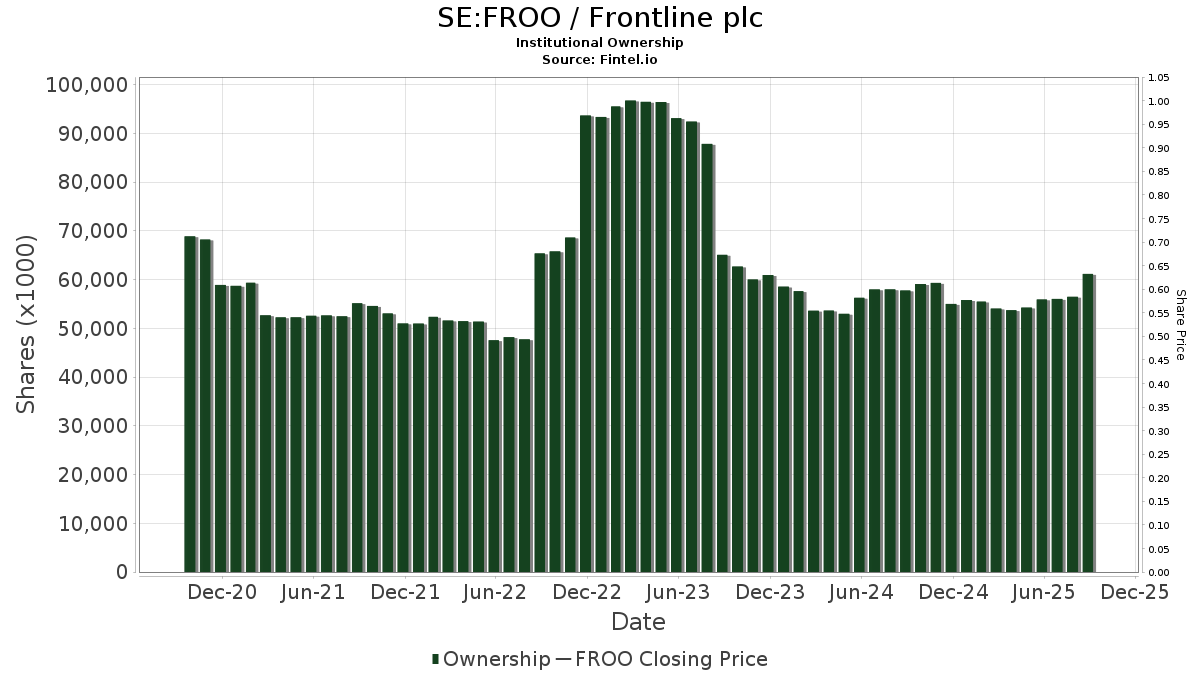
Frontline plc (SE:FROO) har 229 institutionelle ejere og aktionærer, der har indsendt 13D/G- eller 13F-formularer til Securities Exchange Commission (SEC). Disse institutioner har i alt 50,899,663 aktier. Største aktionærer omfatter Folketrygdfondet, Vanguard Group Inc, Citadel Advisors Llc, VGTSX - Vanguard Total International Stock Index Fund Investor Shares, Goldman Sachs Group Inc, UBS Group AG, Balyasny Asset Management Llc, Jane Street Group, Llc, Fmr Llc, and IEFA - iShares Core MSCI EAFE ETF .
Frontline plc (OM:FROO) institutionel ejerskabsstruktur viser aktuelle positioner i virksomheden efter institutioner og fonde, samt seneste ændringer i positionsstørrelse. Større aktionærer kan omfatte individuelle investorer, investeringsforeninger, hedgefonde eller institutioner. Skema 13D angiver, at investoren besidder (eller besidder) mere end 5 % af virksomheden og har til hensigt (eller har til hensigt at) aktivt at forfølge en ændring i forretningsstrategi. Skema 13G indikerer en passiv investering på over 5%.
Fondens stemningsscore
Fund Sentiment Score (fka Ownership Accumulation Score) finder de aktier, der bliver mest købt af fonde. Det er resultatet af en sofistikeret, multi-faktor kvantitativ model, der identificerer virksomheder med de højeste niveauer af institutionel akkumulering. Scoringsmodellen bruger en kombination af den samlede stigning i oplyste ejere, ændringerne i porteføljeallokeringer i disse ejere og andre målinger. Tallet går fra 0 til 100, hvor højere tal indikerer et højere niveau af akkumulering for sine jævnaldrende, og 50 er gennemsnittet.
Opdateringsfrekvens: Dagligt
Se Ownership Explorer, som giver en liste over højest rangerende virksomheder.
AI+ Ask Fintel’s AI assistant about Frontline plc.
Select a question to share a public post with an AI-crafted answer.
Thinking of good questions…
13F og NPORT arkivering
Detaljer om 13F-arkivering er gratis. Detaljer om NP-ansøgninger kræver et premium-medlemskab. Grønne rækker angiver nye positioner. Røde rækker angiver lukkede positioner. Klik på linket ikon for at se den fulde transaktionshistorik.
Opgrader
for at låse premium-data op og eksportere til Excel ![]() .
.
| Fil dato | Kilde | Investor | Type | Gennemsnitlig pris (Øst) |
Aktier | Δ Aktier (%) |
Rapporteret Værdi ($1000) |
Δ Værdi (%) |
Port Alloc (%) |
|
|---|---|---|---|---|---|---|---|---|---|---|
| 2026-02-23 | 13F | Virtu Financial LLC | 18.225 | 0 | ||||||
| 2026-02-17 | 13F | Two Sigma Investments, Lp | 769.458 | 1.329,29 | 16.790 | 1.269,41 | ||||
| 2025-09-25 | NP | DFIEX - International Core Equity Portfolio - Institutional Class This fund is a listed as child fund of Dimensional Fund Advisors Lp and if that institution has disclosed ownership in this security, then these positions will not be double counted when calculating total shares and total value | 271.217 | 0,00 | 4.994 | 9,23 | ||||
| 2026-02-17 | 13F | Armistice Capital, Llc | 13.069 | 285 | ||||||
| 2026-02-12 | 13F | Campbell & CO Investment Adviser LLC | 87.998 | 1.940 | ||||||
| 2026-02-17 | 13F | Bramshill Investments, LLC | 48.065 | 0,68 | 1.049 | -3,68 | ||||
| 2026-02-17 | 13F | Royal Bank Of Canada | 43.736 | -91,63 | 954 | -91,99 | ||||
| 2025-09-26 | NP | BKIE - BNY Mellon International Equity ETF | 5.674 | 73,46 | 106 | 90,91 | ||||
| 2026-01-23 | 13F | State of Alaska, Department of Revenue | 8.358 | 3,43 | 0 | |||||
| 2025-11-14 | 13F | Peak6 Llc | Put | 0 | -100,00 | 0 | -100,00 | |||
| 2026-02-17 | 13F | Millennium Management Llc | 83.092 | -83,81 | 1.813 | -84,50 | ||||
| 2026-02-17 | 13F | SummitTX Capital, L.P. | 138.811 | 3.029 | ||||||
| 2026-02-17 | 13F | D. E. Shaw & Co., Inc. | Call | 0 | -100,00 | 0 | ||||
| 2025-11-14 | 13F | Financial Sense Advisors, Inc. | 0 | -100,00 | 0 | |||||
| 2026-02-09 | 13F | Legal & General Group Plc | 245.799 | -0,52 | 5.413 | -4,09 | ||||
| 2026-02-17 | 13F | Melqart Asset Management (uk) Ltd | 100.016 | 421,05 | 2.182 | 399,31 | ||||
| 2026-02-17 | 13F | Magnetar Financial LLC | 203.017 | 1.223,10 | 4.430 | 1.169,05 | ||||
| 2026-01-26 | 13F | JNBA Financial Advisors | 250 | 0,00 | 5 | 0,00 | ||||
| 2026-02-13 | 13F | Ubs Asset Management Americas Inc | 240 | 5 | ||||||
| 2026-02-17 | 13F | Advisor Group Holdings, Inc. | 136.748 | -3,39 | 2.985 | -6,92 | ||||
| 2026-02-17 | 13F | Tudor Investment Corp Et Al | Put | 0 | -100,00 | 0 | -100,00 | |||
| 2026-02-17 | 13F | Manatuck Hill Partners, LLC | 13.300 | 290 | ||||||
| 2025-09-24 | NP | IEUS - iShares MSCI Europe Small-Cap ETF | 14.691 | 35,10 | 271 | 47,54 | ||||
| 2025-09-29 | NP | SDIV - Global X SuperDividend ETF This fund is a listed as child fund of Mirae Asset Global Investments Co., Ltd. and if that institution has disclosed ownership in this security, then these positions will not be double counted when calculating total shares and total value | 466.746 | 4,04 | 8.597 | 14,00 | ||||
| 2026-02-17 | 13F | Amundi | 213.530 | 13,05 | 4.659 | 7,35 | ||||
| 2026-02-11 | 13F | Deutsche Bank Ag\ | 418.496 | -5,12 | 9.132 | -9,16 | ||||
| 2026-02-11 | 13F | Simplex Trading, Llc | 0 | -100,00 | 0 | -100,00 | ||||
| 2026-01-12 | 13F | Seacrest Wealth Management, Llc | 10.825 | -3,56 | 256 | 2,81 | ||||
| 2026-02-05 | 13F | Qsemble Capital Management, LP | 61.335 | 1.338 | ||||||
| 2025-11-06 | 13F | Ameritas Advisory Services, LLC | 0 | -100,00 | 0 | |||||
| 2025-09-25 | NP | DFA INVESTMENT DIMENSIONS GROUP INC - International Vector Equity Portfolio Shares | 17.268 | 0,00 | 318 | 8,93 | ||||
| 2026-02-17 | 13F | Millennium Management Llc | Put | 0 | -100,00 | 0 | ||||
| 2026-01-26 | 13F | Svenska Handelsbanken AB (publ) | 54.734 | -30,82 | 1 | 0,00 | ||||
| 2026-01-29 | 13F | Vanguard Group Inc | 5.903.785 | 1,09 | 129.966 | -2,82 | ||||
| 2026-02-10 | 13F | Armor Advisors, L.l.c. | 0 | -100,00 | 0 | |||||
| 2026-02-14 | 13F | Rockefeller Capital Management L.P. | 215 | 202,82 | 5 | 300,00 | ||||
| 2025-11-12 | 13F | First Trust Advisors Lp | 0 | -100,00 | 0 | |||||
| 2026-01-14 | 13F | Nova Wealth Management, Inc. | 18 | 0,00 | 0 | |||||
| 2026-01-30 | 13F | Glenorchy Capital Ltd | 178.947 | -2,54 | 3.905 | -6,69 | ||||
| 2026-02-18 | 13F | Mackenzie Financial Corp | 16.542 | 365 | ||||||
| 2026-03-06 | 13F | Hsbc Holdings Plc | 226.079 | 195,57 | 4.922 | 183,63 | ||||
| 2026-02-12 | 13F | Swiss National Bank | 286.944 | 1,71 | 6.328 | -1,89 | ||||
| 2026-02-17 | 13F | XTX Topco Ltd | 29.773 | 4,00 | 650 | -0,46 | ||||
| 2025-11-12 | 13F | Transce3nd, LLC | 0 | -100,00 | 0 | |||||
| 2026-02-17 | 13F | Prelude Capital Management, Llc | 0 | -100,00 | 0 | |||||
| 2026-01-15 | 13F | SILVER OAK SECURITIES, Inc | 42.710 | 0,08 | 928 | -4,63 | ||||
| 2026-02-13 | 13F | Charles Schwab Investment Management Inc | 144.817 | 2,84 | 3.160 | -1,56 | ||||
| 2025-11-13 | 13F | Boston Partners | 0 | -100,00 | 0 | |||||
| 2025-11-14 | 13F | National Bank Of Canada /fi/ | 0 | -100,00 | 0 | |||||
| 2026-01-30 | 13F | Kiker Wealth Management, LLC | 0 | -100,00 | 0 | |||||
| 2026-01-21 | 13F | Sound Income Strategies, LLC | 2.415 | 63 | ||||||
| 2026-02-12 | 13F | Triumph Capital Management | 4.267 | 0,00 | 93 | -4,12 | ||||
| 2026-02-13 | 13F | Cozad Asset Management Inc | 12.707 | 1,76 | 277 | -2,46 | ||||
| 2025-11-13 | 13F | Hartree Partners, LP | 0 | -100,00 | 0 | |||||
| 2025-11-14 | 13F | Marathon Capital Management | 0 | -100,00 | 0 | |||||
| 2025-10-02 | 13F/A | Mirabella Financial Services Llp | Call | 17.200 | 255 | |||||
| 2026-02-13 | 13F | Dynamic Technology Lab Private Ltd | 15.691 | 342 | ||||||
| 2026-02-17 | 13F | Numerai GP LLC | 82.407 | 1.798 | ||||||
| 2026-03-12 | 13F/A | Peak6 Llc | Call | 3.800 | -99,28 | 83 | -99,32 | |||
| 2026-02-12 | 13F | BlackRock, Inc. | 383.015 | 47,92 | 8.357 | 41,62 | ||||
| 2026-03-12 | 13F/A | Peak6 Llc | 5.656 | 123 | ||||||
| 2025-10-31 | 13F | Y-Intercept (Hong Kong) Ltd | 0 | -100,00 | 0 | |||||
| 2026-02-17 | 13F | DZ BANK AG Deutsche Zentral Genossenschafts Bank, Frankfurt am Main | 303.934 | 2,65 | 6.632 | -1,97 | ||||
| 2026-02-17 | 13F | Quadrature Capital Ltd | 166.460 | 559,90 | 3.632 | 531,65 | ||||
| 2026-02-11 | 13F | Parallel Advisors, LLC | 825 | 0,00 | 18 | 0,00 | ||||
| 2026-02-17 | 13F | Jones Financial Companies Lllp | 3.037 | 77,08 | 66 | 69,23 | ||||
| 2025-09-25 | NP | VFSNX - Vanguard FTSE All-World ex-US Small-Cap Index Fund Institutional Shares | 476.858 | 4,00 | 8.781 | 13,58 | ||||
| 2026-02-17 | 13F | Fearnley Asset Management As | 71.746 | 6.997 | ||||||
| 2026-02-17 | 13F | D. E. Shaw & Co., Inc. | 360.668 | 7.870 | ||||||
| 2026-02-17 | 13F | Cresset Asset Management, LLC | 10.400 | 0,00 | 227 | -4,64 | ||||
| 2025-11-14 | 13F | Mpwm Advisory Solutions, Llc | 0 | -100,00 | 0 | |||||
| 2025-11-14 | 13F | Aventail Capital Group, LP | 0 | -100,00 | 0 | |||||
| 2025-09-24 | NP | EAISX - Parametric International Equity Fund Investor Class | 3.500 | 0,00 | 64 | 8,47 | ||||
| 2026-02-17 | 13F | Jain Global LLC | 76.528 | -59,99 | 1.670 | -61,71 | ||||
| 2026-02-17 | 13F | Canada Pension Plan Investment Board | 453.422 | 40,05 | 9.997 | 35,10 | ||||
| 2026-02-10 | 13F/A | Northwestern Mutual Wealth Management Co | 399 | -54,45 | 9 | -57,89 | ||||
| 2026-02-17 | 13F | Lighthouse Investment Partners, LLC | 0 | -100,00 | 0 | |||||
| 2025-09-25 | NP | DFAX - Dimensional World ex U.S. Core Equity 2 ETF | 50.587 | 4,42 | 942 | 15,32 | ||||
| 2025-09-25 | NP | VEURX - Vanguard European Stock Index Fund Investor Shares | 350.180 | 7,79 | 6.448 | 17,73 | ||||
| 2026-02-05 | 13F | Bessemer Group Inc | 145 | 0 | ||||||
| 2026-02-12 | 13F | Jane Street Group, Llc | 1.390.927 | 687,97 | 30.350 | 654,60 | ||||
| 2025-11-14 | 13F | Wolverine Trading, Llc | 22.378 | 510 | ||||||
| 2025-11-14 | 13F | Wolverine Trading, Llc | Call | 47.600 | -62,10 | 1.086 | -49,11 | |||
| 2026-02-10 | 13F | State of Wyoming | 5.784 | -43,37 | 126 | -45,69 | ||||
| 2026-02-12 | 13F | Jane Street Group, Llc | Put | 238.000 | -63,46 | 5.193 | -65,01 | |||
| 2026-02-13 | 13F | Mariner, LLC | 39.066 | -77,20 | 852 | -78,18 | ||||
| 2025-11-14 | 13F | Wolverine Trading, Llc | Put | 16.700 | 9,15 | 381 | 46,72 | |||
| 2026-02-12 | 13F | Jane Street Group, Llc | Call | 63.900 | -27,30 | 1.394 | -30,40 | |||
| 2026-02-13 | 13F | Morgan Stanley | 733.784 | -59,73 | 16.011 | -61,44 | ||||
| 2025-11-14 | 13F | SWAN Capital LLC | 0 | -100,00 | 0 | |||||
| 2026-01-14 | 13F | ORG Partners LLC | 150 | 0,00 | 3 | 0,00 | ||||
| 2026-02-13 | 13F | Kilter Group LLC | 122 | -19,21 | 3 | -33,33 | ||||
| 2026-02-09 | 13F | Harbour Investments, Inc. | 44 | 0,00 | 1 | -100,00 | ||||
| 2026-02-17 | 13F | Gotham Asset Management, LLC | 0 | -100,00 | 0 | |||||
| 2025-09-25 | NP | VGTSX - Vanguard Total International Stock Index Fund Investor Shares | 2.055.208 | 1,47 | 37.845 | 10,83 | ||||
| 2025-09-29 | NP | NORW - Global X FTSE Nordic Region ETF This fund is a listed as child fund of Mirae Asset Global Investments Co., Ltd. and if that institution has disclosed ownership in this security, then these positions will not be double counted when calculating total shares and total value | 43.778 | 1,23 | 815 | 11,81 | ||||
| 2026-02-13 | 13F | Barclays Plc | 826.343 | 256,90 | 18.031 | 241,74 | ||||
| 2026-02-03 | 13F | Chesapeake Capital Corp /il/ | 18.109 | 0,00 | 395 | -4,13 | ||||
| 2026-02-04 | 13F | GGM Financials LLC | 111 | 0,91 | 2 | 0,00 | ||||
| 2026-02-06 | 13F | Pnc Financial Services Group, Inc. | 507 | 0,00 | 11 | 0,00 | ||||
| 2026-01-26 | 13F | Cwm, Llc | 345 | 0,88 | 0 | |||||
| 2026-02-12 | 13F | Quadrant Capital Group Llc | 1.671 | -7,93 | 36 | -12,20 | ||||
| 2026-02-17 | 13F | Northern Trust Corp | 18.515 | 0,00 | 404 | -4,28 | ||||
| 2026-02-12 | 13F | BRYN MAWR TRUST Co | 0 | -100,00 | 0 | -100,00 | ||||
| 2026-02-12 | 13F | CIBC Private Wealth Group, LLC | 0 | -100,00 | 0 | |||||
| 2026-02-13 | 13F | Fieldview Capital Management, LLC | 29.700 | 648 | ||||||
| 2026-02-06 | 13F | Leonteq Securities AG | 16.612 | 362 | ||||||
| 2026-02-17 | 13F | Energy Income Partners, LLC | 87.514 | 1,33 | 1.910 | -3,00 | ||||
| 2026-02-17 | 13F | Engineers Gate Manager LP | 92.572 | 68,31 | 2.020 | 61,13 | ||||
| 2026-02-12 | 13F | Bank Of Montreal /can/ | 73.544 | 0,63 | 1.605 | -3,66 | ||||
| 2026-01-16 | 13F | Ronald Blue Trust, Inc. | 56 | 12,00 | 1 | 0,00 | ||||
| 2026-02-17 | 13F | Citadel Advisors Llc | Put | 138.200 | -9,20 | 3.016 | -13,06 | |||
| 2026-02-17 | 13F | Public Employees Retirement System Of Ohio | 45.762 | -6,63 | 1.008 | -10,00 | ||||
| 2025-09-25 | NP | DFA INVESTMENT DIMENSIONS GROUP INC - World ex U.S. Core Equity Portfolio Institutional Class Shares | 22.423 | -12,28 | 413 | -4,19 | ||||
| 2026-02-06 | 13F | Bare Financial Services, Inc | 83 | 0,00 | 2 | 0,00 | ||||
| 2026-02-17 | 13F | Susquehanna International Group, Llp | 579.787 | 39,78 | 12.651 | 33,82 | ||||
| 2025-10-23 | 13F | Klp Kapitalforvaltning As | 0 | -100,00 | 0 | |||||
| 2026-02-17 | 13F | Merewether Investment Management, LP | 0 | -100,00 | 0 | |||||
| 2026-02-17 | 13F | Susquehanna International Group, Llp | Put | 804.600 | 79,44 | 17.556 | 71,80 | |||
| 2026-02-13 | 13F | Sofos Investments, Inc. | 1.000 | -33,33 | 22 | -38,24 | ||||
| 2026-02-17 | 13F | Citadel Advisors Llc | Call | 202.500 | 12,19 | 4.419 | 7,42 | |||
| 2026-02-17 | 13F | Credit Agricole S A | 100.533 | 94,82 | 2.194 | 86,48 | ||||
| 2025-11-13 | 13F | Total Investment Management Inc | 0 | -100,00 | 0 | -100,00 | ||||
| 2025-09-26 | NP | FITFX - Fidelity Flex International Index Fund This fund is a listed as child fund of Fmr Llc and if that institution has disclosed ownership in this security, then these positions will not be double counted when calculating total shares and total value | 14.214 | 263 | ||||||
| 2026-02-17 | 13F | Citadel Advisors Llc | 2.113.755 | 2.917,84 | 46.122 | 2.789,85 | ||||
| 2026-02-17 | 13F | Susquehanna International Group, Llp | Call | 641.000 | 14,28 | 13.987 | 9,42 | |||
| 2025-09-24 | NP | IEFA - iShares Core MSCI EAFE ETF | 980.431 | 4,39 | 18.054 | 14,01 | ||||
| 2025-09-24 | NP | SCZ - iShares MSCI EAFE Small-Cap ETF | 465.554 | 0,36 | 8.573 | 9,60 | ||||
| 2026-02-17 | 13F | Mirabella Financial Services Llp | 10.958 | 239 | ||||||
| 2025-09-26 | NP | ETTOX - E*TRADE No Fee Total Market Index Fund | 107 | 328,00 | 2 | |||||
| 2026-02-13 | 13F | University Of Texas/texas Am Investment Managment Co | 1.137 | 25 | ||||||
| 2026-02-17 | 13F | Legacy Wealth Advisors, LLC | 50.453 | 1.101 | ||||||
| 2026-01-28 | 13F | Teacher Retirement System Of Texas | 17.754 | 387 | ||||||
| 2026-02-17 | 13F | SIH Partners, LLLP | Call | 74.200 | -50,37 | 1.619 | -52,48 | |||
| 2026-02-17 | 13F | SIH Partners, LLLP | 212.620 | -36,54 | 4.639 | -39,24 | ||||
| 2026-02-17 | 13F | SIH Partners, LLLP | Put | 236.800 | -37,77 | 5.167 | -40,42 | |||
| 2026-01-09 | 13F | SG Americas Securities, LLC | 0 | -100,00 | 0 | -100,00 | ||||
| 2026-02-03 | 13F | SBI Securities Co., Ltd. | 12.166 | -21,39 | 265 | -24,72 | ||||
| 2025-10-07 | 13F | Thurston, Springer, Miller, Herd & Titak, Inc. | 0 | -100,00 | 0 | |||||
| 2026-02-17 | 13F | Aquatic Capital Management LLC | 184.457 | 4.025 | ||||||
| 2026-02-17 | 13F | Russell Investments Group, Ltd. | 23.947 | -17,95 | 528 | -20,87 | ||||
| 2025-09-26 | NP | RTXAX - Tax-Managed Real Assets Fund Class A | 5.903 | 0,00 | 109 | 9,09 | ||||
| 2025-11-04 | 13F | Guerra Advisors Inc | 23 | 1 | ||||||
| 2026-02-11 | 13F | Group One Trading, L.p. | 2.821 | 62 | ||||||
| 2025-11-14 | 13F | Encompass Capital Advisors LLC | 0 | -100,00 | 0 | |||||
| 2026-02-13 | 13F | Integrated Wealth Concepts LLC | 18.206 | 12,35 | 397 | 7,59 | ||||
| 2025-11-13 | 13F | Jefferies Financial Group Inc. | Call | 0 | -100,00 | 0 | -100,00 | |||
| 2026-02-17 | 13F | Holocene Advisors, LP | 10.736 | 234 | ||||||
| 2025-09-25 | NP | DFIC - Dimensional International Core Equity 2 ETF | 76.437 | 0,00 | 1.423 | 10,40 | ||||
| 2026-02-13 | 13F | USS Investment Management Ltd | 17.659 | 0,00 | 387 | -3,97 | ||||
| 2026-02-09 | 13F | MQS Management LLC | 22.646 | 494 | ||||||
| 2026-01-29 | 13F | IMC-Chicago, LLC | 23.468 | 5,45 | 512 | 0,99 | ||||
| 2026-02-09 | 13F | Hartland & Co., LLC | 260 | 6 | ||||||
| 2026-02-13 | 13F | Forest Avenue Capital Management LP | 546.168 | 11.917 | ||||||
| 2026-02-13 | 13F | JustInvest LLC | 13.852 | -5,88 | 302 | -9,85 | ||||
| 2026-02-17 | 13F | Boothbay Fund Management, Llc | Put | 52.600 | 1.148 | |||||
| 2026-02-06 | 13F | EverSource Wealth Advisors, LLC | 929 | 0,43 | 20 | -4,76 | ||||
| 2026-01-30 | 13F | Us Bancorp \de\ | 202 | -32,44 | 4 | -33,33 | ||||
| 2025-11-12 | 13F | Neo Ivy Capital Management | 0 | -100,00 | 0 | |||||
| 2025-09-29 | NP | PXJ - Invesco Dynamic Oil & Gas Services ETF This fund is a listed as child fund of Invesco Ltd. and if that institution has disclosed ownership in this security, then these positions will not be double counted when calculating total shares and total value | 62.917 | -64,38 | 1.159 | -73,36 | ||||
| 2026-02-17 | 13F | Raymond James Financial Inc | 14.471 | -75,63 | 316 | -76,72 | ||||
| 2026-01-30 | 13F | Mitsubishi UFJ Trust & Banking Corp | 9.514 | -24,00 | 208 | -27,37 | ||||
| 2026-02-09 | 13F | GeoSphere Capital Management | 200.000 | 66,67 | 4.364 | 59,62 | ||||
| 2026-02-13 | 13F | American Century Companies Inc | 82.330 | -0,27 | 1.796 | -4,52 | ||||
| 2026-02-18 | 13F | Garton & Associates Financial Advisors LLC | 660 | 14 | ||||||
| 2026-02-17 | 13F | Ilex Capital Partners (UK) LLP | 0 | -100,00 | 0 | |||||
| 2025-10-28 | 13F | Rakuten Securities, Inc. | 0 | -100,00 | 0 | -100,00 | ||||
| 2026-02-13 | 13F | Pinnacle Wealth Planning Services, Inc. | 218 | 5 | ||||||
| 2026-02-17 | 13F | Capital Fund Management S.a. | Call | 10.400 | -32,47 | 227 | -35,43 | |||
| 2026-02-12 | 13F | Folketrygdfondet | 12.053.141 | -5,17 | 263.000 | -9,21 | ||||
| 2026-02-13 | 13F | Smartleaf Asset Management LLC | 400 | 9 | ||||||
| 2026-02-10 | 13F | Rothschild Investment Llc | 1.500 | 0,00 | 33 | -5,88 | ||||
| 2025-11-14 | 13F | Walleye Trading LLC | 0 | -100,00 | 0 | -100,00 | ||||
| 2026-01-27 | 13F | Zurcher Kantonalbank (Zurich Cantonalbank) | 54.255 | 0,00 | 1.184 | -4,29 | ||||
| 2025-09-24 | NP | Innovator ETFs Trust - Innovator U.S. Small Cap Managed Floor ETF | 1.318 | 6,20 | 24 | 20,00 | ||||
| 2026-02-04 | 13F | Boyd Watterson Asset Management Llc/oh | 55 | 0,00 | 1 | 0,00 | ||||
| 2026-02-13 | 13F | Citigroup Inc | 684.066 | 12,80 | 14.926 | 8,00 | ||||
| 2025-11-13 | 13F | MYDA Advisors LLC | 0 | -100,00 | 0 | |||||
| 2025-09-24 | NP | IXUS - iShares Core MSCI Total International Stock ETF | 225.907 | 19,89 | 4.160 | 30,95 | ||||
| 2026-01-27 | 13F | WealthCollab, LLC | 31 | 0,00 | 1 | |||||
| 2026-02-13 | 13F | Marshall Wace, Llp | 410.735 | 8.962 | ||||||
| 2026-02-12 | 13F | Commonwealth Equity Services, Llc | 36.472 | -2,77 | 796 | |||||
| 2026-02-12 | 13F | Counterpoint Mutual Funds LLC | 23.259 | 508 | ||||||
| 2026-01-16 | 13F | FNY Investment Advisers, LLC | 0 | -100,00 | 0 | |||||
| 2026-02-10 | 13F | Root Financial Partners, LLC | 122 | 0,00 | 3 | 0,00 | ||||
| 2026-01-16 | 13F | Banque Pictet & Cie Sa | 29.640 | 0,00 | 647 | -4,30 | ||||
| 2026-02-10 | 13F | Bank of New York Mellon Corp | 243.043 | -51,36 | 5.303 | -53,43 | ||||
| 2026-02-17 | 13F | Clear Street Markets Llc | 4.500 | 2,58 | 98 | -1,01 | ||||
| 2026-02-17 | 13F | Interval Partners, LP | 0 | -100,00 | 0 | |||||
| 2026-02-13 | 13F | Dymon Asia Capital (singapore) Pte. Ltd. | 0 | -100,00 | 0 | |||||
| 2025-11-14 | 13F | Larson Financial Group LLC | 0 | -100,00 | 0 | |||||
| 2025-09-26 | NP | EIPX - FT Energy Income Partners Strategy ETF | 37.916 | -2,33 | 698 | 7,06 | ||||
| 2026-02-12 | 13F | Rossby Financial, LCC | 33.873 | -16,80 | 739 | -20,62 | ||||
| 2026-02-17 | 13F | Graham Capital Management, L.P. | 16.969 | 59,54 | 370 | 52,89 | ||||
| 2025-09-25 | NP | DXIV - Dimensional International Vector Equity ETF | 697 | 15,78 | 13 | 20,00 | ||||
| 2026-01-29 | 13F | RMR Wealth Builders | 18.167 | 0,87 | 396 | -3,41 | ||||
| 2026-02-17 | 13F | Jump Financial, LLC | 74.876 | 1.634 | ||||||
| 2025-11-10 | 13F | Rossby Financial, LCC | Call | 0 | -100,00 | 0 | -100,00 | |||
| 2025-09-25 | NP | DFALX - Large Cap International Portfolio - Institutional Class This fund is a listed as child fund of Dimensional Fund Advisors Lp and if that institution has disclosed ownership in this security, then these positions will not be double counted when calculating total shares and total value | 61.270 | 0,00 | 1.128 | 9,30 | ||||
| 2026-02-19 | 13F | Invesco Ltd. | 77.413 | -11,06 | 1.689 | -14,83 | ||||
| 2026-01-21 | 13F | Newbridge Financial Services Group, Inc. | 1.000 | -4,76 | 22 | -8,70 | ||||
| 2026-02-17 | 13F | Integrated Advisors Network LLC | 0 | -100,00 | 0 | |||||
| 2026-02-18 | 13F | Caitlin John, LLC | 2 | 0,00 | 0 | |||||
| 2026-02-04 | 13F | Summit Wealth Group Llc / Co | 0 | -100,00 | 0 | |||||
| 2026-02-18 | 13F | Vident Advisory, LLC | 14.870 | 1,90 | 324 | -2,41 | ||||
| 2026-01-05 | 13F | GAMMA Investing LLC | 111 | 0,00 | 2 | 0,00 | ||||
| 2026-02-13 | 13F | Walleye Trading LLC | Call | 203.800 | 4,84 | 4.447 | 0,36 | |||
| 2026-02-17 | 13F | Advisory Services Network, LLC | 0 | -100,00 | 0 | |||||
| 2025-09-29 | NP | PDN - Invesco FTSE RAFI Developed Markets ex-U.S. Small-Mid ETF This fund is a listed as child fund of Invesco Ltd. and if that institution has disclosed ownership in this security, then these positions will not be double counted when calculating total shares and total value | 17.498 | 5,08 | 322 | 15,41 | ||||
| 2026-02-13 | 13F | Walleye Trading LLC | Put | 86.000 | 141,57 | 1.877 | 131,32 | |||
| 2026-02-10 | 13F | Goldman Sachs Group Inc | 1.511.243 | -6,34 | 32.975 | -10,33 | ||||
| 2026-02-17 | 13F | Qube Research & Technologies Ltd | 127.175 | 2.775 | ||||||
| 2025-11-17 | 13F | Alyeska Investment Group, L.P. | 0 | -100,00 | 0 | -100,00 | ||||
| 2026-02-17 | 13F | Sciencast Management LP | 137.554 | 3.001 | ||||||
| 2025-11-10 | 13F | Optiver Holding B.V. | 0 | -100,00 | 0 | |||||
| 2026-02-10 | 13F | Td Asset Management Inc | 19.679 | 8,35 | 434 | 4,34 | ||||
| 2026-02-11 | 13F | 111 Capital | 16.555 | 365 | ||||||
| 2026-02-12 | 13F | Skandinaviska Enskilda Banken AB (publ) | 583.166 | 882,42 | 15.162 | 1.021,45 | ||||
| 2026-02-17 | 13F | Tower Research Capital LLC (TRC) | 0 | -100,00 | 0 | |||||
| 2026-02-17 | 13F | Cetera Investment Advisers | 28.472 | 53,94 | 621 | 47,51 | ||||
| 2026-01-28 | 13F | Ruffer LLP | 0 | -100,00 | 0 | |||||
| 2025-09-26 | NP | FXINX - Fidelity Flex International Focused Index Fund | 238 | 4 | ||||||
| 2026-02-13 | 13F | Verition Fund Management LLC | 106.558 | 18,06 | 2.325 | 13,08 | ||||
| 2026-02-06 | 13F | Gsa Capital Partners Llp | 167.957 | 95,96 | 4 | 200,00 | ||||
| 2025-11-14 | 13F | Goldman Sachs Group Inc | Call | 0 | -100,00 | 0 | -100,00 | |||
| 2026-02-09 | 13F | Catalyst Funds Management Pty Ltd | 0 | -100,00 | 0 | |||||
| 2026-02-13 | 13F | Pinpoint Asset Management (Singapore) Pte. Ltd. | 272.455 | -12,71 | 5.945 | -16,43 | ||||
| 2025-11-14 | 13F | DeepCurrents Investment Group LLC | Call | 0 | -100,00 | 0 | ||||
| 2026-02-24 | 13F | Bell Investment Advisors, Inc | 28 | 0,00 | 1 | |||||
| 2026-01-07 | 13F | Aventura Private Wealth, LLC | 574 | 0,00 | 13 | -7,69 | ||||
| 2025-11-14 | 13F | Skopos Labs, Inc. | 0 | -100,00 | 0 | |||||
| 2026-02-11 | 13F | LPL Financial LLC | 69.922 | -0,94 | 1.526 | -5,16 | ||||
| 2025-09-26 | NP | FTLS - First Trust Long/Short Equity ETF This fund is a listed as child fund of First Trust Advisors Lp and if that institution has disclosed ownership in this security, then these positions will not be double counted when calculating total shares and total value | 96.819 | 1.783 | ||||||
| 2025-09-24 | NP | SFILX - Schwab Fundamental International Small Company Index Fund Institutional Shares | 21.719 | 21,00 | 400 | 32,89 | ||||
| 2026-02-12 | 13F | JPL Wealth Management, LLC | 0 | -100,00 | 0 | |||||
| 2026-02-13 | 13F | Walleye Capital LLC | 0 | -100,00 | 0 | -100,00 | ||||
| 2025-11-10 | 13F | X-Square Capital, LLC | 0 | -100,00 | 0 | |||||
| 2025-11-14 | 13F | Lazard Asset Management Llc | 0 | -100,00 | 0 | |||||
| 2025-11-12 | 13F | Park Square Financial Group, LLC | 0 | -100,00 | 0 | |||||
| 2025-09-26 | NP | FTIHX - Fidelity Total International Index Fund This fund is a listed as child fund of Fmr Llc and if that institution has disclosed ownership in this security, then these positions will not be double counted when calculating total shares and total value | 69.629 | 7,66 | 1.290 | 18,78 | ||||
| 2026-01-23 | 13F | Assetmark, Inc | 257 | 6 | ||||||
| 2026-02-17 | 13F | Alliancebernstein L.p. | 78.073 | -13,69 | 1.704 | -17,37 | ||||
| 2026-02-11 | 13F | Fox Run Management, L.l.c. | 68.194 | 1.488 | ||||||
| 2025-11-10 | 13F | Jupiter Asset Management Ltd | 0 | -100,00 | 0 | |||||
| 2026-02-17 | 13F | SALT Holding Corp. | 15.200 | 1,33 | 332 | -2,93 | ||||
| 2026-02-17 | 13F | SALT Holding Corp. | Call | 47.500 | -0,42 | 1.036 | -4,69 | |||
| 2026-02-17 | 13F | Trexquant Investment LP | 96.542 | -81,58 | 2.107 | -82,37 | ||||
| 2026-01-07 | 13F | Harbour Capital Advisors, LLC | 26.460 | -4,63 | 545 | -10,53 | ||||
| 2025-09-26 | NP | FZILX - Fidelity ZERO International Index Fund This fund is a listed as child fund of Fmr Llc and if that institution has disclosed ownership in this security, then these positions will not be double counted when calculating total shares and total value | 27.005 | 9,30 | 500 | 20,48 | ||||
| 2026-02-17 | 13F | Two Sigma Advisers, Lp | 395.700 | 287,26 | 8.634 | 270,88 | ||||
| 2025-11-14 | 13F | Quarry LP | 0 | -100,00 | 0 | |||||
| 2026-02-06 | 13F | IFP Advisors, Inc | 420 | 0,00 | 9 | 0,00 | ||||
| 2026-02-13 | 13F | Caitong International Asset Management Co., Ltd | 306 | -53,71 | 7 | -60,00 | ||||
| 2026-02-13 | 13F | Squarepoint Ops LLC | 152.693 | 3.332 | ||||||
| 2026-02-13 | 13F | Arrowstreet Capital, Limited Partnership | 121.509 | 2.661 | ||||||
| 2026-02-17 | 13F | Tudor Investment Corp Et Al | Call | 16.000 | -53,08 | 349 | -55,08 | |||
| 2026-02-12 | 13F | Renaissance Technologies Llc | 397.338 | -48,42 | 8.670 | -50,62 | ||||
| 2026-02-13 | 13F | SRS Capital Advisors, Inc. | 347 | 8 | ||||||
| 2026-02-17 | 13F | Fmr Llc | 1.176.245 | -85,70 | 25.666 | -86,31 | ||||
| 2026-02-17 | 13F | Tudor Investment Corp Et Al | 765.166 | 764,58 | 16.696 | 728,13 | ||||
| 2025-09-26 | NP | FSISX - Fidelity SAI International Small Cap Index Fund | 41.076 | 4,01 | 761 | 14,78 | ||||
| 2025-09-24 | NP | IEUR - iShares Core MSCI Europe ETF | 80.674 | 10,93 | 1.486 | 21,13 | ||||
| 2026-02-17 | 13F | ExodusPoint Capital Management, LP | 0 | -100,00 | 0 | -100,00 | ||||
| 2026-02-17 | 13F | Dark Forest Capital Management Lp | 0 | -100,00 | 0 | -100,00 | ||||
| 2026-02-17 | 13F | Bank Of America Corp /de/ | 551.715 | 52,47 | 12.038 | 45,99 | ||||
| 2026-02-13 | 13F | Marnell Management LLC | 109.319 | 2.385 | ||||||
| 2026-02-17 | 13F | IHT Wealth Management, LLC | 17.280 | 0,26 | 377 | -3,83 | ||||
| 2026-02-04 | 13F | Oxbow Advisors, LLC | 0 | -100,00 | 0 | |||||
| 2026-02-10 | 13F | Quantbot Technologies LP | 544.298 | 11.877 | ||||||
| 2026-01-23 | 13F | Farther Finance Advisors, LLC | 25.812 | 69,13 | 563 | 62,25 | ||||
| 2026-01-29 | 13F | Pictet Asset Management Holding SA | 29.331 | 4,28 | 647 | 0,62 | ||||
| 2025-09-25 | NP | DFAI - Dimensional International Core Equity Market ETF | 73.889 | 3,38 | 1.375 | 14,20 | ||||
| 2026-01-29 | 13F | UBS Group AG | 1.411.265 | 18,25 | 30.794 | 13,21 | ||||
| 2026-01-15 | 13F | Range Financial Group LLC | 82.450 | 12,41 | 1.799 | 7,66 | ||||
| 2025-10-08 | 13F/A | New York State Common Retirement Fund | 0 | -100,00 | 0 | -100,00 | ||||
| 2026-02-13 | 13F | Centiva Capital, LP | 21.062 | 460 | ||||||
| 2025-09-24 | NP | IDEV - iShares Core MSCI International Developed Markets ETF | 159.304 | -0,12 | 2.933 | 9,11 | ||||
| 2026-02-12 | 13F | Philadelphia Trust Co | 19.098 | -4,38 | 0 | |||||
| 2026-02-20 | 13F | Sunbelt Securities, Inc. | 0 | -100,00 | 0 | |||||
| 2026-03-09 | 13F | Lifetime Wealth Management P.C. | 6 | 245 | ||||||
| 2026-02-12 | 13F | Summit Financial, LLC | 145.000 | 0,00 | 3.164 | -4,27 | ||||
| 2026-02-11 | 13F | Jpmorgan Chase & Co | 424.021 | -24,49 | 9.252 | -27,70 | ||||
| 2026-02-17 | 13F | Voloridge Investment Management, Llc | 718.425 | 15.676 | ||||||
| 2026-02-17 | 13F | Corigliano Investment Advisers, LLC | 290.501 | -48,96 | 6.339 | -51,14 | ||||
| 2026-02-17 | 13F | Boothbay Fund Management, Llc | 0 | -100,00 | 0 | |||||
| 2025-09-23 | NP | GICIX - Goldman Sachs International Small Cap Insights Fund Institutional | 76.811 | 1.414 | ||||||
| 2026-01-27 | 13F | Bayforest Capital Ltd | 1.394 | -78,99 | 30 | -80,13 | ||||
| 2026-02-09 | 13F | Jefferies Financial Group Inc. | 92.098 | -34,17 | 2.023 | -36,69 | ||||
| 2026-02-12 | 13F | Steward Partners Investment Advisory, Llc | 9.503 | 0,74 | 207 | -3,27 | ||||
| 2026-02-05 | 13F | Allworth Financial LP | 1.500 | 4,68 | 33 | 0,00 | ||||
| 2026-02-13 | 13F | Macquarie Group Ltd | 0 | -100,00 | 0 | |||||
| 2026-02-09 | 13F | Smead Capital Management, Inc. | 586.729 | -0,60 | 12.937 | -3,92 | ||||
| 2026-02-13 | 13F | Toroso Investments, LLC | 109.855 | -1,02 | 2.397 | -5,22 | ||||
| 2026-02-17 | 13F | Point72 Asset Management, L.P. | 800.488 | 17.467 | ||||||
| 2026-02-17 | 13F | Discovery Capital Management, Llc / Ct | 160.100 | -35,96 | 3.493 | -38,69 | ||||
| 2026-02-17 | 13F | Point72 Asset Management, L.P. | Call | 9.600 | 209 | |||||
| 2025-09-25 | NP | VT - Vanguard Total World Stock Index Fund ETF Shares | 94.280 | 0,00 | 1.736 | 9,25 | ||||
| 2026-01-28 | 13F | DekaBank Deutsche Girozentrale | 114.312 | 0,00 | 3 | 50,00 | ||||
| 2026-02-17 | 13F | Cantor Fitzgerald, L. P. | 0 | -100,00 | 0 | -100,00 | ||||
| 2026-02-17 | 13F | Private Advisor Group, LLC | 21.738 | -17,34 | 474 | -20,87 | ||||
| 2025-10-31 | 13F | Whittier Trust Co | 0 | -100,00 | 0 | |||||
| 2026-02-17 | 13F | Occudo Quantitative Strategies Lp | 41.151 | 898 | ||||||
| 2026-02-13 | 13F | Manufacturers Life Insurance Company, The | 0 | -100,00 | 0 | |||||
| 2026-02-12 | 13F | Nuveen, LLC | 108.993 | 0,00 | 2.403 | -3,49 | ||||
| 2026-02-13 | 13F | Walleye Capital LLC | Call | 74.900 | 63,18 | 1.634 | 56,21 | |||
| 2026-02-17 | 13F | Balyasny Asset Management Llc | 1.396.000 | -37,88 | 30.461 | -40,52 | ||||
| 2026-02-13 | 13F | Walleye Capital LLC | Put | 51.800 | -13,09 | 1.130 | -16,79 | |||
| 2026-02-17 | 13F | Schonfeld Strategic Advisors LLC | 164.300 | 3.585 | ||||||
| 2026-02-17 | 13F | Moore Capital Management, Lp | 307.779 | 28,58 | 6.729 | 23,07 | ||||
| 2026-01-20 | 13F | Signaturefd, Llc | 1.984 | -0,50 | 43 | -4,44 | ||||
| 2026-02-09 | 13F | Jefferies Financial Group Inc. | Put | 107.500 | 207,14 | 2.346 | 194,23 | |||
| 2026-02-13 | 13F | Wells Fargo & Company/mn | 15.016 | 36,30 | 328 | 30,28 | ||||
| 2025-11-14 | 13F | Cooper Creek Partners Management Llc | 0 | -100,00 | 0 | |||||
| 2026-02-17 | 13F | MIRAE ASSET GLOBAL ETFS HOLDINGS Ltd. | 70.489 | -91,16 | 1.467 | -91,93 | ||||
| 2025-09-26 | NP | ETISX - E*TRADE No Fee International Index Fund | 180 | 0,00 | 3 | 0,00 | ||||
| 2026-02-10 | 13F | Bnp Paribas Arbitrage, Sa | 79.625 | 69,88 | 1.737 | 62,64 | ||||
| 2026-02-13 | 13F | MAI Capital Management | 59 | -62,89 | 1 | -66,67 |