Grundlæggende statistik
| Institutionelle ejere | 84 total, 81 long only, 0 short only, 3 long/short - change of 11,76% MRQ |
| Gennemsnitlig porteføljeallokering | 0.1851 % - change of -37,05% MRQ |
| Institutionelle aktier (lange) | 39.737.526 (ex 13D/G) - change of 16,23MM shares 54,87% MRQ |
| Institutionel værdi (lang) | $ 61.959 USD ($1000) |
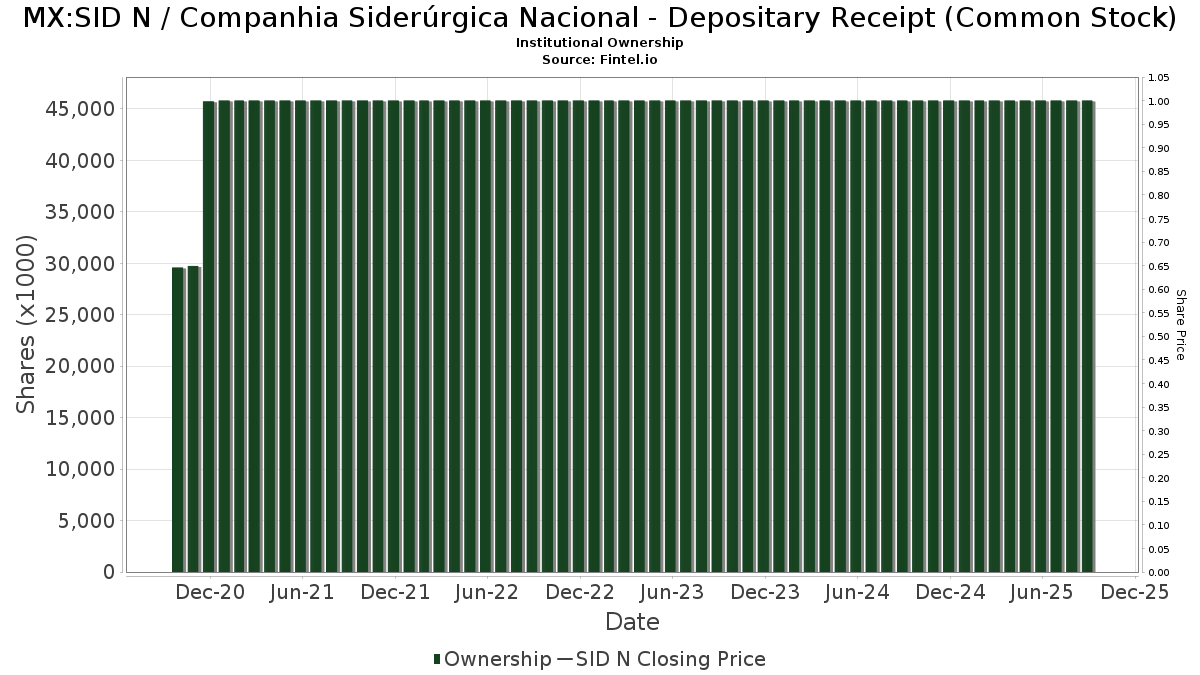
Institutionelt ejerskab og aktionærer
Companhia Siderúrgica Nacional - Depositary Receipt (Common Stock) (MX:SID N) har 84 institutionelle ejere og aktionærer, der har indsendt 13D/G- eller 13F-formularer til Securities Exchange Commission (SEC). Disse institutioner har i alt 39,737,526 aktier. Største aktionærer omfatter Vanguard Group Inc, Dimensional Fund Advisors Lp, Renaissance Technologies Llc, Millennium Management Llc, American Century Companies Inc, Jane Street Group, Llc, Citadel Advisors Llc, Two Sigma Investments, Lp, State Street Corp, and Morgan Stanley .
Companhia Siderúrgica Nacional - Depositary Receipt (Common Stock) (BMV:SID N) institutionel ejerskabsstruktur viser aktuelle positioner i virksomheden efter institutioner og fonde, samt seneste ændringer i positionsstørrelse. Større aktionærer kan omfatte individuelle investorer, investeringsforeninger, hedgefonde eller institutioner. Skema 13D angiver, at investoren besidder (eller besidder) mere end 5 % af virksomheden og har til hensigt (eller har til hensigt at) aktivt at forfølge en ændring i forretningsstrategi. Skema 13G indikerer en passiv investering på over 5%.
Fondens stemningsscore
Fund Sentiment Score (fka Ownership Accumulation Score) finder de aktier, der bliver mest købt af fonde. Det er resultatet af en sofistikeret, multi-faktor kvantitativ model, der identificerer virksomheder med de højeste niveauer af institutionel akkumulering. Scoringsmodellen bruger en kombination af den samlede stigning i oplyste ejere, ændringerne i porteføljeallokeringer i disse ejere og andre målinger. Tallet går fra 0 til 100, hvor højere tal indikerer et højere niveau af akkumulering for sine jævnaldrende, og 50 er gennemsnittet.
Opdateringsfrekvens: Dagligt
Se Ownership Explorer, som giver en liste over højest rangerende virksomheder.
AI+ Ask Fintel’s AI assistant about Companhia Siderúrgica Nacional - Depositary Receipt (Common Stock).
Select a question to share a public post with an AI-crafted answer.
Thinking of good questions…
13F og NPORT arkivering
Detaljer om 13F-arkivering er gratis. Detaljer om NP-ansøgninger kræver et premium-medlemskab. Grønne rækker angiver nye positioner. Røde rækker angiver lukkede positioner. Klik på linket ikon for at se den fulde transaktionshistorik.
Opgrader
for at låse premium-data op og eksportere til Excel ![]() .
.
| Fil dato | Kilde | Investor | Type | Gennemsnitlig pris (Øst) |
Aktier | Δ Aktier (%) |
Rapporteret Værdi ($1000) |
Δ Værdi (%) |
Port Alloc (%) |
|
|---|---|---|---|---|---|---|---|---|---|---|
| 2026-02-11 | 13F | Simplex Trading, Llc | 0 | -100,00 | 0 | |||||
| 2026-02-11 | 13F | Simplex Trading, Llc | Put | 0 | -100,00 | 0 | ||||
| 2025-11-06 | 13F | CAPROCK Group, Inc. | 0 | -100,00 | 0 | -100,00 | ||||
| 2026-01-26 | 13F | Mirae Asset Global Investments Co., Ltd. | 21.091 | 0,00 | 34 | 6,45 | ||||
| 2026-03-11 | 13F | Leonteq Securities AG | 0 | -100,00 | 0 | |||||
| 2026-02-05 | 13F | Allworth Financial LP | 200 | 0,00 | 0 | |||||
| 2026-02-06 | 13F | Pnc Financial Services Group, Inc. | 4.002 | -55,70 | 6 | -53,85 | ||||
| 2025-11-14 | 13F | Wetherby Asset Management Inc | 0 | -100,00 | 0 | |||||
| 2026-02-11 | 13F | LPL Financial LLC | 21.368 | 34 | ||||||
| 2026-02-17 | 13F | Citadel Advisors Llc | Call | 33.000 | -2,37 | 53 | 4,00 | |||
| 2026-02-17 | 13F | Point72 Asset Management, L.P. | 164.746 | 264 | ||||||
| 2025-11-14 | 13F | Raymond James Financial Inc | 0 | -100,00 | 0 | |||||
| 2026-01-29 | 13F | UBS Group AG | 1.271.933 | -20,18 | 2.035 | -14,85 | ||||
| 2025-11-14 | 13F | Manufacturers Life Insurance Company, The | 0 | -100,00 | 0 | -100,00 | ||||
| 2026-02-13 | 13F | Ubs Asset Management Americas Inc | 1.946 | 3 | ||||||
| 2026-02-17 | 13F | Advisor Group Holdings, Inc. | 0 | -100,00 | 0 | |||||
| 2026-02-13 | 13F | Mariner, LLC | 14.506 | -5,26 | 23 | 4,55 | ||||
| 2026-02-13 | 13F | Inspire Advisors, LLC | 92.981 | -3,56 | 149 | 2,78 | ||||
| 2025-11-12 | 13F | Simplex Trading, Llc | Call | 0 | -100,00 | 0 | ||||
| 2026-02-06 | 13F | Plan A Wealth LLC | 36.975 | 10,63 | 59 | 18,00 | ||||
| 2026-04-20 | 13F | Banque Cantonale Vaudoise | 1.600.000 | 100,00 | 1.984 | 55,00 | ||||
| 2026-01-26 | 13F | Cwm, Llc | 600 | 0,00 | 0 | |||||
| 2026-02-02 | 13F | Qrg Capital Management, Inc. | 0 | -100,00 | 0 | |||||
| 2026-02-13 | 13F | Marshall Wace, Llp | 580.998 | 930 | ||||||
| 2026-02-17 | 13F | Quadrature Capital Ltd | 286.586 | 179,74 | 459 | 199,35 | ||||
| 2026-02-17 | 13F | Citadel Advisors Llc | 2.009.008 | -31,66 | 3.214 | -27,10 | ||||
| 2026-02-17 | 13F | Northern Trust Corp | 571.426 | 0,85 | 914 | 7,66 | ||||
| 2026-02-13 | 13F | Morgan Stanley | 1.639.146 | 754,93 | 2.623 | 813,59 | ||||
| 2026-04-21 | 13F | SmartHarvest Portfolios, LLC | 33.216 | 41 | ||||||
| 2026-02-17 | 13F | Scientech Research LLC | 0 | -100,00 | 0 | |||||
| 2026-02-12 | 13F | Insigneo Advisory Services, Llc | 22.260 | 1,18 | 36 | 6,06 | ||||
| 2026-02-11 | 13F | Group One Trading, L.p. | 0 | -100,00 | 0 | -100,00 | ||||
| 2026-02-10 | 13F | Bnp Paribas Arbitrage, Sa | 480.979 | -34,07 | 770 | -29,71 | ||||
| 2026-02-11 | 13F | Group One Trading, L.p. | Put | 52.000 | -88,96 | 83 | -88,24 | |||
| 2026-02-13 | 13F | Wells Fargo & Company/mn | 16.501 | 64,99 | 26 | 73,33 | ||||
| 2026-02-13 | 13F | Headlands Technologies LLC | 41.618 | 67 | ||||||
| 2026-02-11 | 13F | Group One Trading, L.p. | Call | 33.800 | -30,74 | 54 | -26,03 | |||
| 2026-02-13 | 13F/A | Virtus ETF Advisers LLC | 0 | -100,00 | 0 | |||||
| 2026-04-23 | 13F | CWM Advisors, LLC | 52.369 | -2,45 | 65 | -24,71 | ||||
| 2026-02-13 | 13F | National Bank Of Canada /fi/ | 1.959 | 0,00 | 3 | 50,00 | ||||
| 2026-02-11 | 13F | Jpmorgan Chase & Co | 780.445 | 107.696,27 | 1.249 | 124.700,00 | ||||
| 2026-02-17 | 13F | Millennium Management Llc | 3.162.952 | -17,21 | 5.061 | -11,69 | ||||
| 2026-02-17 | 13F | D. E. Shaw & Co., Inc. | 149.566 | -35,76 | 239 | -31,52 | ||||
| 2026-02-17 | 13F | Stokes Family Office, LLC | 80.000 | 128 | ||||||
| 2026-02-12 | 13F | Renaissance Technologies Llc | 3.537.900 | 95,82 | 5.661 | 108,86 | ||||
| 2026-02-12 | 13F | BlackRock, Inc. | 364.053 | -85,28 | 582 | -84,30 | ||||
| 2026-02-17 | 13F | Susquehanna International Group, Llp | 147.307 | -32,56 | 236 | -28,13 | ||||
| 2026-02-13 | 13F | Squarepoint Ops LLC | 0 | -100,00 | 0 | -100,00 | ||||
| 2025-11-14 | 13F | Flow Traders U.s. Llc | 0 | -100,00 | 0 | |||||
| 2026-02-03 | 13F | SBI Securities Co., Ltd. | 6.940 | -39,96 | 11 | -35,29 | ||||
| 2026-02-17 | 13F | Jones Financial Companies Lllp | 1.687 | -5,86 | 3 | 0,00 | ||||
| 2026-01-15 | 13F | Lodestone Wealth Management LLC | 2.095 | 3 | ||||||
| 2026-02-18 | 13F | Vident Advisory, LLC | 17.747 | -36,49 | 28 | -31,71 | ||||
| 2026-02-19 | 13F | Invesco Ltd. | 176.581 | -18,59 | 283 | -13,23 | ||||
| 2026-02-10 | 13F | Goldman Sachs Group Inc | 1.516.407 | 706,63 | 2.426 | 763,35 | ||||
| 2026-04-16 | 13F | SG Americas Securities, LLC | 19.929 | -79,98 | 0 | |||||
| 2026-02-13 | 13F | Van Eck Associates Corp | 459.455 | -82,29 | 1 | -100,00 | ||||
| 2025-11-13 | 13F | EntryPoint Capital, LLC | 0 | -100,00 | 0 | |||||
| 2026-02-17 | 13F | Qube Research & Technologies Ltd | 35.610 | 57 | ||||||
| 2026-02-13 | 13F | SPX Equities Gestao de Recursos Ltda | 3.107 | 5 | ||||||
| 2026-02-12 | 13F | Triumph Capital Management | 2.000 | 0,00 | 3 | 0,00 | ||||
| 2026-02-17 | 13F | Aquatic Capital Management LLC | 42.643 | 68 | ||||||
| 2026-02-17 | 13F | XTX Topco Ltd | 743.512 | 306,83 | 1.190 | 333,94 | ||||
| 2025-11-12 | 13F | Steward Partners Investment Advisory, Llc | 0 | -100,00 | 0 | |||||
| 2026-02-12 | 13F | Dimensional Fund Advisors Lp | 3.587.062 | -0,62 | 5.745 | 6,06 | ||||
| 2026-02-04 | 13F | Argos Wealth Advisors, LLC | 10.762 | 17 | ||||||
| 2026-01-28 | 13F | Kapitalo Investimentos Ltda | 56.779 | 0,00 | 91 | 5,88 | ||||
| 2026-02-09 | 13F | Huntington National Bank | 1 | 0,00 | 0 | |||||
| 2026-02-10 | 13F | CIBC World Markets Inc. | 114.500 | 183 | ||||||
| 2026-02-17 | 13F | Brevan Howard Capital Management LP | 0 | -100,00 | 0 | |||||
| 2026-02-17 | 13F/A | RBF Capital, LLC | 0 | -100,00 | 0 | |||||
| 2026-02-13 | 13F | Citigroup Inc | 12.481 | -29,85 | 20 | -26,92 | ||||
| 2026-02-13 | 13F | VPR Management LLC | 55.740 | 0,00 | 89 | 7,23 | ||||
| 2026-02-13 | 13F | Mml Investors Services, Llc | 17.729 | 32,51 | 28 | 40,00 | ||||
| 2026-02-17 | 13F | Two Sigma Securities, Llc | 0 | -100,00 | 0 | -100,00 | ||||
| 2026-02-11 | 13F | Parallel Advisors, LLC | 3.010 | -30,16 | 5 | -33,33 | ||||
| 2026-02-17 | 13F | Two Sigma Investments, Lp | 1.935.866 | 449,82 | 3.097 | 486,55 | ||||
| 2026-02-17 | 13F | Susquehanna International Group, Llp | Call | 0 | -100,00 | 0 | -100,00 | |||
| 2025-11-20 | 13F | First Affirmative Financial Network | 34.464 | -10,22 | 52 | -3,77 | ||||
| 2026-03-06 | 13F | Hsbc Holdings Plc | 0 | -100,00 | 0 | -100,00 | ||||
| 2026-02-12 | 13F | Federation des caisses Desjardins du Quebec | 0 | -100,00 | 0 | |||||
| 2026-01-30 | 13F | Us Bancorp \de\ | 5.310 | 0,00 | 8 | 14,29 | ||||
| 2026-02-17 | 13F | Optiver Holding B.V. | Put | 73.300 | 61,81 | 117 | 74,63 | |||
| 2026-02-17 | 13F | Citadel Advisors Llc | Put | 0 | -100,00 | 0 | ||||
| 2026-02-17 | 13F | Optiver Holding B.V. | Call | 1.000 | 2 | |||||
| 2026-01-23 | 13F | Assetmark, Inc | 2.223 | -12,65 | 4 | 0,00 | ||||
| 2026-02-13 | 13F | Barclays Plc | 4.817 | -97,90 | 8 | -97,97 | ||||
| 2026-02-06 | 13F | EverSource Wealth Advisors, LLC | 948 | 178,82 | 2 | |||||
| 2026-02-13 | 13F | American Century Companies Inc | 2.546.337 | 15,64 | 4.074 | 23,38 | ||||
| 2025-11-14 | 13F | Tower Research Capital LLC (TRC) | 0 | -100,00 | 0 | -100,00 | ||||
| 2026-01-29 | 13F | Vanguard Group Inc | 4.804.030 | 0,00 | 7.686 | 6,66 | ||||
| 2026-02-17 | 13F | Fmr Llc | 7.901 | -38,50 | 13 | -36,84 | ||||
| 2026-02-19 | 13F | CI Private Wealth, LLC | 11.350 | -19,95 | 18 | -14,29 | ||||
| 2026-04-07 | 13F | Farther Finance Advisors, LLC | 568 | 0,00 | 1 | |||||
| 2026-02-13 | 13F | Aigen Investment Management, Lp | 0 | -100,00 | 0 | |||||
| 2026-02-12 | 13F | Jane Street Group, Llc | 2.539.989 | 365,82 | 4.064 | 396,82 | ||||
| 2026-02-12 | 13F | Jane Street Group, Llc | Put | 18.700 | 30 | |||||
| 2026-02-12 | 13F | Jane Street Group, Llc | Call | 25.500 | 41 | |||||
| 2025-11-14 | 13F | Graham Capital Management, L.P. | 0 | -100,00 | 0 | -100,00 | ||||
| 2025-10-27 | 13F | Kiker Wealth Management, LLC | 0 | -100,00 | 0 | |||||
| 2026-02-18 | 13F | Garton & Associates Financial Advisors LLC | 3.169 | 5 | ||||||
| 2026-03-03 | 13F/A | Caitong International Asset Management Co., Ltd | 22.331 | 482,90 | 36 | 600,00 | ||||
| 2026-01-30 | 13F | R Squared Ltd | 32.755 | 13,78 | 52 | 20,93 | ||||
| 2026-02-13 | 13F | State Street Corp | 1.649.847 | 7,06 | 2.768 | 13,49 | ||||
| 2026-02-17 | 13F | Royal Bank Of Canada | 39 | 0,00 | 0 | |||||
| 2026-02-12 | 13F | Advisors Asset Management, Inc. | 116.350 | -8,33 | 186 | -2,11 | ||||
| 2025-11-06 | 13F | Johnson Investment Counsel Inc | 0 | -100,00 | 0 | -100,00 | ||||
| 2026-02-17 | 13F | Guggenheim Capital Llc | 59.804 | -7,36 | 96 | -1,04 | ||||
| 2026-02-17 | 13F | Voleon Capital Management Lp | 33.648 | 54 | ||||||
| 2026-02-17 | 13F | Bank Of America Corp /de/ | 743.469 | 11,87 | 1.190 | 19,38 | ||||
| 2025-11-06 | 13F | Ameritas Advisory Services, LLC | 0 | -100,00 | 0 | |||||
| 2026-02-13 | 13F | Rhumbline Advisers | 795 | -86,05 | 1 | -87,50 | ||||
| 2026-04-20 | 13F | Jfs Wealth Advisors, Llc | 1.716 | 0,00 | 2 | 0,00 | ||||
| 2026-04-06 | 13F | GAMMA Investing LLC | 2.938 | -21,09 | 4 | -40,00 | ||||
| 2026-02-12 | 13F | Hrt Financial Lp | 564.262 | 175,35 | 1 | |||||
| 2026-02-13 | 13F | JustInvest LLC | 29.550 | 14,23 | 47 | 23,68 | ||||
| 2025-11-10 | 13F | MAI Capital Management | 0 | -100,00 | 0 | |||||
| 2026-02-17 | 13F | Two Sigma Advisers, Lp | 493.300 | 789 | ||||||
| 2026-02-12 | 13F | Barometer Capital Management Inc. | 14.900 | -95,01 | 585 | 30,87 | ||||
| 2026-04-07 | 13F | Signaturefd, Llc | 436 | -76,62 | 1 | -100,00 |