Grundlæggende statistik
| Institutionelle aktier (lange) | 26.889.318 - 64,57% (ex 13D/G) |
| Institutionel værdi (lang) | $ 465.154 USD ($1000) |
Institutionelt ejerskab og aktionærer
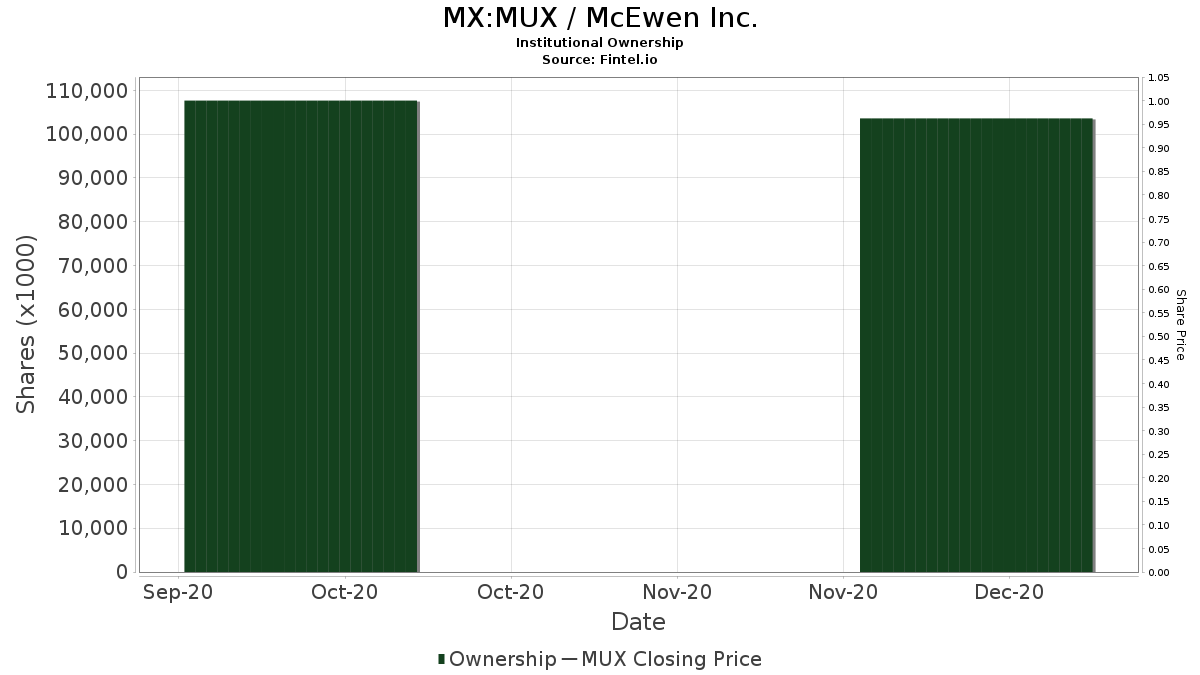
McEwen Inc. (MX:MUX) har 140 institutionelle ejere og aktionærer, der har indsendt 13D/G- eller 13F-formularer til Securities Exchange Commission (SEC). Disse institutioner har i alt 26,889,318 aktier. Største aktionærer omfatter MIRAE ASSET GLOBAL ETFS HOLDINGS Ltd., State Street Corp, BlackRock, Inc., Van Eck Associates Corp, Toroso Investments, LLC, UBS Group AG, Dimensional Fund Advisors Lp, Bnp Paribas Arbitrage, Sa, Morgan Stanley, and Vanguard Group Inc .
McEwen Inc. (BMV:MUX) institutionel ejerskabsstruktur viser aktuelle positioner i virksomheden efter institutioner og fonde, samt seneste ændringer i positionsstørrelse. Større aktionærer kan omfatte individuelle investorer, investeringsforeninger, hedgefonde eller institutioner. Skema 13D angiver, at investoren besidder (eller besidder) mere end 5 % af virksomheden og har til hensigt (eller har til hensigt at) aktivt at forfølge en ændring i forretningsstrategi. Skema 13G indikerer en passiv investering på over 5%.
Fondens stemningsscore
Fund Sentiment Score (fka Ownership Accumulation Score) finder de aktier, der bliver mest købt af fonde. Det er resultatet af en sofistikeret, multi-faktor kvantitativ model, der identificerer virksomheder med de højeste niveauer af institutionel akkumulering. Scoringsmodellen bruger en kombination af den samlede stigning i oplyste ejere, ændringerne i porteføljeallokeringer i disse ejere og andre målinger. Tallet går fra 0 til 100, hvor højere tal indikerer et højere niveau af akkumulering for sine jævnaldrende, og 50 er gennemsnittet.
Opdateringsfrekvens: Dagligt
Se Ownership Explorer, som giver en liste over højest rangerende virksomheder.
AI+ Ask Fintel’s AI assistant about McEwen Inc..
Select a question to share a public post with an AI-crafted answer.
Thinking of good questions…
13F og NPORT arkivering
Detaljer om 13F-arkivering er gratis. Detaljer om NP-ansøgninger kræver et premium-medlemskab. Grønne rækker angiver nye positioner. Røde rækker angiver lukkede positioner. Klik på linket ikon for at se den fulde transaktionshistorik.
Opgrader
for at låse premium-data op og eksportere til Excel ![]() .
.
| Fil dato | Kilde | Investor | Type | Gennemsnitlig pris (Øst) |
Aktier | Δ Aktier (%) |
Rapporteret Værdi ($1000) |
Δ Værdi (%) |
Port Alloc (%) |
|
|---|---|---|---|---|---|---|---|---|---|---|
| 2026-02-10 | 13F | Quantbot Technologies LP | 132.168 | 0,29 | 2.446 | 8,57 | ||||
| 2026-02-17 | 13F | Fmr Llc | 589.977 | 16.509,71 | 10.920 | 18.100,00 | ||||
| 2026-02-17 | 13F | Qube Research & Technologies Ltd | 28.517 | 528 | ||||||
| 2026-02-13 | 13F | Squarepoint Ops LLC | 30.378 | -30,36 | 562 | -24,56 | ||||
| 2026-02-13 | 13F | Barclays Plc | 144.482 | 2.674 | ||||||
| 2026-02-17 | 13F | Bank Of America Corp /de/ | 36.942 | -17,47 | 684 | -10,72 | ||||
| 2026-01-22 | 13F | Bartlett & Co. Wealth Management Llc | 53 | 1 | ||||||
| 2026-01-13 | 13F | Synergy Financial Management, LLC | 731.860 | 13.547 | ||||||
| 2026-04-14 | 13F | Perpetual Ltd | 17.748 | -15,89 | 362 | -7,18 | ||||
| 2026-02-12 | 13F | Wealthspire Advisors, LLC | 0 | -100,00 | 0 | |||||
| 2026-02-17 | 13F | Jump Financial, LLC | 0 | -100,00 | 0 | |||||
| 2026-04-07 | 13F | CoreCap Advisors, LLC | 694 | -52,34 | 14 | -46,15 | ||||
| 2026-01-29 | 13F | Beirne Wealth Consulting Services, LLC | 20.000 | 0,00 | 370 | 8,19 | ||||
| 2026-02-17 | 13F | Nomura Holdings Inc | 487.457 | -13,04 | 9.023 | -5,87 | ||||
| 2026-02-12 | 13F | Bank Of Montreal /can/ | Put | 0 | -100,00 | 0 | -100,00 | |||
| 2026-02-17 | 13F | Cetera Investment Advisers | 63.006 | 1.166 | ||||||
| 2026-02-12 | 13F | Sprott Inc. | 12.309 | 22,16 | 228 | 31,98 | ||||
| 2026-02-17 | 13F | Advisor Group Holdings, Inc. | 13.611 | 61,17 | 252 | 83,21 | ||||
| 2026-02-13 | 13F | Toroso Investments, LLC | Call | 74.300 | 141,23 | 1.375 | 161,41 | |||
| 2026-02-17 | 13F | Northern Trust Corp | 154.694 | 48,01 | 2.863 | 60,21 | ||||
| 2026-02-13 | 13F | Toroso Investments, LLC | 1.473.906 | 62,83 | 27.282 | 76,26 | ||||
| 2026-02-10 | 13F | Semanteon Capital Management, LP | 0 | -100,00 | 0 | |||||
| 2026-02-02 | 13F | Wolverine Asset Management Llc | Put | 49.700 | -85,45 | 920 | -84,27 | |||
| 2026-02-12 | 13F | Quadrant Capital Group Llc | 1.723 | 7,75 | 32 | 14,81 | ||||
| 2025-10-27 | 13F | Kiker Wealth Management, LLC | 0 | -100,00 | 0 | |||||
| 2026-02-03 | 13F | SBI Securities Co., Ltd. | 444 | -5,53 | 8 | 0,00 | ||||
| 2026-02-11 | 13F | Parallel Advisors, LLC | 291 | 470,59 | 5 | |||||
| 2025-11-14 | 13F | Balyasny Asset Management Llc | 0 | -100,00 | 0 | |||||
| 2025-11-13 | 13F | Entropy Technologies, LP | 0 | -100,00 | 0 | |||||
| 2026-02-17 | 13F | Bridgeway Capital Management Inc | 429.498 | 2,41 | 7.950 | 10,86 | ||||
| 2026-02-17 | 13F | Schonfeld Strategic Advisors LLC | 22.881 | 424 | ||||||
| 2026-02-17 | 13F | Point72 Asset Management, L.P. | Put | 182.100 | 3.371 | |||||
| 2026-02-13 | 13F | Public Employees Retirement Association Of Colorado | 4.961 | 0,00 | 0 | |||||
| 2026-02-17 | 13F | Point72 Asset Management, L.P. | Call | 301.800 | 5.586 | |||||
| 2026-02-13 | 13F | BNP Paribas Asset Management Holding S.A. | 447 | 0 | ||||||
| 2026-02-17 | 13F | Condire Management, LP | 113.000 | 0,00 | 2.092 | 8,23 | ||||
| 2026-02-13 | 13F | Walleye Capital LLC | 17.024 | 315 | ||||||
| 2026-02-12 | 13F | Hollencrest Capital Management | 34.243 | 0,00 | 634 | 8,21 | ||||
| 2025-11-14 | 13F | Algert Global Llc | 0 | -100,00 | 0 | |||||
| 2026-02-17 | 13F | ExodusPoint Capital Management, LP | 0 | -100,00 | 0 | -100,00 | ||||
| 2026-02-17 | 13F | Royal Bank Of Canada | 574.426 | 173,51 | 10.633 | 196,02 | ||||
| 2026-02-10 | 13F | Mawer Investment Management Ltd. | 249.981 | 4.627 | ||||||
| 2026-02-13 | 13F | Marshall Wace, Llp | 78.832 | 1.459 | ||||||
| 2026-02-13 | 13F | Parkside Financial Bank & Trust | 2.000 | 37 | ||||||
| 2026-01-29 | 13F | Vanguard Group Inc | 927.503 | 4,88 | 17.168 | 13,53 | ||||
| 2026-04-07 | 13F | Signaturefd, Llc | 156 | 3,31 | 3 | 50,00 | ||||
| 2026-01-29 | 13F | Kercheville Advisors, LLC | 10.000 | 261 | ||||||
| 2026-02-06 | 13F | Banque Cantonale Vaudoise | 2.170 | 40 | ||||||
| 2026-02-13 | 13F | Verition Fund Management LLC | 54.800 | -5,93 | 1.014 | 1,81 | ||||
| 2026-02-12 | 13F | Barometer Capital Management Inc. | 18.800 | -24,80 | 1.293 | 116,95 | ||||
| 2026-02-17 | 13F | Private Advisor Group, LLC | 0 | -100,00 | 0 | |||||
| 2026-02-18 | 13F/A | Empowered Funds, LLC | 259.498 | 4,05 | 4.803 | 12,64 | ||||
| 2025-10-29 | 13F | Formidable Asset Management, LLC | 0 | -100,00 | 0 | -100,00 | ||||
| 2026-02-17 | 13F | Toronto Dominion Bank | 20.000 | 0,00 | 371 | 11,08 | ||||
| 2026-02-17 | 13F | Amundi | 769.288 | 14.240 | ||||||
| 2026-02-12 | 13F | North of South Capital LLP | 50.000 | 0,00 | 926 | 8,19 | ||||
| 2026-04-15 | 13F | Bayforest Capital Ltd | 1.435 | 29 | ||||||
| 2026-02-17 | 13F | Point72 Asset Management, L.P. | 0 | -100,00 | 0 | |||||
| 2026-01-22 | 13F | Brookwood Investment Group LLC | 30.215 | 559 | ||||||
| 2026-02-09 | 13F/A | Fideuram - Intesa Sanpaolo Private Banking S.p.a. | 18.400 | 341 | ||||||
| 2026-02-12 | 13F | Jane Street Group, Llc | 187.958 | -26,07 | 3.479 | -19,97 | ||||
| 2026-02-12 | 13F | Jane Street Group, Llc | Put | 106.900 | 12,88 | 1.979 | 22,17 | |||
| 2026-02-12 | 13F | Jane Street Group, Llc | Call | 116.700 | 20,93 | 2.160 | 30,91 | |||
| 2026-02-12 | 13F | Swiss National Bank | 92.100 | 1.705 | ||||||
| 2026-02-17 | 13F | PharVision Advisers, LLC | 14.999 | 278 | ||||||
| 2026-02-23 | 13F | Virtu Financial LLC | 0 | -100,00 | 0 | |||||
| 2026-02-17 | 13F | Tudor Investment Corp Et Al | Put | 26.200 | 485 | |||||
| 2026-02-13 | 13F | American Century Companies Inc | 126.461 | 1,70 | 2.341 | 10,07 | ||||
| 2026-02-17 | 13F | Tudor Investment Corp Et Al | 319.982 | -0,77 | 5.923 | 7,42 | ||||
| 2026-02-17 | 13F | Tudor Investment Corp Et Al | Call | 63.900 | 13,70 | 1.183 | 23,00 | |||
| 2026-01-29 | 13F | IMC-Chicago, LLC | 0 | -100,00 | 0 | -100,00 | ||||
| 2026-02-19 | 13F | Invesco Ltd. | 0 | -100,00 | 0 | |||||
| 2026-02-17 | 13F | Price T Rowe Associates Inc /md/ | 17.615 | 0,00 | 0 | |||||
| 2026-02-11 | 13F | Jpmorgan Chase & Co | 444.675 | -32,53 | 8.231 | -26,97 | ||||
| 2025-11-14 | 13F | Raymond James Financial Inc | 0 | -100,00 | 0 | |||||
| 2026-02-17 | 13F | D. E. Shaw & Co., Inc. | Call | 240.600 | 328,11 | 4.454 | 363,37 | |||
| 2026-02-17 | 13F | D. E. Shaw & Co., Inc. | 364.153 | -40,19 | 6.740 | -35,26 | ||||
| 2026-02-17 | 13F | Two Sigma Investments, Lp | 721.442 | 91,74 | 13.354 | 107,54 | ||||
| 2026-02-17 | 13F/A | Sentinus, LLC | 89.470 | 1.656 | ||||||
| 2026-02-12 | 13F | CoreCommodity Management, LLC | 39.671 | -17,09 | 734 | -10,27 | ||||
| 2026-02-12 | 13F | Alps Advisors Inc | 0 | -100,00 | 0 | |||||
| 2026-04-10 | 13F | Armstrong Advisory Group, Inc | 500 | 0,00 | 10 | 11,11 | ||||
| 2026-02-03 | 13F | International Assets Investment Management, Llc | 500 | 9 | ||||||
| 2026-02-02 | 13F | Oppenheimer & Co Inc | 15.117 | 280 | ||||||
| 2026-01-27 | 13F | Zurcher Kantonalbank (Zurich Cantonalbank) | 24.837 | 460 | ||||||
| 2026-02-13 | 13F | Marathon Trading Investment Management LLC | 190.300 | 3.522 | ||||||
| 2026-01-28 | 13F | Universal- Beteiligungs- und Servicegesellschaft mbH | 35.000 | 0,00 | 658 | 9,87 | ||||
| 2026-02-11 | 13F | Group One Trading, L.p. | 0 | -100,00 | 0 | |||||
| 2026-02-13 | 13F | SRS Capital Advisors, Inc. | 6 | 0,00 | 0 | |||||
| 2026-02-12 | 13F | Bank Of Montreal /can/ | 68.984 | 35,92 | 1.277 | 47,17 | ||||
| 2026-02-17 | 13F | Voloridge Investment Management, Llc | 701.344 | 228,62 | 12.982 | 255,74 | ||||
| 2026-02-11 | 13F | Deutsche Bank Ag\ | 409 | 8 | ||||||
| 2026-02-12 | 13F | BlackRock, Inc. | 1.836.775 | 79,68 | 33.999 | 94,50 | ||||
| 2025-11-10 | 13F | Everstar Asset Management, LLC | 0 | -100,00 | 0 | -100,00 | ||||
| 2026-01-20 | 13F | AdvisorNet Financial, Inc | 0 | -100,00 | 0 | |||||
| 2026-02-13 | 13F | Wells Fargo & Company/mn | 4.105 | 330,75 | 76 | 368,75 | ||||
| 2026-02-13 | 13F | Y-Intercept (Hong Kong) Ltd | 30.072 | -71,45 | 557 | -69,13 | ||||
| 2026-02-12 | 13F | Dimensional Fund Advisors Lp | 1.097.073 | -14,66 | 20.308 | -7,61 | ||||
| 2026-01-30 | 13F | North Star Investment Management Corp. | 1.100 | 0,00 | 20 | 11,11 | ||||
| 2026-02-13 | 13F | Winmill & Co. Inc | 47.500 | 879 | ||||||
| 2026-02-13 | 13F | Arrowstreet Capital, Limited Partnership | 0 | -100,00 | 0 | |||||
| 2026-01-30 | 13F | Archer Investment Corp | 10 | 0,00 | 0 | |||||
| 2026-02-06 | 13F | Gsa Capital Partners Llp | 0 | -100,00 | 0 | |||||
| 2025-11-21 | 13F | Nebula Research & Development LLC | 0 | -100,00 | 0 | |||||
| 2026-02-05 | 13F | Allworth Financial LP | 141 | -99,10 | 3 | -99,25 | ||||
| 2026-02-17 | 13F | Tower Research Capital LLC (TRC) | 4.697 | 4.597,00 | 87 | 8.500,00 | ||||
| 2026-02-13 | 13F | Quarry LP | 1.013 | 19 | ||||||
| 2026-01-27 | 13F | BankPlus Trust Department | 158 | 0,00 | 3 | 0,00 | ||||
| 2026-02-17 | 13F | Man Group plc | 0 | -100,00 | 0 | |||||
| 2025-11-14 | 13F | Cubist Systematic Strategies, LLC | 6.128 | 75,04 | 105 | 215,15 | ||||
| 2025-11-12 | 13F/A | Norges Bank | 54.100 | -50,95 | 503 | -50,30 | ||||
| 2026-02-13 | 13F | Pale Fire Capital SE | 0 | -100,00 | 0 | |||||
| 2026-04-06 | 13F | GAMMA Investing LLC | 283 | -38,48 | 6 | -37,50 | ||||
| 2026-02-13 | 13F | Charles Schwab Investment Management Inc | 271.779 | 3,04 | 5.031 | 11,53 | ||||
| 2026-02-13 | 13F | Citigroup Inc | 4.751 | -70,12 | 88 | -67,90 | ||||
| 2026-02-17 | 13F | Citadel Advisors Llc | Call | 217.200 | -11,24 | 4.020 | -3,92 | |||
| 2026-02-17 | 13F | Citadel Advisors Llc | 134.823 | -82,99 | 2.496 | -81,59 | ||||
| 2026-02-17 | 13F | Caption Management, LLC | 0 | -100,00 | 0 | |||||
| 2026-02-17 | 13F | Caption Management, LLC | Call | 125.000 | 400,00 | 2.314 | 441,69 | |||
| 2026-02-17 | 13F | Citadel Advisors Llc | Put | 503.600 | 22,71 | 9.322 | 32,83 | |||
| 2026-02-17 | 13F | Caption Management, LLC | Put | 0 | -100,00 | 0 | ||||
| 2026-04-10 | 13F | Country Trust Bank | 67 | 0,00 | 1 | 0,00 | ||||
| 2026-02-17 | 13F | Millennium Management Llc | Call | 30.000 | -1,96 | 555 | 6,12 | |||
| 2026-02-13 | 13F | Towarzystwo Funduszy Inwestycyjnych Pzu Sa | 5.000 | 93 | ||||||
| 2026-02-17 | 13F | Millennium Management Llc | 42.010 | -89,77 | 779 | -88,91 | ||||
| 2026-02-13 | 13F | Ubs Asset Management Americas Inc | 49.700 | 920 | ||||||
| 2026-02-17 | 13F | California State Teachers Retirement System | 41.780 | 773 | ||||||
| 2026-04-07 | 13F | Farther Finance Advisors, LLC | 64 | -72,65 | 1 | -75,00 | ||||
| 2026-02-11 | 13F | Simplex Trading, Llc | 95.689 | 1.771 | ||||||
| 2026-02-13 | 13F | Kestra Advisory Services, LLC | 0 | -100,00 | 0 | |||||
| 2025-11-14 | 13F | XTX Topco Ltd | 0 | -100,00 | 0 | -100,00 | ||||
| 2025-11-04 | 13F | Guerra Advisors Inc | 40 | 1 | ||||||
| 2026-02-17 | 13F | Susquehanna International Group, Llp | 90.684 | -64,32 | 1.679 | -61,38 | ||||
| 2026-02-17 | 13F | Susquehanna International Group, Llp | Put | 229.500 | 40,88 | 4.248 | 52,53 | |||
| 2026-02-12 | 13F | Campbell & CO Investment Adviser LLC | 38.501 | -22,57 | 713 | -16,24 | ||||
| 2026-02-17 | 13F | Occudo Quantitative Strategies Lp | 67.558 | 307,54 | 1.250 | 341,70 | ||||
| 2026-02-10 | 13F | Bank of New York Mellon Corp | 10.191 | 189 | ||||||
| 2026-02-17 | 13F | Brevan Howard Capital Management LP | 26.970 | 499 | ||||||
| 2026-02-09 | 13F | Quest Partners LLC | 14.470 | -49,55 | 268 | -45,51 | ||||
| 2026-02-13 | 13F | OMERS ADMINISTRATION Corp | 0 | -100,00 | 0 | |||||
| 2026-01-16 | 13F | FNY Investment Advisers, LLC | 22.399 | 0 | ||||||
| 2026-01-16 | 13F | FNY Investment Advisers, LLC | Call | 275 | 0 | |||||
| 2025-11-13 | 13F | Renaissance Technologies Llc | 0 | -100,00 | 0 | |||||
| 2026-02-13 | 13F | Van Eck Associates Corp | 1.597.060 | -3,58 | 30 | 3,57 | ||||
| 2026-02-17 | 13F | Jain Global LLC | 0 | -100,00 | 0 | |||||
| 2026-04-08 | 13F | Ausbil Investment Management Ltd | 28.000 | 0,00 | 599 | 15,64 | ||||
| 2026-02-10 | 13F | Oppenheimer & Close, LLC | 10.925 | -2,04 | 202 | 6,32 | ||||
| 2026-02-17 | 13F | Prelude Capital Management, Llc | 0 | -100,00 | 0 | |||||
| 2026-02-17 | 13F | Susquehanna International Group, Llp | Call | 731.000 | 154,62 | 13.531 | 175,62 | |||
| 2026-02-17 | 13F | MIRAE ASSET GLOBAL ETFS HOLDINGS Ltd. | 2.203.474 | 12,43 | 40.786 | 21,70 | ||||
| 2026-02-13 | 13F | Sculptor Capital LP | Put | 246.000 | 4.553 | |||||
| 2026-02-11 | 13F | LPL Financial LLC | 189.651 | -5,69 | 3.510 | 2,09 | ||||
| 2026-02-13 | 13F | Sculptor Capital LP | 246.000 | 4.553 | ||||||
| 2026-02-10 | 13F | Goldman Sachs Group Inc | 140.263 | -22,82 | 2.596 | -16,45 | ||||
| 2025-11-14 | 13F | Peak6 Llc | 0 | -100,00 | 0 | -100,00 | ||||
| 2026-02-13 | 13F | MAI Capital Management | 36 | 0,00 | 1 | |||||
| 2026-01-27 | 13F | TD Waterhouse Canada Inc. | 0 | -100,00 | 0 | |||||
| 2026-02-12 | 13F | Hrt Financial Lp | 107.503 | -82,70 | 2 | -90,00 | ||||
| 2026-02-05 | 13F | Cambridge Investment Research Advisors, Inc. | 26.558 | -4,19 | 0 | |||||
| 2026-02-09 | 13F | Geode Capital Management, Llc | 522.435 | 0,28 | 9.673 | 8,54 | ||||
| 2026-02-17 | 13F | Captrust Financial Advisors | 33.985 | -0,02 | 629 | 8,26 | ||||
| 2025-11-10 | 13F | Optiver Holding B.V. | 0 | -100,00 | 0 | |||||
| 2026-02-10 | 13F | Bnp Paribas Arbitrage, Sa | 1.001.596 | 56,32 | 18.540 | 69,21 | ||||
| 2025-11-14 | 13F | Wolverine Trading, Llc | 121.729 | 657,40 | 2.028 | 1.252,00 | ||||
| 2025-11-12 | 13F | Catalyst Funds Management Pty Ltd | 0 | -100,00 | 0 | |||||
| 2025-11-14 | 13F | Wolverine Trading, Llc | Call | 120.700 | 340,51 | 2.011 | 685,16 | |||
| 2025-11-14 | 13F | Wolverine Trading, Llc | Put | 46.200 | 32,00 | 770 | 135,17 | |||
| 2026-02-17 | 13F | Aquatic Capital Management LLC | 0 | -100,00 | 0 | |||||
| 2026-02-11 | 13F | Los Angeles Capital Management Llc | 14 | 0 | ||||||
| 2026-02-09 | 13F | Legal & General Group Plc | 32.147 | 595 | ||||||
| 2026-01-28 | 13F | Arizona State Retirement System | 12.867 | 238 | ||||||
| 2026-03-12 | 13F/A | Peak6 Llc | Call | 358.500 | -66,19 | 6.636 | -63,41 | |||
| 2026-03-12 | 13F/A | Peak6 Llc | Put | 10.200 | 0,00 | 189 | 8,05 | |||
| 2026-01-28 | 13F | U S Global Investors Inc | 100.000 | 1.857 | ||||||
| 2026-02-06 | 13F | Global Retirement Partners, LLC | 250 | -28,57 | 5 | -20,00 | ||||
| 2026-02-10 | 13F | Bnp Paribas | 650 | 0,00 | 12 | 9,09 | ||||
| 2026-01-23 | 13F | Nbt Bank N A /ny | 100 | 0,00 | 2 | 0,00 | ||||
| 2026-01-29 | 13F | Cornerstone Investment Partners, LLC | 14.912 | 0,06 | 276 | 8,66 | ||||
| 2026-02-17 | 13F | Janus Henderson Group Plc | 21.500 | 398 | ||||||
| 2025-11-12 | 13F | HAP Trading, LLC | 104.976 | 1.795 | ||||||
| 2026-01-29 | 13F | UBS Group AG | Put | 20.200 | 374 | |||||
| 2026-01-29 | 13F | UBS Group AG | Call | 239.500 | 0,00 | 4.433 | 8,25 | |||
| 2026-01-28 | 13F | Klp Kapitalforvaltning As | 14.700 | 272 | ||||||
| 2026-01-29 | 13F | UBS Group AG | 1.387.936 | 33,75 | 25.691 | 44,78 | ||||
| 2026-02-12 | 13F | Federation des caisses Desjardins du Quebec | 6.334 | -82,65 | 116 | -81,32 | ||||
| 2026-02-13 | 13F | National Bank Of Canada /fi/ | 11.389 | 213,40 | 271 | 241,77 | ||||
| 2026-02-17 | 13F | SageView Advisory Group, LLC | 354 | 7 | ||||||
| 2026-02-17 | 13F | Perritt Capital Management Inc | 89.470 | 0,00 | 1.656 | 8,31 | ||||
| 2026-02-17 | 13F | Two Sigma Advisers, Lp | 245.163 | 401,33 | 4.538 | 442,70 | ||||
| 2026-02-17 | 13F | Keebeck Alpha, LP | 0 | -100,00 | 0 | |||||
| 2025-11-13 | 13F | Connor, Clark & Lunn Investment Management Ltd. | 0 | -100,00 | 0 | |||||
| 2025-11-13 | 13F | Winton Capital Group Ltd | 0 | -100,00 | 0 | |||||
| 2026-02-13 | 13F | State Street Corp | 2.190.605 | 24,41 | 40.548 | 34,67 | ||||
| 2026-02-17 | 13F | Sig Brokerage, Lp | 44.956 | 832 | ||||||
| 2025-11-13 | 13F | Inceptionr Llc | 0 | -100,00 | 0 | -100,00 | ||||
| 2026-02-17 | 13F | State Of Wisconsin Investment Board | 29.879 | 553 | ||||||
| 2026-03-03 | 13F/A | Caitong International Asset Management Co., Ltd | 251 | 5 | ||||||
| 2025-11-13 | 13F | Total Investment Management Inc | 0 | -100,00 | 0 | |||||
| 2026-02-17 | 13F | PDT Partners, LLC | 287.875 | 0,00 | 5.329 | 8,25 | ||||
| 2026-02-13 | 13F | Morgan Stanley | 978.533 | -4,51 | 18.113 | 3,36 | ||||
| 2026-02-10 | 13F/A | Northwestern Mutual Wealth Management Co | 258 | 5 | ||||||
| 2026-02-05 | 13F | Bank Julius Baer & Co. Ltd, Zurich | 12 | 9,09 | 0 |