Grundlæggende statistik
| Institutionelle ejere | 66 total, 63 long only, 0 short only, 3 long/short - change of 22,47% MRQ |
| Gennemsnitlig porteføljeallokering | 0.4501 % - change of 58,87% MRQ |
| Institutionelle aktier (lange) | 19.886.471 (ex 13D/G) - change of 14,55MM shares 20,81% MRQ |
| Institutionel værdi (lang) | $ 43.474 USD ($1000) |
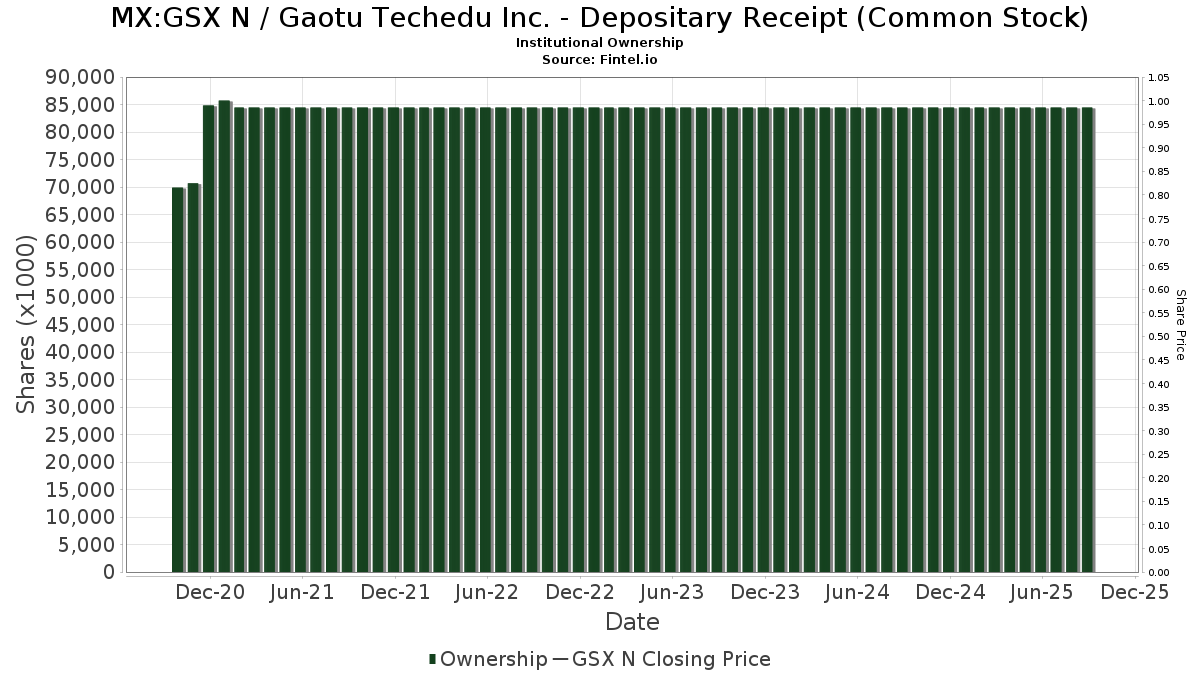
Institutionelt ejerskab og aktionærer
Gaotu Techedu Inc. - Depositary Receipt (Common Stock) (MX:GSX N) har 66 institutionelle ejere og aktionærer, der har indsendt 13D/G- eller 13F-formularer til Securities Exchange Commission (SEC). Disse institutioner har i alt 19,886,471 aktier. Største aktionærer omfatter Vanguard Group Inc, Renaissance Technologies Llc, VGTSX - Vanguard Total International Stock Index Fund Investor Shares, VEIEX - Vanguard Emerging Markets Stock Index Fund Investor Shares, Morgan Stanley, Acadian Asset Management Llc, Goldman Sachs Group Inc, Citadel Advisors Llc, D. E. Shaw & Co., Inc., and BlackRock, Inc. .
Gaotu Techedu Inc. - Depositary Receipt (Common Stock) (BMV:GSX N) institutionel ejerskabsstruktur viser aktuelle positioner i virksomheden efter institutioner og fonde, samt seneste ændringer i positionsstørrelse. Større aktionærer kan omfatte individuelle investorer, investeringsforeninger, hedgefonde eller institutioner. Skema 13D angiver, at investoren besidder (eller besidder) mere end 5 % af virksomheden og har til hensigt (eller har til hensigt at) aktivt at forfølge en ændring i forretningsstrategi. Skema 13G indikerer en passiv investering på over 5%.
Fondens stemningsscore
Fund Sentiment Score (fka Ownership Accumulation Score) finder de aktier, der bliver mest købt af fonde. Det er resultatet af en sofistikeret, multi-faktor kvantitativ model, der identificerer virksomheder med de højeste niveauer af institutionel akkumulering. Scoringsmodellen bruger en kombination af den samlede stigning i oplyste ejere, ændringerne i porteføljeallokeringer i disse ejere og andre målinger. Tallet går fra 0 til 100, hvor højere tal indikerer et højere niveau af akkumulering for sine jævnaldrende, og 50 er gennemsnittet.
Opdateringsfrekvens: Dagligt
Se Ownership Explorer, som giver en liste over højest rangerende virksomheder.
AI+ Ask Fintel’s AI assistant about Gaotu Techedu Inc. - Depositary Receipt (Common Stock).
Select a question to share a public post with an AI-crafted answer.
Thinking of good questions…
13F og NPORT arkivering
Detaljer om 13F-arkivering er gratis. Detaljer om NP-ansøgninger kræver et premium-medlemskab. Grønne rækker angiver nye positioner. Røde rækker angiver lukkede positioner. Klik på linket ikon for at se den fulde transaktionshistorik.
Opgrader
for at låse premium-data op og eksportere til Excel ![]() .
.
| Fil dato | Kilde | Investor | Type | Gennemsnitlig pris (Øst) |
Aktier | Δ Aktier (%) |
Rapporteret Værdi ($1000) |
Δ Værdi (%) |
Port Alloc (%) |
|
|---|---|---|---|---|---|---|---|---|---|---|
| 2025-11-07 | 13F | Pnc Financial Services Group, Inc. | 0 | -100,00 | 0 | |||||
| 2026-02-17 | 13F | Numerai GP LLC | 0 | -100,00 | 0 | |||||
| 2026-02-12 | 13F | Jane Street Group, Llc | 160.411 | -48,93 | 373 | -63,54 | ||||
| 2025-09-25 | NP | VT - Vanguard Total World Stock Index Fund ETF Shares | 78.650 | 0,00 | 277 | 13,11 | ||||
| 2026-02-12 | 13F | Jane Street Group, Llc | Put | 21.600 | 50 | |||||
| 2026-02-12 | 13F | Jane Street Group, Llc | Call | 22.700 | 62,14 | 53 | 15,56 | |||
| 2026-02-17 | 13F | Royal Bank Of Canada | 2.181 | 149,54 | 5 | 66,67 | ||||
| 2026-02-11 | 13F | Group One Trading, L.p. | 93.683 | -39,00 | 217 | -56,60 | ||||
| 2025-09-26 | NP | PGJ - Invesco Golden Dragon China ETF This fund is a listed as child fund of Invesco Ltd. and if that institution has disclosed ownership in this security, then these positions will not be double counted when calculating total shares and total value | 117.247 | -7,01 | 413 | 5,10 | ||||
| 2025-11-13 | 13F | Norges Bank | 0 | -100,00 | 0 | |||||
| 2026-02-17 | 13F | Russell Investments Group, Ltd. | 0 | -100,00 | 0 | |||||
| 2026-02-23 | 13F | Virtu Financial LLC | 11.588 | -50,37 | 0 | |||||
| 2026-02-13 | 13F | National Bank Of Canada /fi/ | 0 | -100,00 | 0 | |||||
| 2025-11-14 | 13F | Two Sigma Investments, Lp | 0 | -100,00 | 0 | |||||
| 2026-02-11 | 13F | Harvest Fund Management Co., Ltd | 0 | -100,00 | 0 | |||||
| 2025-09-25 | NP | VFSNX - Vanguard FTSE All-World ex-US Small-Cap Index Fund Institutional Shares | 404.447 | -10,18 | 1.424 | 1,64 | ||||
| 2026-02-17 | 13F | Jump Financial, LLC | 146.850 | -27,95 | 341 | -48,80 | ||||
| 2026-02-12 | 13F | Federation des caisses Desjardins du Quebec | 45.027 | 104 | ||||||
| 2025-11-14 | 13F | Walleye Capital LLC | Put | 0 | -100,00 | 0 | -100,00 | |||
| 2025-11-13 | 13F | Pinpoint Asset Management (Singapore) Pte. Ltd. | 0 | -100,00 | 0 | -100,00 | ||||
| 2026-01-29 | 13F | Vanguard Group Inc | 5.192.148 | 0,00 | 12.046 | -28,84 | ||||
| 2025-11-14 | 13F | Point72 Asia (Singapore) Pte. Ltd. | 0 | -100,00 | 0 | |||||
| 2025-11-14 | 13F | Cubist Systematic Strategies, LLC | 208.133 | -49,37 | 679 | -54,28 | ||||
| 2026-02-13 | 13F | Healthcare Of Ontario Pension Plan Trust Fund | 242.500 | -24,29 | 563 | -46,17 | ||||
| 2026-02-13 | 13F | Citigroup Inc | 432.486 | 9,34 | 1.003 | -22,19 | ||||
| 2026-02-17 | 13F | Ameriprise Financial Inc | 0 | -100,00 | 0 | |||||
| 2026-02-17 | 13F | D. E. Shaw & Co., Inc. | 821.154 | 45,43 | 1.905 | 3,53 | ||||
| 2026-02-17 | 13F | Citadel Advisors Llc | Put | 126.400 | 2,76 | 293 | -26,75 | |||
| 2026-02-17 | 13F | Citadel Advisors Llc | 868.095 | 172,08 | 2.014 | 93,56 | ||||
| 2026-03-06 | 13F | Hsbc Holdings Plc | 126.457 | 293 | ||||||
| 2025-09-25 | NP | VGTSX - Vanguard Total International Stock Index Fund Investor Shares | 1.806.165 | -7,69 | 6.358 | 4,49 | ||||
| 2026-02-13 | 13F | Verition Fund Management LLC | 0 | -100,00 | 0 | |||||
| 2026-02-13 | 13F | OMERS ADMINISTRATION Corp | 0 | -100,00 | 0 | |||||
| 2026-02-13 | 13F | State Street Corp | 418.306 | 6,38 | 970 | -24,28 | ||||
| 2026-02-13 | 13F | Caitong International Asset Management Co., Ltd | 0 | -100,00 | 0 | |||||
| 2026-02-17 | 13F | Advisor Group Holdings, Inc. | 100 | 0,00 | 0 | |||||
| 2026-02-13 | 13F | Arrowstreet Capital, Limited Partnership | 472.907 | -69,18 | 1.097 | -78,06 | ||||
| 2025-10-23 | 13F | SG Americas Securities, LLC | 0 | -100,00 | 0 | |||||
| 2026-02-13 | 13F | Walleye Trading LLC | Put | 0 | -100,00 | 0 | ||||
| 2026-01-29 | 13F | UBS Group AG | 417.423 | -60,23 | 968 | -71,70 | ||||
| 2026-02-13 | 13F | Walleye Trading LLC | Call | 0 | -100,00 | 0 | ||||
| 2026-02-13 | 13F | Walleye Trading LLC | 0 | -100,00 | 0 | |||||
| 2026-02-10 | 13F | Goldman Sachs Group Inc | 914.816 | -8,82 | 2.122 | -35,11 | ||||
| 2026-02-17 | 13F | Two Sigma Advisers, Lp | 302.600 | 10,80 | 702 | -21,12 | ||||
| 2026-02-19 | 13F | Invesco Ltd. | 111.611 | -4,14 | 259 | -31,93 | ||||
| 2026-02-12 | 13F | California Public Employees Retirement System | 158.624 | -0,29 | 368 | -28,96 | ||||
| 2026-02-10 | 13F | Connor, Clark & Lunn Investment Management Ltd. | 538.715 | -6,94 | 1.250 | -33,81 | ||||
| 2026-02-17 | 13F | Tudor Investment Corp Et Al | Call | 115.300 | 267 | |||||
| 2026-02-17 | 13F | Bank Of America Corp /de/ | 4 | -100,00 | 0 | -100,00 | ||||
| 2026-02-06 | 13F | EverSource Wealth Advisors, LLC | 140 | -27,08 | 0 | |||||
| 2025-11-04 | 13F | IMC-Chicago, LLC | 0 | -100,00 | 0 | |||||
| 2026-02-10 | 13F | Commonwealth Of Pennsylvania Public School Empls Retrmt Sys | 131.307 | 0,00 | 305 | -28,97 | ||||
| 2026-02-12 | 13F | BlackRock, Inc. | 685.338 | 77.867,92 | 1.590 | 79.350,00 | ||||
| 2026-02-17 | 13F | Citadel Advisors Llc | Call | 59.500 | 14,20 | 138 | -18,34 | |||
| 2026-02-13 | 13F | Squarepoint Ops LLC | 24.536 | -18,04 | 57 | -42,27 | ||||
| 2026-02-12 | 13F | Renaissance Technologies Llc | 2.280.278 | -5,45 | 5.290 | -32,71 | ||||
| 2026-02-13 | 13F | Barclays Plc | 9.566 | 22 | ||||||
| 2026-02-18 | 13F | GWM Advisors LLC | 1.309 | 0,00 | 3 | -25,00 | ||||
| 2025-09-25 | NP | VEIEX - Vanguard Emerging Markets Stock Index Fund Investor Shares | 1.726.078 | 0,00 | 6.076 | 13,17 | ||||
| 2026-02-03 | 13F | SBI Securities Co., Ltd. | 1.121 | -1,23 | 3 | -33,33 | ||||
| 2026-02-17 | 13F | Susquehanna International Group, Llp | Call | 252.500 | -24,76 | 586 | -46,53 | |||
| 2026-02-17 | 13F | Susquehanna International Group, Llp | 132.949 | 308 | ||||||
| 2026-02-17 | 13F | Susquehanna International Group, Llp | Put | 82.000 | -43,41 | 190 | -59,75 | |||
| 2026-02-10 | 13F | Bnp Paribas Arbitrage, Sa | 262.555 | 100,52 | 609 | 42,96 | ||||
| 2026-02-06 | 13F | Gsa Capital Partners Llp | 131.108 | 16,83 | 0 | |||||
| 2026-01-29 | 13F | Cornerstone Investment Partners, LLC | 0 | -100,00 | 0 | |||||
| 2026-02-13 | 13F | Centiva Capital, LP | 0 | -100,00 | 0 | |||||
| 2026-02-17 | 13F | Tower Research Capital LLC (TRC) | 25.726 | 194,82 | 60 | 110,71 | ||||
| 2026-02-12 | 13F | Hrt Financial Lp | 22.020 | 86,63 | 0 | |||||
| 2026-02-11 | 13F | Jpmorgan Chase & Co | 165.015 | 13,47 | 383 | -19,41 | ||||
| 2026-02-17 | 13F | Quadrature Capital Ltd | 39.454 | 92 | ||||||
| 2026-02-17 | 13F | Public Employees Retirement System Of Ohio | 75.834 | -70,31 | 176 | -78,97 | ||||
| 2026-01-20 | 13F | Signaturefd, Llc | 110 | 0,00 | 0 | |||||
| 2026-02-10 | 13F | Nomura Asset Management Co Ltd | 0 | 0 | ||||||
| 2025-11-14 | 13F | Wolverine Trading, Llc | Put | 0 | -100,00 | 0 | ||||
| 2025-11-14 | 13F | Wolverine Trading, Llc | Call | 0 | -100,00 | 0 | ||||
| 2026-02-17 | 13F | Point72 Asset Management, L.P. | 112.888 | -43,01 | 262 | -59,53 | ||||
| 2026-02-13 | 13F | Morgan Stanley | 1.469.385 | -25,39 | 3.409 | -46,91 | ||||
| 2026-02-13 | 13F | Carmignac Gestion | 440.947 | 0,00 | 1.023 | -28,88 | ||||
| 2026-02-13 | 13F | American Century Companies Inc | 69.192 | 0,18 | 161 | -28,89 | ||||
| 2026-02-17 | 13F | Millennium Management Llc | 178.957 | 42,12 | 415 | 1,22 | ||||
| 2026-02-13 | 13F | Walleye Capital LLC | 89.708 | -80,57 | 208 | -86,17 | ||||
| 2025-11-03 | 13F | Mirae Asset Global Investments Co., Ltd. | 0 | -100,00 | 0 | |||||
| 2026-02-12 | 13F | SWAN Capital LLC | 32 | 0,00 | 0 | |||||
| 2026-01-21 | 13F | Prime Capital Investment Advisors, LLC | 10.000 | 0,00 | 23 | -28,12 | ||||
| 2026-02-11 | 13F | Simplex Trading, Llc | 3.475 | -96,61 | 8 | |||||
| 2026-02-13 | 13F | Sei Investments Co | 79.619 | -35,04 | 185 | -53,88 | ||||
| 2026-02-17 | 13F | XTX Topco Ltd | 213.813 | 296,07 | 496 | 183,43 | ||||
| 2026-01-30 | 13F | Us Bancorp \de\ | 0 | -100,00 | 0 | |||||
| 2026-02-17 | 13F | Susquehanna Portfolio Strategies, LLC | 72.909 | 169 | ||||||
| 2025-10-08 | 13F/A | New York State Common Retirement Fund | 0 | -100,00 | 0 | -100,00 | ||||
| 2026-02-13 | 13F | Rhumbline Advisers | 6.876 | -7,21 | 16 | -37,50 | ||||
| 2026-02-13 | 13F | Marshall Wace, Llp | 99.830 | 232 | ||||||
| 2026-02-17 | 13F | Two Sigma Securities, Llc | 16.101 | -47,74 | 37 | -63,00 | ||||
| 2026-02-17 | 13F | Jones Financial Companies Lllp | 60 | 0 | ||||||
| 2026-02-17 | 13F | Capital Fund Management S.a. | 102.070 | -18,08 | 237 | -41,87 | ||||
| 2025-11-12 | 13F | Headlands Technologies LLC | 0 | -100,00 | 0 | |||||
| 2026-03-11 | 13F | Leonteq Securities AG | 0 | -100,00 | 0 | |||||
| 2026-02-13 | 13F | Gmt Capital Corp | 177.900 | 0,00 | 413 | -28,84 | ||||
| 2025-09-26 | NP | UGPIX - UltraChina ProFund Investor Class | 7.600 | 27 | ||||||
| 2026-02-10 | 13F | Acadian Asset Management Llc | 1.060.924 | -18,94 | 2 | -50,00 |