Grundlæggende statistik
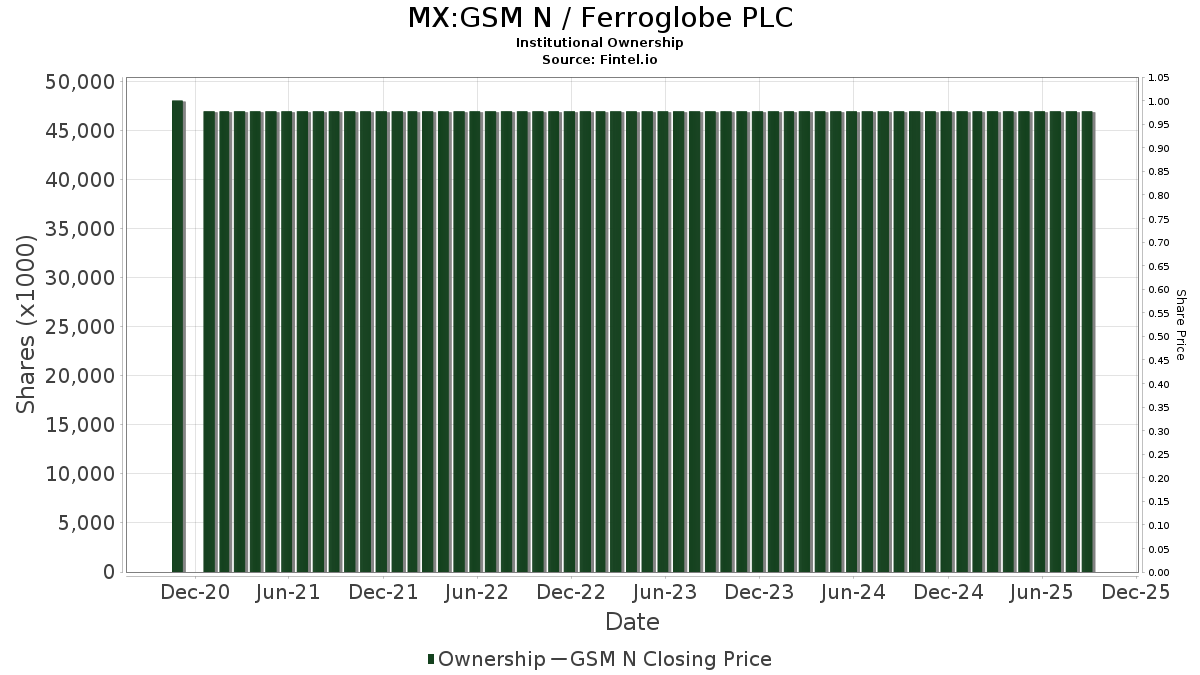
| Institutionelle aktier (lange) | 112.277.082 - 66,36% (ex 13D/G) - change of -1,54MM shares -3,16% MRQ |
| Institutionel værdi (lang) | $ 443.319 USD ($1000) |
Institutionelt ejerskab og aktionærer
Ferroglobe PLC (MX:GSM N) har 161 institutionelle ejere og aktionærer, der har indsendt 13D/G- eller 13F-formularer til Securities Exchange Commission (SEC). Disse institutioner har i alt 112,277,082 aktier. Største aktionærer omfatter Cooper Creek Partners Management Llc, Hosking Partners LLP, BlackRock, Inc., Barrow Hanley Mewhinney & Strauss Llc, Donald Smith & Co., Inc., Goldman Sachs Group Inc, Grizzlyrock Capital, Llc, Old West Investment Management, LLC, Renaissance Technologies Llc, and Royce & Associates Lp .
Ferroglobe PLC (BMV:GSM N) institutionel ejerskabsstruktur viser aktuelle positioner i virksomheden efter institutioner og fonde, samt seneste ændringer i positionsstørrelse. Større aktionærer kan omfatte individuelle investorer, investeringsforeninger, hedgefonde eller institutioner. Skema 13D angiver, at investoren besidder (eller besidder) mere end 5 % af virksomheden og har til hensigt (eller har til hensigt at) aktivt at forfølge en ændring i forretningsstrategi. Skema 13G indikerer en passiv investering på over 5%.
Fondens stemningsscore
Fund Sentiment Score (fka Ownership Accumulation Score) finder de aktier, der bliver mest købt af fonde. Det er resultatet af en sofistikeret, multi-faktor kvantitativ model, der identificerer virksomheder med de højeste niveauer af institutionel akkumulering. Scoringsmodellen bruger en kombination af den samlede stigning i oplyste ejere, ændringerne i porteføljeallokeringer i disse ejere og andre målinger. Tallet går fra 0 til 100, hvor højere tal indikerer et højere niveau af akkumulering for sine jævnaldrende, og 50 er gennemsnittet.
Opdateringsfrekvens: Dagligt
Se Ownership Explorer, som giver en liste over højest rangerende virksomheder.
AI+ Ask Fintel’s AI assistant about Ferroglobe PLC.
Select a question to share a public post with an AI-crafted answer.
Thinking of good questions…
13F og NPORT arkivering
Detaljer om 13F-arkivering er gratis. Detaljer om NP-ansøgninger kræver et premium-medlemskab. Grønne rækker angiver nye positioner. Røde rækker angiver lukkede positioner. Klik på linket ikon for at se den fulde transaktionshistorik.
Opgrader
for at låse premium-data op og eksportere til Excel ![]() .
.
| Fil dato | Kilde | Investor | Type | Gennemsnitlig pris (Øst) |
Aktier | Δ Aktier (%) |
Rapporteret Værdi ($1000) |
Δ Værdi (%) |
Port Alloc (%) |
|
|---|---|---|---|---|---|---|---|---|---|---|
| 2026-02-17 | 13F | Susquehanna Portfolio Strategies, LLC | 122.937 | 0,00 | 570 | 1,97 | ||||
| 2026-02-12 | 13F | Voya Investment Management Llc | 23.197 | 0,00 | 108 | 1,90 | ||||
| 2026-02-17 | 13F | Price T Rowe Associates Inc /md/ | 70.707 | 11,69 | 0 | |||||
| 2026-02-17 | 13F | Irenic Capital Management LP | 10.000 | 46 | ||||||
| 2026-02-09 | 13F | Coldstream Capital Management Inc | 0 | -100,00 | 0 | |||||
| 2025-11-14 | 13F | Raymond James Financial Inc | 0 | -100,00 | 0 | -100,00 | ||||
| 2026-02-13 | 13F | Quarry LP | 3.738 | 17 | ||||||
| 2026-04-13 | 13F | Parkwoods Wealth Partners, LLC | 11.500 | 0,00 | 47 | -11,32 | ||||
| 2026-02-12 | 13F | Nuveen, LLC | 174.473 | 0,00 | 810 | 2,02 | ||||
| 2026-04-21 | 13F | PharVision Advisers, LLC | 0 | -100,00 | 0 | |||||
| 2026-02-17 | 13F | Moore Capital Management, Lp | 0 | -100,00 | 0 | |||||
| 2026-02-17 | 13F | California State Teachers Retirement System | 7.360 | -1,39 | 34 | 3,03 | ||||
| 2026-02-13 | 13F | Thomist Capital Management, LP | 1.450.407 | -2,98 | 6.701 | 3,05 | ||||
| 2026-02-17 | 13F | Schonfeld Strategic Advisors LLC | 88.214 | 229,05 | 409 | 238,02 | ||||
| 2026-04-13 | 13F | Creative Financial Designs Inc /adv | 10.000 | 0,00 | 41 | -10,87 | ||||
| 2026-04-24 | 13F | Strs Ohio | 81.600 | 0,00 | 336 | -11,11 | ||||
| 2026-02-13 | 13F | Wexford Capital Lp | 345.508 | 0,00 | 1.603 | 1,97 | ||||
| 2025-11-03 | 13F | SummerHaven Investment Management, LLC | 0 | -100,00 | 0 | |||||
| 2026-02-17 | 13F | Point72 Asset Management, L.P. | 84.646 | 27,26 | 393 | 29,80 | ||||
| 2026-04-17 | 13F | AdvisorNet Financial, Inc | 3.191 | 0,00 | 13 | -7,14 | ||||
| 2025-11-26 | 13F/A | Jpmorgan Chase & Co | Call | 0 | -100,00 | 0 | -100,00 | |||
| 2026-02-09 | 13F | Royce & Associates Lp | 2.463.451 | -6,52 | 11.430 | -4,67 | ||||
| 2026-02-13 | 13F | Prudential Financial Inc | 0 | -100,00 | 0 | |||||
| 2025-11-14 | 13F | Wolverine Trading, Llc | 67.867 | -49,45 | 295 | -39,92 | ||||
| 2025-11-14 | 13F | Wolverine Trading, Llc | Call | 17.300 | 75 | |||||
| 2025-11-14 | 13F | Graham Capital Management, L.P. | 0 | -100,00 | 0 | -100,00 | ||||
| 2025-11-14 | 13F | Wolverine Trading, Llc | Put | 201.100 | -7,79 | 875 | 9,52 | |||
| 2026-02-11 | 13F | Ameritas Investment Partners, Inc. | 9.988 | 46 | ||||||
| 2026-02-10 | 13F | Quantbot Technologies LP | 20.410 | -69,08 | 95 | -68,67 | ||||
| 2026-04-07 | 13F | Central Pacific Bank - Trust Division | 49.043 | 0,00 | 202 | -11,01 | ||||
| 2026-02-13 | 13F | Boston Partners | 442.442 | -1,52 | 2.053 | 0,39 | ||||
| 2026-02-17 | 13F | Balyasny Asset Management Llc | 153.296 | -17,32 | 711 | -15,66 | ||||
| 2026-02-17 | 13F | MIRAE ASSET GLOBAL ETFS HOLDINGS Ltd. | 55.495 | -0,84 | 257 | 1,18 | ||||
| 2026-02-12 | 13F | New York State Common Retirement Fund | 37.800 | 0,00 | 175 | 2,34 | ||||
| 2026-02-04 | 13F | First Eagle Investment Management, LLC | 2.063.272 | -1,79 | 9.574 | 0,16 | ||||
| 2026-02-13 | 13F | Walleye Capital LLC | 1.522.580 | 53,03 | 7.065 | 56,04 | ||||
| 2026-02-11 | 13F | Barrow Hanley Mewhinney & Strauss Llc | 6.464.872 | -6,77 | 29.997 | -4,93 | ||||
| 2026-02-17 | 13F | AYAL Capital Advisors Ltd | 0 | -100,00 | 0 | |||||
| 2026-04-07 | 13F | Signaturefd, Llc | 2.387 | 7,72 | 10 | -10,00 | ||||
| 2026-04-28 | 13F | Unison Advisors LLC | 156.142 | 0,00 | 643 | -11,19 | ||||
| 2026-02-17 | 13F | Advisor Group Holdings, Inc. | 55.953 | 2.207,34 | 260 | 2.490,00 | ||||
| 2026-02-11 | 13F | Group One Trading, L.p. | Call | 123.100 | 167,61 | 571 | 173,21 | |||
| 2026-02-11 | 13F | Group One Trading, L.p. | Put | 13.200 | -87,89 | 61 | -87,68 | |||
| 2026-02-11 | 13F | Group One Trading, L.p. | 40.971 | -74,03 | 190 | -73,50 | ||||
| 2026-04-28 | 13F | SBI Securities Co., Ltd. | 115 | 0,00 | 0 | |||||
| 2026-02-17 | 13F | Citadel Advisors Llc | 862.329 | -30,27 | 4.001 | -28,90 | ||||
| 2026-02-17 | 13F | Citadel Advisors Llc | Call | 58.300 | 325,55 | 271 | 335,48 | |||
| 2025-11-21 | 13F/A | CIBC Bancorp USA Inc. | 12.744 | 58 | ||||||
| 2026-02-03 | 13F | Ethic Inc. | 0 | -100,00 | 0 | -100,00 | ||||
| 2026-02-17 | 13F | Caption Management, LLC | 201.150 | 933 | ||||||
| 2026-02-13 | 13F | Rhumbline Advisers | 150.136 | -14,71 | 697 | -13,00 | ||||
| 2026-02-17 | 13F | Prelude Capital Management, Llc | 34.086 | 31,81 | 158 | 35,04 | ||||
| 2026-04-27 | 13F | Counterpoint Mutual Funds LLC | 192.189 | 76,98 | 792 | 57,26 | ||||
| 2026-02-04 | 13F | West Tower Group, LLC | 125.285 | 581 | ||||||
| 2026-02-09 | 13F | Legal & General Group Plc | 142.933 | -0,82 | 663 | 0,91 | ||||
| 2025-11-13 | 13F | Quadrature Capital Ltd | 0 | -100,00 | 0 | -100,00 | ||||
| 2026-02-12 | 13F | Quadrant Capital Group Llc | 7.902 | 66,15 | 37 | 71,43 | ||||
| 2026-02-17 | 13F | Masters Capital Management Llc | 2.000.000 | 0,00 | 9.280 | 1,98 | ||||
| 2026-04-20 | 13F | State of Alaska, Department of Revenue | 7.074 | 0,00 | 0 | |||||
| 2026-02-17 | 13F | Citadel Advisors Llc | Put | 69.800 | 1,90 | 324 | 3,86 | |||
| 2026-01-15 | 13F | Nisa Investment Advisors, Llc | 1.445 | 0,00 | 7 | 0,00 | ||||
| 2026-02-11 | 13F | Deutsche Bank Ag\ | 171.052 | 64,18 | 794 | 67,30 | ||||
| 2026-01-28 | 13F | Universal- Beteiligungs- und Servicegesellschaft mbH | 131.300 | -5,40 | 607 | -3,96 | ||||
| 2026-01-28 | 13F | Legacy Capital Group California, Inc. | 128.590 | 22,99 | 597 | 25,47 | ||||
| 2026-02-13 | 13F | Manufacturers Life Insurance Company, The | 37.383 | -10,67 | 173 | -8,95 | ||||
| 2026-02-10 | 13F | Goldman Sachs Group Inc | 4.871.942 | 87,77 | 22.606 | 91,49 | ||||
| 2026-04-07 | 13F | Farther Finance Advisors, LLC | 198 | 17,16 | 1 | |||||
| 2026-02-10 | 13F | Bnp Paribas Arbitrage, Sa | 27.310 | -46,54 | 127 | -45,69 | ||||
| 2026-02-17 | 13F | Creative Planning | 42.970 | 187,48 | 199 | 192,65 | ||||
| 2026-02-11 | 13F | CenterBook Partners LP | 1.474.228 | 6.840 | ||||||
| 2026-02-17 | 13F | Millennium Management Llc | Call | 150.000 | 696 | |||||
| 2026-02-17 | 13F | Caption Management, LLC | Call | 20.000 | 93 | |||||
| 2026-02-13 | 13F | Mariner, LLC | 12.330 | 7,82 | 57 | 9,62 | ||||
| 2026-01-30 | 13F | Pekin Hardy Strauss, Inc. | 325.400 | 3,17 | 1.510 | 5,16 | ||||
| 2026-02-17 | 13F | Fmr Llc | 3.799 | 1.666,98 | 18 | |||||
| 2026-04-15 | 13F | Exchange Traded Concepts, Llc | 0 | -100,00 | 0 | |||||
| 2026-02-13 | 13F | General American Investors Co Inc | 957.591 | 0,00 | 4.443 | 1,97 | ||||
| 2025-11-14 | 13F | Aquatic Capital Management LLC | 0 | -100,00 | 0 | -100,00 | ||||
| 2026-02-10 | 13F | Intech Investment Management Llc | 69.931 | 16,64 | 324 | 19,12 | ||||
| 2025-11-13 | 13F | Winton Capital Group Ltd | 0 | -100,00 | 0 | |||||
| 2026-02-17 | 13F | Susquehanna International Group, Llp | Call | 127.500 | -54,42 | 592 | -53,54 | |||
| 2026-02-17 | 13F | Clear Street Markets Llc | 0 | -100,00 | 0 | -100,00 | ||||
| 2026-02-11 | 13F | Inceptionr Llc | 0 | -100,00 | 0 | |||||
| 2026-02-17 | 13F | Susquehanna International Group, Llp | 339.990 | 2.319,00 | 1.578 | 2.403,17 | ||||
| 2026-02-17 | 13F | Susquehanna International Group, Llp | Put | 109.800 | 0,09 | 509 | 2,00 | |||
| 2025-11-14 | 13F | Federation des caisses Desjardins du Quebec | 0 | -100,00 | 0 | |||||
| 2026-02-17 | 13F | Boothbay Fund Management, Llc | 11.749 | 55 | ||||||
| 2026-02-13 | 13F | Sei Investments Co | 382.991 | 217,73 | 1.777 | 224,27 | ||||
| 2026-02-13 | 13F | JustInvest LLC | 18.466 | -7,52 | 86 | -5,56 | ||||
| 2026-02-13 | 13F | Jacobs Levy Equity Management, Inc | 1.081.208 | 52,25 | 5.017 | 55,25 | ||||
| 2026-02-17 | 13F | Jones Financial Companies Lllp | 118 | 0,00 | 1 | |||||
| 2026-02-12 | 13F | MetLife Investment Management, LLC | 52.411 | -17,02 | 243 | -15,33 | ||||
| 2026-02-17 | 13F | Ameriprise Financial Inc | 2.227.584 | 4,00 | 10.336 | 6,05 | ||||
| 2025-11-13 | 13F | Hsbc Holdings Plc | 0 | -100,00 | 0 | -100,00 | ||||
| 2026-04-27 | 13F | Pensionmark Financial Group, Llc | 22.388 | -1,84 | 92 | -12,38 | ||||
| 2026-02-17 | 13F | Public Employees Retirement System Of Ohio | 143.039 | 35,26 | 664 | 37,84 | ||||
| 2026-02-12 | 13F | Cibc World Markets Corp | 0 | -100,00 | 0 | |||||
| 2026-02-17 | 13F | Bardin Hill Management Partners Lp | 0 | -100,00 | 0 | -100,00 | ||||
| 2026-02-10 | 13F | Envestnet Asset Management Inc | 440.490 | 8,84 | 2.044 | 10,97 | ||||
| 2026-02-11 | 13F | Franklin Resources Inc | 88.047 | -22,86 | 409 | -21,39 | ||||
| 2026-02-11 | 13F | Parallel Advisors, LLC | 229 | -3,38 | 1 | 0,00 | ||||
| 2026-02-17 | 13F | Northern Trust Corp | 624.972 | -13,37 | 2.900 | -11,67 | ||||
| 2026-02-17 | 13F | Bank Of America Corp /de/ | 1.087.470 | 30,07 | 5.046 | 32,62 | ||||
| 2026-02-12 | 13F | Bank Of Montreal /can/ | 192.534 | 17,47 | 893 | 19,87 | ||||
| 2026-02-05 | 13F | Amalgamated Bank | 3.756 | -8,01 | 0 | |||||
| 2026-02-06 | 13F | Pnc Financial Services Group, Inc. | 364 | 391,89 | 2 | |||||
| 2026-02-17 | 13F | D. E. Shaw & Co., Inc. | 147.411 | 562,76 | 684 | 576,24 | ||||
| 2026-02-17 | 13F | PDT Partners, LLC | 59.778 | 0,00 | 277 | 2,21 | ||||
| 2026-04-16 | 13F | SG Americas Securities, LLC | 0 | -100,00 | 0 | |||||
| 2026-02-17 | 13F | Wiley Bros.-aintree Capital, Llc | 22.839 | 4,12 | 106 | 6,06 | ||||
| 2026-01-22 | 13F | Brookwood Investment Group LLC | 14.566 | -61,61 | 68 | -61,05 | ||||
| 2026-02-13 | 13F | Polymer Capital Management (HK) LTD | 0 | -100,00 | 0 | |||||
| 2026-02-05 | 13F | Allworth Financial LP | 767 | 26,78 | 4 | 50,00 | ||||
| 2026-02-11 | 13F | LPL Financial LLC | 150.600 | 85,18 | 699 | 88,65 | ||||
| 2026-04-21 | 13F | Hosking Partners LLP | 11.561.188 | 3,08 | 47.632 | -8,47 | ||||
| 2026-04-27 | 13F | PFG Investments, LLC | 10.952 | 45 | ||||||
| 2026-04-27 | 13F | Y-Intercept (Hong Kong) Ltd | 30.132 | 124 | ||||||
| 2026-02-17 | 13F | XTX Topco Ltd | 13.419 | -87,05 | 62 | -86,84 | ||||
| 2026-02-13 | 13F | OMERS ADMINISTRATION Corp | 0 | -100,00 | 0 | |||||
| 2026-02-13 | 13F | Banco Santander, S.A. | 14.859 | 0,00 | 69 | 1,49 | ||||
| 2026-02-11 | 13F | Jpmorgan Chase & Co | Put | 0 | -100,00 | 0 | -100,00 | |||
| 2026-02-17 | 13F | Millennium Management Llc | 0 | -100,00 | 0 | |||||
| 2025-11-14 | 13F | Engineers Gate Manager LP | 0 | -100,00 | 0 | -100,00 | ||||
| 2026-04-22 | 13F | Sterling Capital Management LLC | 3.984 | -42,19 | 16 | -48,39 | ||||
| 2026-01-29 | 13F | IMC-Chicago, LLC | Call | 129.100 | 599 | |||||
| 2026-01-30 | 13F | R Squared Ltd | 0 | -100,00 | 0 | |||||
| 2026-02-13 | 13F | Marshall Wace, Llp | 35.800 | 49,79 | 166 | 53,70 | ||||
| 2026-02-13 | 13F | American Century Companies Inc | 2.302.286 | 91,68 | 10.683 | 95,46 | ||||
| 2026-04-22 | 13F | Spire Wealth Management | 1.018 | -87,78 | 4 | -89,47 | ||||
| 2026-02-11 | 13F | Jpmorgan Chase & Co | 450.808 | 41,00 | 2.092 | 43,81 | ||||
| 2026-01-26 | 13F | Cwm, Llc | 266 | 84,72 | 0 | |||||
| 2026-02-17 | 13F | Orion Resource Partners LP | 184.883 | 858 | ||||||
| 2026-02-13 | 13F | Smartleaf Asset Management LLC | 1.043 | 5 | ||||||
| 2026-02-17 | 13F | Spears Abacus Advisors LLC | 75.000 | 0,00 | 348 | 2,05 | ||||
| 2026-02-09 | 13F | Ballast Asset Management, LP | 849.162 | -3,35 | 3.940 | -1,43 | ||||
| 2026-02-13 | 13F | Caitong International Asset Management Co., Ltd | 1.055 | 11.622,22 | 5 | |||||
| 2026-02-06 | 13F | Cullen/frost Bankers, Inc. | 3.000 | 14 | ||||||
| 2026-02-06 | 13F | Covestor Ltd | 14.160 | 23,24 | 0 | |||||
| 2026-02-13 | 13F | SRS Capital Advisors, Inc. | 0 | -100,00 | 0 | |||||
| 2026-02-13 | 13F | Wells Fargo & Company/mn | 145.045 | -17,13 | 673 | -15,45 | ||||
| 2026-02-12 | 13F | BlackRock, Inc. | 6.868.390 | 0,91 | 31.869 | 2,91 | ||||
| 2026-02-17 | 13F | State Of Wisconsin Investment Board | 40.957 | 190 | ||||||
| 2026-02-17 | 13F | Jump Financial, LLC | 114.372 | -9,01 | 531 | -7,18 | ||||
| 2026-02-17 | 13F | Old West Investment Management, LLC | 3.798.781 | 17,32 | 17.626 | 19,64 | ||||
| 2026-04-14 | 13F | Cohen Capital Management, Inc. | 26.400 | 0,00 | 109 | -11,48 | ||||
| 2026-02-13 | 13F | Pinnacle Wealth Planning Services, Inc. | 1.577 | 7 | ||||||
| 2026-02-13 | 13F | Barclays Plc | 189.524 | 12,68 | 879 | 14,90 | ||||
| 2026-02-13 | 13F | Wolf Hill Capital Management, LP | 1.533.069 | -60,87 | 7.113 | -60,10 | ||||
| 2026-04-24 | 13F | ProShare Advisors LLC | 17.330 | -20,68 | 71 | -29,70 | ||||
| 2026-01-29 | 13F | Vanguard Group Inc | 814.826 | 0,99 | 3.781 | 2,97 | ||||
| 2026-04-06 | 13F | GAMMA Investing LLC | 221 | 0,00 | 1 | -100,00 | ||||
| 2026-02-10 | 13F | Connor, Clark & Lunn Investment Management Ltd. | 0 | -100,00 | 0 | |||||
| 2026-02-17 | 13F | Lombard Odier Asset Management (USA) Corp | 118.457 | 550 | ||||||
| 2026-02-14 | 13F | Rockefeller Capital Management L.P. | 5.810 | -48,62 | 27 | -49,02 | ||||
| 2026-02-17 | 13F | Ardsley Advisory Partners Lp | 2.120.000 | 9.837 | ||||||
| 2026-01-23 | 13F | Deprince Race & Zollo Inc | 0 | -100,00 | 0 | |||||
| 2026-02-12 | 13F | Hrt Financial Lp | 278.276 | 1 | ||||||
| 2026-04-22 | 13F | 1492 Capital Management LLC | 519.449 | 12,65 | 2.140 | 0,05 | ||||
| 2026-02-13 | 13F | Charles Schwab Investment Management Inc | 1.598.052 | 28,31 | 7.415 | 30,85 | ||||
| 2026-02-17 | 13F | Cooper Creek Partners Management Llc | 14.921.946 | 0,88 | 69 | 2,99 | ||||
| 2026-02-17 | 13F | Grizzlyrock Capital, Llc | 4.075.742 | -1,87 | 18.911 | 0,07 | ||||
| 2026-02-17 | 13F | Bardin Hill Investment Partners LP | 1.297.552 | 6.021 | ||||||
| 2026-02-17 | 13F | Royal Bank Of Canada | 3.626 | 21,39 | 16 | 14,29 | ||||
| 2025-11-14 | 13F | Susquehanna Fundamental Investments, Llc | 0 | -100,00 | 0 | -100,00 | ||||
| 2026-02-17 | 13F | Russell Investments Group, Ltd. | 1.212.558 | -42,50 | 5.626 | -41,36 | ||||
| 2026-02-17 | 13F | Tower Research Capital LLC (TRC) | 3.219 | 2,52 | 15 | 0,00 | ||||
| 2026-02-12 | 13F | Dimensional Fund Advisors Lp | 2.233.148 | -1,59 | 10.361 | 0,38 | ||||
| 2026-04-23 | 13F | Master's Wealth Management Inc. | 12.410 | 51 | ||||||
| 2026-02-17 | 13F | Dba Trading, Llc | 519.060 | 2.408 | ||||||
| 2026-02-09 | 13F | Geode Capital Management, Llc | 1.562.893 | -2,25 | 7.252 | -0,33 | ||||
| 2026-02-11 | 13F | Los Angeles Capital Management Llc | 73.560 | -22,64 | 355 | -18,06 | ||||
| 2026-02-13 | 13F | Diametric Capital, LP | 212.902 | 127,77 | 988 | 132,24 | ||||
| 2026-02-19 | 13F | CI Private Wealth, LLC | 99.043 | -0,02 | 460 | 2,00 | ||||
| 2026-02-13 | 13F | Wells Fargo & Company/mn | Put | 0 | -100,00 | 0 | -100,00 | |||
| 2026-02-17 | 13F | Bridgeway Capital Management Inc | 1.353.863 | 4,91 | 6.282 | 6,98 | ||||
| 2026-02-11 | 13F | Simplex Trading, Llc | 103.847 | -43,18 | 482 | |||||
| 2026-01-29 | 13F | UBS Group AG | 586.207 | 23,43 | 2.720 | 25,93 | ||||
| 2026-02-11 | 13F | Simplex Trading, Llc | Call | 17.400 | -25,96 | 81 | ||||
| 2026-02-13 | 13F | Gendell Jeffrey L | 97.997 | 455 | ||||||
| 2026-02-18 | 13F/A | Empowered Funds, LLC | 817.763 | 10,84 | 3.794 | 13,02 | ||||
| 2026-02-11 | 13F | Simplex Trading, Llc | Put | 79.900 | -71,32 | 371 | 36.900,00 | |||
| 2026-02-10 | 13F | State of Wyoming | 11.278 | -55,48 | 52 | -54,78 | ||||
| 2026-02-13 | 13F | Morgan Stanley | 778.926 | 40,66 | 3.614 | 43,47 | ||||
| 2026-02-12 | 13F | Orchard Capital Managment, LLC | 681.745 | 40,76 | 3.163 | 43,58 | ||||
| 2026-04-28 | 13F | Harbor Capital Advisors, Inc. | 1.504 | -33,95 | 0 | |||||
| 2026-04-27 | 13F | Truist Financial Corp | 10.200 | 0,00 | 42 | -10,64 | ||||
| 2026-02-10 | 13F | Bank of New York Mellon Corp | 266.095 | -7,35 | 1.235 | -5,51 | ||||
| 2026-02-17 | 13F | Alliancebernstein L.p. | 100.200 | 13,09 | 465 | 15,14 | ||||
| 2026-02-17 | 13F | Two Sigma Advisers, Lp | 19.700 | 10,67 | 91 | 13,75 | ||||
| 2026-04-15 | 13F | FNY Investment Advisers, LLC | 0 | -100,00 | 0 | |||||
| 2026-02-13 | 13F | Police & Firemen's Retirement System of New Jersey | 29.358 | -19,51 | 136 | -17,58 | ||||
| 2026-02-12 | 13F | Beck Mack & Oliver Llc | 40.400 | 0,00 | 187 | 2,19 | ||||
| 2026-02-17 | 13F | Cooper Creek Partners Management Llc | Call | 520.700 | 2 | |||||
| 2026-02-04 | 13F | Arena Capital Advisors, LLC- CA | 0 | -100,00 | 0 | |||||
| 2026-02-11 | 13F | Donald Smith & Co., Inc. | 5.359.073 | 24.866 | ||||||
| 2025-11-14 | 13F | Centiva Capital, LP | 0 | -100,00 | 0 | |||||
| 2026-02-13 | 13F | Jb Capital Partners Lp | 655.000 | 0,00 | 3.039 | 1,98 | ||||
| 2026-02-19 | 13F | Invesco Ltd. | 299.341 | 18,69 | 1.389 | 21,01 | ||||
| 2026-03-12 | 13F/A | Peak6 Llc | Call | 330.000 | 1.531 | |||||
| 2026-02-12 | 13F | Renaissance Technologies Llc | 2.872.135 | -6,96 | 13.327 | -5,13 | ||||
| 2026-04-13 | 13F | Highland Capital Management, Llc | 10.000 | 0,00 | 41 | -10,87 | ||||
| 2026-02-12 | 13F | Jane Street Group, Llc | 201.725 | -38,91 | 936 | -37,68 | ||||
| 2026-02-13 | 13F | Citigroup Inc | 11.963 | -43,50 | 56 | -42,71 | ||||
| 2026-02-12 | 13F | Jane Street Group, Llc | Put | 98.900 | 3,02 | 459 | 5,05 | |||
| 2026-02-17 | 13F | Occudo Quantitative Strategies Lp | 0 | -100,00 | 0 | |||||
| 2026-02-13 | 13F | Squarepoint Ops LLC | 58.654 | -77,91 | 272 | -77,48 | ||||
| 2026-04-23 | 13F | SJS Investment Consulting Inc. | 5 | 0 | ||||||
| 2026-02-13 | 13F | Verition Fund Management LLC | 152.076 | -13,82 | 706 | -12,09 | ||||
| 2026-02-13 | 13F | State Street Corp | 2.067.186 | 4,84 | 9.592 | 6,91 | ||||
| 2026-02-17 | 13F/A | RBF Capital, LLC | 521.005 | 0,00 | 2.417 | 1,98 | ||||
| 2025-11-14 | 13F | Jane Street Group, Llc | Call | 0 | -100,00 | 0 | -100,00 |