Grundlæggende statistik
| Institutionelle ejere | 78 total, 72 long only, 0 short only, 6 long/short - change of -16,07% MRQ |
| Gennemsnitlig porteføljeallokering | 0.4775 % - change of 6,14% MRQ |
| Institutionelle aktier (lange) | 2.637.554 (ex 13D/G) - change of 0,04MM shares 2,04% MRQ |
| Institutionel værdi (lang) | $ 152.489 USD ($1000) |
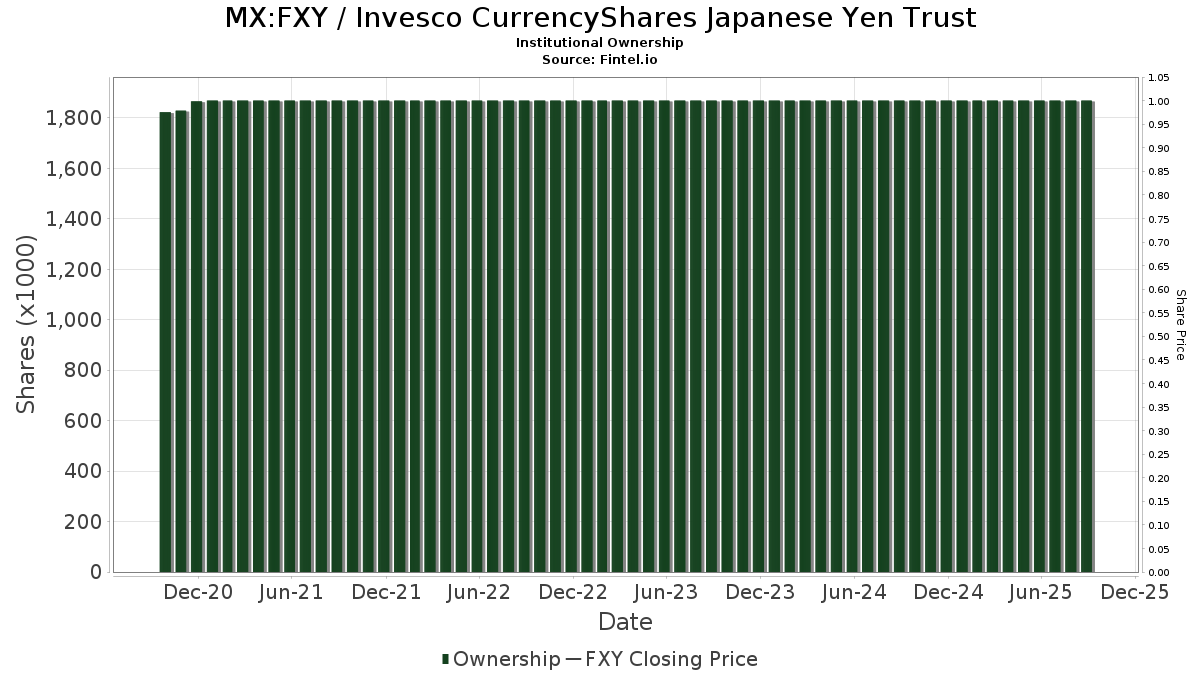
Institutionelt ejerskab og aktionærer
Invesco CurrencyShares Japanese Yen Trust (MX:FXY) har 78 institutionelle ejere og aktionærer, der har indsendt 13D/G- eller 13F-formularer til Securities Exchange Commission (SEC). Disse institutioner har i alt 2,637,554 aktier. Største aktionærer omfatter Federation des caisses Desjardins du Quebec, Citadel Advisors Llc, IMC-Chicago, LLC, Citadel Advisors Llc, CIBC World Markets Inc., Citadel Advisors Llc, Jane Street Group, Llc, Susquehanna International Group, Llp, National Bank Of Canada /fi/, and Morgan Stanley .
Invesco CurrencyShares Japanese Yen Trust (BMV:FXY) institutionel ejerskabsstruktur viser aktuelle positioner i virksomheden efter institutioner og fonde, samt seneste ændringer i positionsstørrelse. Større aktionærer kan omfatte individuelle investorer, investeringsforeninger, hedgefonde eller institutioner. Skema 13D angiver, at investoren besidder (eller besidder) mere end 5 % af virksomheden og har til hensigt (eller har til hensigt at) aktivt at forfølge en ændring i forretningsstrategi. Skema 13G indikerer en passiv investering på over 5%.
Fondens stemningsscore
Fund Sentiment Score (fka Ownership Accumulation Score) finder de aktier, der bliver mest købt af fonde. Det er resultatet af en sofistikeret, multi-faktor kvantitativ model, der identificerer virksomheder med de højeste niveauer af institutionel akkumulering. Scoringsmodellen bruger en kombination af den samlede stigning i oplyste ejere, ændringerne i porteføljeallokeringer i disse ejere og andre målinger. Tallet går fra 0 til 100, hvor højere tal indikerer et højere niveau af akkumulering for sine jævnaldrende, og 50 er gennemsnittet.
Opdateringsfrekvens: Dagligt
Se Ownership Explorer, som giver en liste over højest rangerende virksomheder.
AI+ Ask Fintel’s AI assistant about Invesco CurrencyShares Japanese Yen Trust.
Select a question to share a public post with an AI-crafted answer.
Thinking of good questions…
13F og NPORT arkivering
Detaljer om 13F-arkivering er gratis. Detaljer om NP-ansøgninger kræver et premium-medlemskab. Grønne rækker angiver nye positioner. Røde rækker angiver lukkede positioner. Klik på linket ikon for at se den fulde transaktionshistorik.
Opgrader
for at låse premium-data op og eksportere til Excel ![]() .
.
| Fil dato | Kilde | Investor | Type | Gennemsnitlig pris (Øst) |
Aktier | Δ Aktier (%) |
Rapporteret Værdi ($1000) |
Δ Værdi (%) |
Port Alloc (%) |
|
|---|---|---|---|---|---|---|---|---|---|---|
| 2026-01-30 | 13F | North Star Investment Management Corp. | 0 | -100,00 | 0 | |||||
| 2025-10-31 | 13F | Investment House Llc | 0 | -100,00 | 0 | |||||
| 2026-02-13 | 13F | Change Path, LLC | 7.905 | 6,93 | 464 | 0,87 | ||||
| 2026-02-17 | 13F | Royal Bank Of Canada | 16.728 | 247,13 | 982 | 227,33 | ||||
| 2026-02-17 | 13F | Cetera Investment Advisers | 0 | -100,00 | 0 | |||||
| 2026-02-13 | 13F | Delos Wealth Advisors, LLC | 1.307 | 4,48 | 77 | -1,30 | ||||
| 2026-02-10 | 13F | CIBC World Markets Inc. | 151.546 | 11,72 | 8.891 | 5,37 | ||||
| 2026-02-12 | 13F | Jane Street Group, Llc | 129.908 | -65,44 | 7.622 | -67,41 | ||||
| 2026-01-27 | 13F | Evergreen Capital Management Llc | 30.456 | -14,25 | 1.787 | -19,15 | ||||
| 2026-02-12 | 13F | Jane Street Group, Llc | Call | 12.900 | -46,69 | 757 | -49,77 | |||
| 2026-02-17 | 13F | Creative Planning | 4.962 | -37,04 | 291 | -40,61 | ||||
| 2026-02-13 | 13F | Stifel Financial Corp | 3.762 | 0,32 | 221 | -5,58 | ||||
| 2025-10-21 | 13F | Pettinga Financial Advisors, LLC | 0 | -100,00 | 0 | |||||
| 2026-02-11 | 13F | Simplex Trading, Llc | Put | 0 | -100,00 | 0 | ||||
| 2026-02-11 | 13F | Simplex Trading, Llc | Call | 0 | -100,00 | 0 | ||||
| 2026-02-05 | 13F | Thrivent Financial For Lutherans | 7.591 | 0 | ||||||
| 2026-01-27 | 13F | Checchi Capital Advisers, LLC | 6.540 | -51,04 | 384 | -53,91 | ||||
| 2025-10-20 | 13F | Pure Financial Advisors, Inc. | 0 | -100,00 | 0 | |||||
| 2025-11-14 | 13F | Centerstone Investors, LLC | 0 | -100,00 | 0 | -100,00 | ||||
| 2026-02-11 | 13F | LPL Financial LLC | 41.879 | 6,78 | 2.457 | 0,74 | ||||
| 2025-11-12 | 13F | Neuberger Berman Group LLC | 0 | -100,00 | 0 | -100,00 | ||||
| 2026-02-17 | 13F | Tower Research Capital LLC (TRC) | 70 | 2.233,33 | 4 | |||||
| 2026-02-13 | 13F | Gts Securities Llc | 0 | -100,00 | 0 | -100,00 | ||||
| 2026-02-12 | 13F | Commonwealth Equity Services, Llc | 22.021 | -22,81 | 1.292 | 129.000,00 | ||||
| 2025-10-22 | 13F | David R. Rahn & Associates Inc. | 0 | -100,00 | 0 | |||||
| 2026-02-10 | 13F | Goldman Sachs Group Inc | 50.000 | -26,95 | 2.934 | -31,12 | ||||
| 2026-02-17 | 13F | Quadrature Capital Ltd | 26.087 | 1.531 | ||||||
| 2025-11-13 | 13F | Private Advisor Group, LLC | 0 | -100,00 | 0 | |||||
| 2026-01-23 | 13F | Farther Finance Advisors, LLC | 120 | 7 | ||||||
| 2026-02-17 | 13F | Ameriprise Financial Inc | 3.840 | 225 | ||||||
| 2026-02-09 | 13F | Key FInancial Inc | 695 | -2,39 | 41 | -9,09 | ||||
| 2026-02-02 | 13F | Broussard Financial Group LLC | 81.594 | 4.787 | ||||||
| 2026-02-20 | 13F | Sunbelt Securities, Inc. | 0 | -100,00 | 0 | |||||
| 2026-02-17 | 13F | Advisory Services Network, LLC | 36.230 | -34,66 | 2.126 | -38,39 | ||||
| 2026-01-22 | 13F | Nautilus Advisors LLC | 5.768 | 0,00 | 338 | -5,59 | ||||
| 2026-02-11 | 13F | Jpmorgan Chase & Co | 31.163 | 242,98 | 1.828 | 223,54 | ||||
| 2026-02-11 | 13F | Jpmorgan Chase & Co | Call | 81.200 | 4.764 | |||||
| 2025-11-14 | 13F | Wolverine Trading, Llc | 14.986 | 94,65 | 928 | 89,57 | ||||
| 2025-11-14 | 13F | Wolverine Trading, Llc | Call | 88.700 | 15,34 | 5.491 | 12,27 | |||
| 2026-02-12 | 13F | Jane Street Group, Llc | Put | 0 | -100,00 | 0 | -100,00 | |||
| 2026-02-19 | 13F | CI Private Wealth, LLC | 9.080 | -67,89 | 533 | -69,76 | ||||
| 2025-11-14 | 13F | Wolverine Trading, Llc | Put | 26.400 | 46,67 | 1.634 | 42,83 | |||
| 2026-02-13 | 13F | Peak6 Llc | Call | 72.000 | 0,00 | 4.224 | -5,69 | |||
| 2026-01-15 | 13F | Hara Capital LLC | 51.094 | -4,06 | 2.998 | -9,51 | ||||
| 2025-10-16 | 13F | Nvwm, Llc | 0 | -100,00 | 0 | |||||
| 2026-01-29 | 13F | IMC-Chicago, LLC | 0 | -100,00 | 0 | -100,00 | ||||
| 2026-01-23 | 13F | HBW Advisory Services LLC | 19.922 | -10,34 | 1.169 | -15,48 | ||||
| 2026-02-06 | 13F | Private Wealth Advisors, LLC | 67.174 | -14,80 | 3.941 | -19,64 | ||||
| 2026-01-20 | 13F | Raab & Moskowitz Asset Management LLC | 0 | -100,00 | 0 | |||||
| 2026-02-09 | 13F | Atlantic Trust, LLC | 0 | -100,00 | 0 | |||||
| 2025-10-15 | 13F | DAVENPORT & Co LLC | Call | 0 | -100,00 | 0 | -100,00 | |||
| 2026-02-13 | 13F | MAI Capital Management | 2.875 | 0,00 | 169 | -5,62 | ||||
| 2026-02-17 | 13F | Game Creek Capital, LP | Call | 20.000 | 1.173 | |||||
| 2026-02-02 | 13F | Hussman Strategic Advisors, Inc. | 12.500 | 0,00 | 733 | -5,66 | ||||
| 2026-02-13 | 13F | Transamerica Financial Advisors, Inc. | 4 | 0,00 | 0 | |||||
| 2026-02-17 | 13F | Captrust Financial Advisors | 30.622 | 1,61 | 1.797 | -4,16 | ||||
| 2025-11-14 | 13F | Mml Investors Services, Llc | 0 | -100,00 | 0 | |||||
| 2025-11-03 | 13F | TD Waterhouse Canada Inc. | 0 | -100,00 | 0 | |||||
| 2025-11-07 | 13F | HighTower Advisors, LLC | 0 | -100,00 | 0 | |||||
| 2025-11-12 | 13F | Simplex Trading, Llc | 0 | -100,00 | 0 | -100,00 | ||||
| 2026-02-17 | 13F | Advisor Group Holdings, Inc. | 22.030 | 21,10 | 1.292 | 13,83 | ||||
| 2026-02-13 | 13F | Walleye Trading LLC | Put | 0 | -100,00 | 0 | -100,00 | |||
| 2026-02-13 | 13F | Walleye Trading LLC | 0 | -100,00 | 0 | -100,00 | ||||
| 2026-02-13 | 13F | Wells Fargo & Company/mn | 14.954 | -5,64 | 877 | -10,96 | ||||
| 2026-01-29 | 13F | Comerica Bank | 550 | 0,00 | 32 | -5,88 | ||||
| 2026-02-13 | 13F | Solstein Capital, LLC | 5.820 | -2,71 | 341 | -8,33 | ||||
| 2026-02-11 | 13F | Parallel Advisors, LLC | 970 | -38,61 | 57 | -42,86 | ||||
| 2026-01-30 | 13F | Pekin Hardy Strauss, Inc. | 0 | -100,00 | 0 | -100,00 | ||||
| 2026-02-17 | 13F | Bank Of America Corp /de/ | 19.702 | 67,63 | 1.156 | 58,00 | ||||
| 2026-02-04 | 13F | Fourth Dimension Wealth, LLC | 1.100 | 0,00 | 65 | -5,88 | ||||
| 2026-02-12 | 13F | Hrt Financial Lp | 12.085 | -15,19 | 1 | |||||
| 2026-01-21 | 13F | Newbridge Financial Services Group, Inc. | 900 | 50,00 | 53 | 40,54 | ||||
| 2026-02-13 | 13F | Peak6 Llc | Put | 0 | -100,00 | 0 | -100,00 | |||
| 2026-01-23 | 13F | Stephenson National Bank & Trust | 285 | 0,00 | 17 | -5,88 | ||||
| 2025-11-05 | 13F | MONECO Advisors, LLC | 0 | -100,00 | 0 | -100,00 | ||||
| 2026-01-14 | 13F | Wolff Wiese Magana Llc | 162 | 0,00 | 10 | -10,00 | ||||
| 2026-02-03 | 13F | Diversify Wealth Management, Llc | 4.689 | 0,00 | 271 | -3,23 | ||||
| 2026-01-16 | 13F | FNY Investment Advisers, LLC | 1.500 | 0 | ||||||
| 2026-02-05 | 13F | Leuthold Group, Llc | 92.126 | -1,45 | 5.405 | -7,05 | ||||
| 2026-01-16 | 13F | FNY Investment Advisers, LLC | Call | 10 | 0 | |||||
| 2026-02-05 | 13F | Cambridge Investment Research Advisors, Inc. | 5.806 | 8,65 | 0 | |||||
| 2026-02-11 | 13F | Bradley & Co. Private Wealth Management, LLC | 33 | -48,44 | 2 | -66,67 | ||||
| 2026-02-13 | 13F | Peak6 Llc | 0 | -100,00 | 0 | -100,00 | ||||
| 2026-02-10 | 13F | WCG Wealth Advisors LLC | 0 | -100,00 | 0 | |||||
| 2026-01-30 | 13F | Us Bancorp \de\ | 1.382 | 13,84 | 81 | 8,00 | ||||
| 2026-02-11 | 13F | Signet Private Wealth LLC | 7.454 | 437 | ||||||
| 2025-10-22 | 13F | West Paces Advisors Inc. | 0 | -100,00 | 0 | -100,00 | ||||
| 2026-01-29 | 13F | IMC-Chicago, LLC | Call | 171.800 | 78,59 | 10.080 | 68,43 | |||
| 2026-02-12 | 13F | Haven Private, LLC | 0 | -100,00 | 0 | |||||
| 2026-02-17 | 13F | Citadel Advisors Llc | Put | 141.000 | 9,13 | 8.272 | 2,92 | |||
| 2026-02-17 | 13F | Citadel Advisors Llc | 171.020 | 591,02 | 10.034 | 551,92 | ||||
| 2026-02-13 | 13F | National Bank Of Canada /fi/ | 110.608 | 757,43 | 6.485 | 708,48 | ||||
| 2026-02-17 | 13F | Citadel Advisors Llc | Call | 264.400 | 29,29 | 15.512 | 21,94 | |||
| 2026-02-18 | 13F | GWM Advisors LLC | 0 | -100,00 | 0 | |||||
| 2025-11-12 | 13F | HAP Trading, LLC | Call | 16.300 | 5 | |||||
| 2026-01-29 | 13F | Almanack Investment Partners, LLC. | 0 | -100,00 | 0 | |||||
| 2026-02-06 | 13F | Global Retirement Partners, LLC | 0 | -100,00 | 0 | |||||
| 2025-11-12 | 13F | Group One Trading, L.p. | 0 | -100,00 | 0 | -100,00 | ||||
| 2025-11-05 | 13F | Waterloo Capital, L.P. | 0 | -100,00 | 0 | |||||
| 2026-02-17 | 13F | Susquehanna International Group, Llp | 118.845 | 816,38 | 6.973 | 765,01 | ||||
| 2026-01-29 | 13F | UBS Group AG | 31.128 | -26,24 | 1.826 | -30,44 | ||||
| 2026-02-17 | 13F | Susquehanna International Group, Llp | Put | 46.900 | -39,17 | 2.752 | -42,64 | |||
| 2026-02-17 | 13F | Susquehanna International Group, Llp | Call | 42.700 | -30,23 | 2.505 | -34,20 | |||
| 2025-11-14 | 13F | Two Sigma Securities, Llc | 0 | -100,00 | 0 | |||||
| 2026-02-13 | 13F | Markin Asset Management, LP | 3.707 | 217 | ||||||
| 2026-01-21 | 13F | Leo Wealth, LLC | 5.187 | 1,57 | 304 | -4,10 | ||||
| 2026-01-29 | 13F | IMC-Chicago, LLC | Put | 25.600 | -45,65 | 1.502 | -48,77 | |||
| 2026-02-13 | 13F | Landscape Capital Management, L.l.c. | 0 | -100,00 | 0 | |||||
| 2026-02-09 | 13F | Strategic Financial Concepts, LLC | 0 | -100,00 | 0 | -100,00 | ||||
| 2026-02-03 | 13F | We Are One Seven, LLC | 18.775 | -39,45 | 1.102 | -42,89 | ||||
| 2025-11-14 | 13F | Raymond James Financial Inc | 0 | -100,00 | 0 | |||||
| 2026-02-12 | 13F | Federation des caisses Desjardins du Quebec | 863.960 | -1,14 | 50.689 | -6,77 | ||||
| 2026-02-17 | 13F | Cresset Asset Management, LLC | 45.748 | 2.684 | ||||||
| 2026-02-10 | 13F | Envestnet Asset Management Inc | 3.487 | -1,86 | 205 | -7,69 | ||||
| 2026-02-09 | 13F | Hartland & Co., LLC | 1.326 | 0,00 | 78 | -6,10 | ||||
| 2026-02-13 | 13F | Truffle Hound Capital, LLC | 0 | -100,00 | 0 | |||||
| 2026-02-12 | 13F | Hollencrest Capital Management | 60.000 | 0,00 | 3.520 | -5,68 | ||||
| 2026-02-13 | 13F | Walleye Trading LLC | Call | 5.000 | 0,00 | 293 | -5,79 | |||
| 2026-01-27 | 13F | Krilogy Financial LLC | 0 | -100,00 | 0 | |||||
| 2026-02-03 | 13F | International Assets Investment Management, Llc | 760 | 45 | ||||||
| 2026-02-06 | 13F | 3EDGE Asset Management, LP | 0 | -100,00 | 0 | |||||
| 2025-11-14 | 13F | Hamilton Wealth, LLC | 0 | -100,00 | 0 | -100,00 | ||||
| 2026-02-17 | 13F | Blair William & Co/il | 18.136 | 1.064 | ||||||
| 2026-02-11 | 13F | Group One Trading, L.p. | Put | 1.200 | -79,66 | 70 | -80,93 | |||
| 2026-02-12 | 13F | Steward Partners Investment Advisory, Llc | 650 | 0,00 | 38 | -5,00 | ||||
| 2026-02-11 | 13F | Group One Trading, L.p. | Call | 41.600 | 45,96 | 2.441 | 37,70 | |||
| 2025-10-28 | 13F | BRYN MAWR TRUST Co | 236 | 0,00 | 15 | -6,67 | ||||
| 2026-02-04 | 13F | Atlantic Union Bankshares Corp | 100 | 6 | ||||||
| 2025-11-13 | 13F | Basso Capital Management, L.p. | 0 | -100,00 | 0 | |||||
| 2026-01-16 | 13F | Ronald Blue Trust, Inc. | 0 | -100,00 | 0 | |||||
| 2026-02-14 | 13F | Rockefeller Capital Management L.P. | 950 | 0,00 | 56 | -6,78 | ||||
| 2026-02-13 | 13F | Squarepoint Ops LLC | Call | 7.600 | 0,00 | 446 | -5,72 | |||
| 2026-02-13 | 13F | Thomas J. Herzfeld Advisors, Inc. | 600 | 0,00 | 35 | -5,41 | ||||
| 2026-02-10 | 13F | Bnp Paribas Arbitrage, Sa | 0 | -100,00 | 0 | |||||
| 2025-11-14 | 13F | Camarda Financial Advisors, LLC | 0 | -100,00 | 0 | -100,00 | ||||
| 2026-02-13 | 13F | Marshall Wace, Llp | 812 | 48 | ||||||
| 2026-02-13 | 13F | Marshall Wace, Llp | Put | 5.400 | 317 | |||||
| 2026-02-13 | 13F | Flow Traders U.s. Llc | 11.618 | -11,97 | 1 | |||||
| 2026-01-12 | 13F | DAVENPORT & Co LLC | 0 | -100,00 | 0 | |||||
| 2026-01-16 | 13F | Pacific Sage Partners, LLC | 0 | -100,00 | 0 | |||||
| 2026-02-13 | 13F | Morgan Stanley | 109.924 | -11,77 | 6.449 | -16,79 | ||||
| 2025-11-07 | 13F | Pnc Financial Services Group, Inc. | 0 | -100,00 | 0 |
Other Listings
| US:FXY | 57,54 $ |