Grundlæggende statistik
| Institutionelle aktier (lange) | 17.967.655 - 63,76% (ex 13D/G) - change of -4,28MM shares -28,99% MRQ |
| Institutionel værdi (lang) | $ 434.535 USD ($1000) |
Institutionelt ejerskab og aktionærer
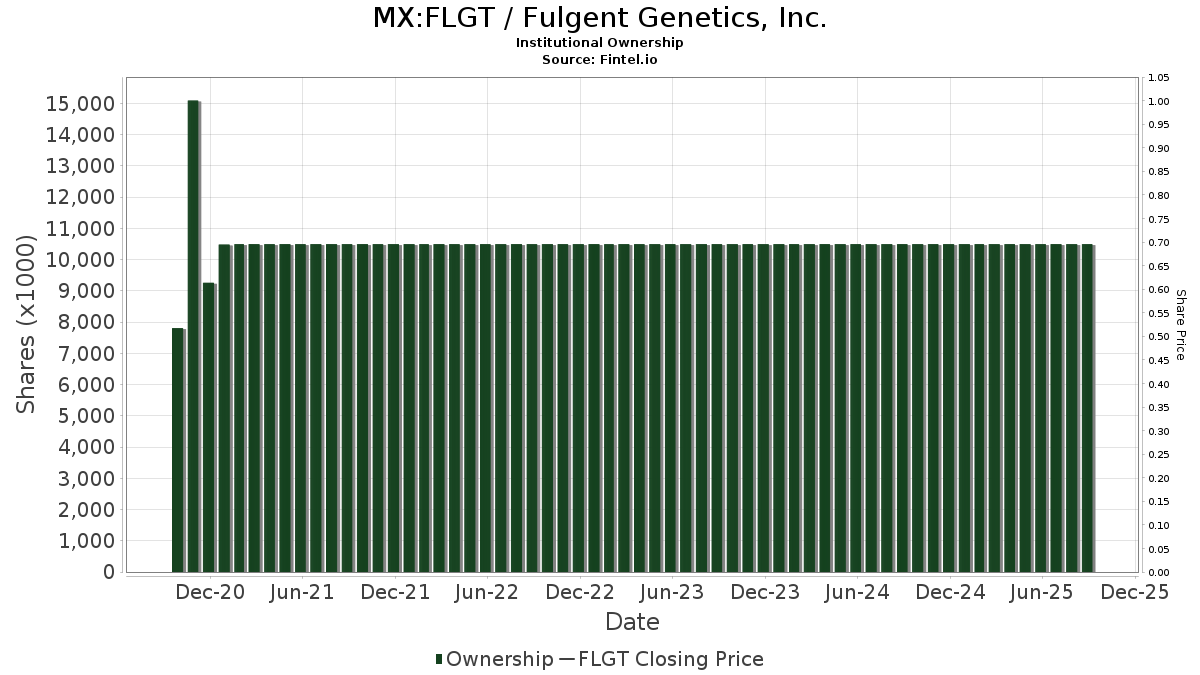
Fulgent Genetics, Inc. (MX:FLGT) har 186 institutionelle ejere og aktionærer, der har indsendt 13D/G- eller 13F-formularer til Securities Exchange Commission (SEC). Disse institutioner har i alt 17,967,655 aktier. Største aktionærer omfatter BlackRock, Inc., Vanguard Group Inc, Acadian Asset Management Llc, Millennium Management Llc, Dimensional Fund Advisors Lp, Rtw Investments, Lp, D. E. Shaw & Co., Inc., Geode Capital Management, Llc, Ameriprise Financial Inc, and State Street Corp .
Fulgent Genetics, Inc. (BMV:FLGT) institutionel ejerskabsstruktur viser aktuelle positioner i virksomheden efter institutioner og fonde, samt seneste ændringer i positionsstørrelse. Større aktionærer kan omfatte individuelle investorer, investeringsforeninger, hedgefonde eller institutioner. Skema 13D angiver, at investoren besidder (eller besidder) mere end 5 % af virksomheden og har til hensigt (eller har til hensigt at) aktivt at forfølge en ændring i forretningsstrategi. Skema 13G indikerer en passiv investering på over 5%.
Fondens stemningsscore
Fund Sentiment Score (fka Ownership Accumulation Score) finder de aktier, der bliver mest købt af fonde. Det er resultatet af en sofistikeret, multi-faktor kvantitativ model, der identificerer virksomheder med de højeste niveauer af institutionel akkumulering. Scoringsmodellen bruger en kombination af den samlede stigning i oplyste ejere, ændringerne i porteføljeallokeringer i disse ejere og andre målinger. Tallet går fra 0 til 100, hvor højere tal indikerer et højere niveau af akkumulering for sine jævnaldrende, og 50 er gennemsnittet.
Opdateringsfrekvens: Dagligt
Se Ownership Explorer, som giver en liste over højest rangerende virksomheder.
AI+ Ask Fintel’s AI assistant about Fulgent Genetics, Inc..
Select a question to share a public post with an AI-crafted answer.
Thinking of good questions…
13F og NPORT arkivering
Detaljer om 13F-arkivering er gratis. Detaljer om NP-ansøgninger kræver et premium-medlemskab. Grønne rækker angiver nye positioner. Røde rækker angiver lukkede positioner. Klik på linket ikon for at se den fulde transaktionshistorik.
Opgrader
for at låse premium-data op og eksportere til Excel ![]() .
.
| Fil dato | Kilde | Investor | Type | Gennemsnitlig pris (Øst) |
Aktier | Δ Aktier (%) |
Rapporteret Værdi ($1000) |
Δ Værdi (%) |
Port Alloc (%) |
|
|---|---|---|---|---|---|---|---|---|---|---|
| 2026-02-13 | 13F/A | Texas Permanent School Fund | 0 | -100,00 | 0 | |||||
| 2026-02-11 | 13F | Parallel Advisors, LLC | 1.240 | 7,83 | 33 | 28,00 | ||||
| 2026-02-12 | 13F | SWAN Capital LLC | 66 | 2 | ||||||
| 2026-02-09 | 13F | Legal & General Group Plc | 20.956 | -0,33 | 551 | 15,79 | ||||
| 2026-02-12 | 13F | Campbell & CO Investment Adviser LLC | 27.014 | 25,12 | 710 | 45,59 | ||||
| 2026-02-13 | 13F | Rhumbline Advisers | 28.663 | -12,95 | 753 | 1,08 | ||||
| 2026-04-21 | 13F | PharVision Advisers, LLC | 0 | -100,00 | 0 | |||||
| 2026-02-05 | 13F | Center for Financial Planning, Inc. | 20 | 0,00 | 1 | |||||
| 2026-02-17 | 13F | Two Sigma Investments, Lp | 297.355 | 88,67 | 7.812 | 119,35 | ||||
| 2026-02-17 | 13F | Jones Financial Companies Lllp | 441 | 42,72 | 12 | 83,33 | ||||
| 2026-02-12 | 13F | Wealthspire Advisors, LLC | 0 | -100,00 | 0 | |||||
| 2026-02-13 | 13F | BNP Paribas Asset Management Holding S.A. | 500 | 10,62 | 0 | |||||
| 2026-02-13 | 13F | Ubs Asset Management Americas Inc | 100.296 | 74,91 | 2.635 | 103,40 | ||||
| 2026-02-17 | 13F | Algert Global Llc | 13.695 | 0 | ||||||
| 2025-11-14 | 13F | Wolverine Trading, Llc | 0 | -100,00 | 0 | -100,00 | ||||
| 2026-02-17 | 13F | Magnetar Financial LLC | 12.206 | 321 | ||||||
| 2025-11-14 | 13F | Balyasny Asset Management Llc | 0 | -100,00 | 0 | |||||
| 2026-02-09 | 13F | Huntington National Bank | 601 | 0,00 | 16 | 15,38 | ||||
| 2025-11-12 | 13F | Group One Trading, L.p. | 0 | -100,00 | 0 | -100,00 | ||||
| 2026-04-13 | 13F | IFP Advisors, Inc | 86 | 0,00 | 1 | -50,00 | ||||
| 2026-02-04 | 13F | Virginia Retirement Systems Et Al | 25.613 | -8,89 | 673 | 5,83 | ||||
| 2025-11-06 | 13F | Ameritas Advisory Services, LLC | 0 | -100,00 | 0 | |||||
| 2026-02-17 | 13F | Amundi | 35.524 | 933 | ||||||
| 2026-02-18 | 13F | Caitlin John, LLC | 16 | 0,00 | 0 | |||||
| 2026-01-29 | 13F | IMC-Chicago, LLC | Call | 22.200 | 583 | |||||
| 2026-02-13 | 13F | Missouri Trust & Investment Co | 31 | 0,00 | 1 | |||||
| 2026-02-12 | 13F | BlackRock, Inc. | 2.962.234 | -0,44 | 77.818 | 15,72 | ||||
| 2026-02-17 | 13F | Brevan Howard Capital Management LP | 0 | -100,00 | 0 | |||||
| 2025-11-14 | 13F | Cubist Systematic Strategies, LLC | 122.750 | -21,78 | 2.774 | -11,06 | ||||
| 2026-02-06 | 13F | Copia Wealth Management | 10 | 0,00 | 0 | |||||
| 2026-02-12 | 13F | Jane Street Group, Llc | 149.988 | 18,08 | 3.940 | 37,28 | ||||
| 2026-02-10 | 13F | Intech Investment Management Llc | 9.261 | -10,21 | 243 | 4,29 | ||||
| 2026-02-12 | 13F | Triumph Capital Management | 4 | 0,00 | 0 | |||||
| 2026-02-17 | 13F | Tcw Group Inc | 128.400 | 0,00 | 3.373 | 16,27 | ||||
| 2026-02-12 | 13F | Jane Street Group, Llc | Call | 10.500 | -67,79 | 276 | -62,64 | |||
| 2026-01-23 | 13F | Inlight Wealth Management, LLC | 239 | -5,53 | 6 | 20,00 | ||||
| 2025-11-21 | 13F | Nebula Research & Development LLC | 0 | -100,00 | 0 | |||||
| 2026-02-17 | 13F | D. E. Shaw & Co., Inc. | 701.305 | 23,52 | 18.423 | 43,58 | ||||
| 2026-02-17 | 13F | Prelude Capital Management, Llc | 37.496 | -45,81 | 985 | -36,98 | ||||
| 2025-11-14 | 13F | Skopos Labs, Inc. | 0 | -100,00 | 0 | |||||
| 2026-02-17 | 13F | Canada Pension Plan Investment Board | 5.600 | 147 | ||||||
| 2026-01-28 | 13F | Universal- Beteiligungs- und Servicegesellschaft mbH | 12.320 | 324 | ||||||
| 2026-02-10 | 13F/A | Northwestern Mutual Wealth Management Co | 51 | 0,00 | 1 | 0,00 | ||||
| 2026-04-06 | 13F | GAMMA Investing LLC | 1.683 | -63,38 | 27 | -78,33 | ||||
| 2026-02-13 | 13F | Citigroup Inc | 595 | -87,69 | 16 | -86,24 | ||||
| 2026-02-11 | 13F | Ameritas Investment Partners, Inc. | 1.679 | 44 | ||||||
| 2026-02-11 | 13F | Group One Trading, L.p. | Put | 4.600 | 4,55 | 121 | 21,21 | |||
| 2026-02-12 | 13F | Swiss National Bank | 39.200 | 3,16 | 1.030 | 19,93 | ||||
| 2026-02-11 | 13F | Group One Trading, L.p. | Call | 87.400 | -44,44 | 2.296 | -35,42 | |||
| 2026-02-12 | 13F | Principal Securities, Inc. | 0 | -100,00 | 0 | |||||
| 2026-02-13 | 13F | Great West Life Assurance Co /can/ | 2.634 | 0,00 | 0 | |||||
| 2026-02-17 | 13F | Citadel Advisors Llc | Call | 18.100 | -77,57 | 475 | -73,94 | |||
| 2026-02-03 | 13F/A | Bank Of America Corp /de/ | Call | 0 | -100,00 | 0 | -100,00 | |||
| 2026-02-13 | 13F | Kilter Group LLC | 4 | 0 | ||||||
| 2026-04-14 | 13F | Tradewinds Capital Management, LLC | 100 | 0,00 | 2 | -50,00 | ||||
| 2026-04-23 | 13F | Private Wealth Management Group, LLC | 0 | -100,00 | 0 | |||||
| 2026-02-17 | 13F | Citadel Advisors Llc | 243.124 | -34,55 | 6.387 | -23,93 | ||||
| 2026-02-17 | 13F | Susquehanna International Group, Llp | Call | 51.500 | 109,35 | 1.353 | 143,60 | |||
| 2026-02-13 | 13F | Quarry LP | 537 | 14 | ||||||
| 2026-02-12 | 13F | MetLife Investment Management, LLC | 12.579 | 0,00 | 330 | 16,20 | ||||
| 2025-11-14 | 13F | Citadel Advisors Llc | Put | 0 | -100,00 | 0 | -100,00 | |||
| 2026-02-13 | 13F | Headlands Technologies LLC | 12.046 | 26,89 | 316 | 47,66 | ||||
| 2025-11-14 | 13F | Point72 Asia (Singapore) Pte. Ltd. | 15.351 | 0,22 | 347 | 13,82 | ||||
| 2025-11-14 | 13F | Point72 (DIFC) Ltd | 278 | 491,49 | 6 | |||||
| 2026-03-12 | 13F | Nalls Sherbakoff Group, Llc | 0 | -100,00 | 0 | |||||
| 2026-02-06 | 13F | Leonteq Securities AG | 43 | 0,00 | 1 | |||||
| 2026-02-19 | 13F | Invesco Ltd. | 62.005 | -10,40 | 1.629 | 4,16 | ||||
| 2026-02-13 | 13F | Barclays Plc | 172.286 | -3,68 | 4.526 | 11,95 | ||||
| 2026-02-20 | 13F | Sunbelt Securities, Inc. | 20 | 0,00 | 1 | |||||
| 2026-02-17 | 13F | Engineers Gate Manager LP | 16.994 | 24,09 | 446 | 44,34 | ||||
| 2026-01-29 | 13F | Comerica Bank | 17 | 0,00 | 0 | |||||
| 2026-02-10 | 13F | Hillsdale Investment Management Inc. | 290 | 8 | ||||||
| 2026-04-24 | 13F | UMA Financial Services, Inc. | 0 | -100,00 | 0 | |||||
| 2026-02-17 | 13F | Susquehanna International Group, Llp | 10.768 | -46,95 | 283 | -38,43 | ||||
| 2026-02-17 | 13F | Susquehanna International Group, Llp | Put | 18.900 | 497 | |||||
| 2026-02-11 | 13F | Franklin Resources Inc | 13.868 | 27,08 | 364 | 47,97 | ||||
| 2026-01-21 | 13F | Unison Advisors LLC | 8.757 | 230 | ||||||
| 2026-02-17 | 13F | Tower Research Capital LLC (TRC) | 1.380 | 62,16 | 36 | 89,47 | ||||
| 2026-01-12 | 13F | Kozak & Associates, Inc. | 0 | -100,00 | 0 | -100,00 | ||||
| 2025-11-05 | 13F | Bessemer Group Inc | 0 | -100,00 | 0 | |||||
| 2026-02-10 | 13F | Acadian Asset Management Llc | 1.185.890 | 4,01 | 31 | 24,00 | ||||
| 2026-02-11 | 13F | Allianz Asset Management GmbH | 133.474 | 46,89 | 3.506 | 70,77 | ||||
| 2026-02-11 | 13F | Los Angeles Capital Management Llc | 8.308 | 188 | ||||||
| 2026-02-12 | 13F | Steward Partners Investment Advisory, Llc | 0 | -100,00 | 0 | |||||
| 2026-02-06 | 13F | New Millennium Group LLC | 1 | 0 | ||||||
| 2026-02-17 | 13F | Boothbay Fund Management, Llc | 10.586 | -45,26 | 278 | -36,38 | ||||
| 2026-02-09 | 13F | Hartland & Co., LLC | 20 | 0,00 | 1 | |||||
| 2026-02-12 | 13F | EntryPoint Capital, LLC | 7.639 | -18,14 | 201 | -4,76 | ||||
| 2026-02-17 | 13F | Russell Investments Group, Ltd. | 78.031 | -21,65 | 2.056 | -8,01 | ||||
| 2026-02-09 | 13F | Geode Capital Management, Llc | 508.224 | 1,31 | 13.353 | 17,76 | ||||
| 2026-04-22 | 13F | Sterling Capital Management LLC | 699 | -41,36 | 11 | -64,52 | ||||
| 2026-02-14 | 13F | Rockefeller Capital Management L.P. | 100 | 0,00 | 3 | 0,00 | ||||
| 2026-04-17 | 13F | AdvisorNet Financial, Inc | 24 | 0,00 | 0 | |||||
| 2026-02-17 | 13F | Advisory Services Network, LLC | 0 | -100,00 | 0 | |||||
| 2025-11-07 | 13F | Shell Asset Management Co | 3.171 | -56,48 | 0 | |||||
| 2026-04-10 | 13F | Linden Thomas Advisory Services, LLC | 11.858 | 189 | ||||||
| 2025-11-14 | 13F | Polymer Capital Management (US) LLC | 0 | -100,00 | 0 | |||||
| 2026-02-10 | 13F | Rothschild Investment Llc | 20 | 0,00 | 1 | |||||
| 2026-02-17 | 13F | Advisor Group Holdings, Inc. | 1.712 | 2,82 | 45 | 18,92 | ||||
| 2026-02-06 | 13F | Pnc Financial Services Group, Inc. | 1.394 | -6,82 | 37 | 9,09 | ||||
| 2026-02-13 | 13F | Morgan Stanley | 315.253 | 13,99 | 8.282 | 32,50 | ||||
| 2026-04-24 | 13F | Vision Financial Markets Llc | 100 | 0,00 | 2 | -50,00 | ||||
| 2026-02-13 | 13F | American Century Companies Inc | 54.731 | -6,69 | 1.438 | 8,45 | ||||
| 2026-01-27 | 13F | Zurcher Kantonalbank (Zurich Cantonalbank) | 10.878 | 23,05 | 286 | 43,22 | ||||
| 2026-02-05 | 13F | Amalgamated Bank | 650 | -14,02 | 0 | |||||
| 2026-02-17 | 13F | Aquatic Capital Management LLC | 18.237 | -57,36 | 479 | -50,41 | ||||
| 2026-02-13 | 13F | Walleye Capital LLC | Call | 0 | -100,00 | 0 | ||||
| 2026-02-13 | 13F | Pinnacle Wealth Planning Services, Inc. | 59 | 2 | ||||||
| 2026-02-13 | 13F | Walleye Capital LLC | 0 | -100,00 | 0 | |||||
| 2026-01-26 | 13F | Whittier Trust Co | 411 | 0,00 | 11 | 11,11 | ||||
| 2026-02-10 | 13F | Bank of New York Mellon Corp | 84.747 | 7,16 | 2.226 | 24,57 | ||||
| 2026-02-13 | 13F | Police & Firemen's Retirement System of New Jersey | 5.079 | -23,39 | 133 | -10,74 | ||||
| 2026-01-29 | 13F | Vanguard Group Inc | 1.260.014 | 6,85 | 33.101 | 24,20 | ||||
| 2026-02-06 | 13F | Gsa Capital Partners Llp | 20.287 | -75,10 | 1 | -100,00 | ||||
| 2026-04-20 | 13F | Inscription Capital, LLC | 12.395 | 197 | ||||||
| 2026-02-17 | 13F | Creative Planning | 53.735 | 4,77 | 1.412 | 21,74 | ||||
| 2026-02-03 | 13F | SBI Securities Co., Ltd. | 1.131 | 1,80 | 30 | 16,00 | ||||
| 2026-02-13 | 13F | Parkside Financial Bank & Trust | 26 | 0,00 | 1 | |||||
| 2026-02-17 | 13F | Oxford Asset Management Llp | 9.673 | 254 | ||||||
| 2026-02-12 | 13F | Quadrant Capital Group Llc | 2.058 | 0,00 | 54 | 17,39 | ||||
| 2026-02-12 | 13F | Counterpoint Mutual Funds LLC | 19.250 | 506 | ||||||
| 2025-10-30 | 13F | Twin Peaks Wealth Advisors, LLC | 0 | -100,00 | 0 | -100,00 | ||||
| 2025-11-12 | 13F | Simplex Trading, Llc | 0 | -100,00 | 0 | |||||
| 2026-02-17 | 13F | Jump Financial, LLC | 20.701 | -48,70 | 544 | -40,46 | ||||
| 2026-02-09 | 13F | Quest Partners LLC | 39.521 | 57,93 | 1.038 | 83,72 | ||||
| 2026-02-17 | 13F | Qube Research & Technologies Ltd | 286.511 | 236,84 | 7.527 | 291,57 | ||||
| 2026-01-30 | 13F | R Squared Ltd | 9.504 | -14,09 | 250 | -0,40 | ||||
| 2026-04-10 | 13F | Abound Wealth Management | 56 | 0,00 | 1 | -100,00 | ||||
| 2026-04-20 | 13F | Ronald Blue Trust, Inc. | 63 | 1 | ||||||
| 2026-02-06 | 13F | Covestor Ltd | 58 | -41,41 | 0 | |||||
| 2025-11-14 | 13F | Raymond James Financial Inc | 0 | -100,00 | 0 | -100,00 | ||||
| 2026-02-12 | 13F | Advisors Asset Management, Inc. | 8.485 | 2.205,71 | 223 | 2.675,00 | ||||
| 2026-02-13 | 13F | Transamerica Financial Advisors, Inc. | 9 | 0,00 | 0 | |||||
| 2026-04-07 | 13F | Farther Finance Advisors, LLC | 225 | -83,20 | 4 | -91,43 | ||||
| 2025-11-14 | 13F | Aigen Investment Management, Lp | 0 | -100,00 | 0 | |||||
| 2026-02-13 | 13F | National Bank Of Canada /fi/ | 178 | -69,73 | 5 | -69,23 | ||||
| 2026-02-13 | 13F | State Street Corp | 493.664 | -1,66 | 12.969 | 14,31 | ||||
| 2026-01-30 | 13F | Us Bancorp \de\ | 519 | 6,35 | 14 | 18,18 | ||||
| 2026-02-10 | 13F | Goldman Sachs Group Inc | 348.533 | 89,42 | 9.156 | 120,18 | ||||
| 2026-02-11 | 13F | Brandywine Global Investment Management, LLC | 125.210 | -3,62 | 3.289 | 12,06 | ||||
| 2026-02-17 | 13F | Portolan Capital Management, LLC | 169.590 | 4.455 | ||||||
| 2026-02-17 | 13F | Rtw Investments, Lp | 705.027 | 18.521 | ||||||
| 2025-11-12 | 13F | Teachers Retirement System Of The State Of Kentucky | 0 | -100,00 | 0 | |||||
| 2026-04-07 | 13F | CoreCap Advisors, LLC | 50 | 0,00 | 1 | -100,00 | ||||
| 2026-02-17 | 13F | Ancora Advisors, LLC | 8.100 | 213 | ||||||
| 2025-11-12 | 13F/A | Norges Bank | 0 | -100,00 | 0 | |||||
| 2026-02-12 | 13F | Renaissance Technologies Llc | 82.864 | 2.177 | ||||||
| 2025-11-14 | 13F | ExodusPoint Capital Management, LP | 0 | -100,00 | 0 | |||||
| 2025-11-14 | 13F | Wolverine Trading, Llc | Call | 11.200 | 250 | |||||
| 2026-02-06 | 13F | EverSource Wealth Advisors, LLC | 191 | -11,16 | 5 | 25,00 | ||||
| 2026-02-18 | 13F | GWM Advisors LLC | 225 | 0,00 | 6 | 0,00 | ||||
| 2026-01-15 | 13F | Nisa Investment Advisors, Llc | 471 | -27,09 | 12 | -14,29 | ||||
| 2026-02-17 | 13F | Fmr Llc | 3.981 | -64,78 | 105 | -59,22 | ||||
| 2026-02-10 | 13F | Connor, Clark & Lunn Investment Management Ltd. | 374.825 | 13,06 | 9.847 | 31,42 | ||||
| 2026-02-17 | 13F | Aster Capital Management (DIFC) Ltd | 46 | 1 | ||||||
| 2026-02-06 | 13F | Larson Financial Group LLC | 27 | 0,00 | 1 | |||||
| 2026-02-13 | 13F | Verition Fund Management LLC | 26.087 | -10,98 | 685 | 3,47 | ||||
| 2026-02-12 | 13F | Federated Hermes, Inc. | 47.102 | 1,19 | 1.237 | 17,59 | ||||
| 2026-02-12 | 13F | Alps Advisors Inc | 25.386 | 74,61 | 667 | 103,05 | ||||
| 2026-02-04 | 13F | Atlantic Union Bankshares Corp | 59 | 2 | ||||||
| 2026-02-11 | 13F | Fox Run Management, L.l.c. | 8.992 | 236 | ||||||
| 2026-02-10 | 13F | Quantbot Technologies LP | 41 | -98,47 | 1 | -98,33 | ||||
| 2026-02-17 | 13F | Trexquant Investment LP | 140.735 | -18,35 | 3.697 | -5,08 | ||||
| 2026-02-12 | 13F | Federation des caisses Desjardins du Quebec | 110 | 0,00 | 3 | 0,00 | ||||
| 2026-02-12 | 13F | Hrt Financial Lp | 124.223 | 16,88 | 3 | 50,00 | ||||
| 2026-02-12 | 13F | Dimensional Fund Advisors Lp | 889.012 | -21,54 | 23.355 | -8,80 | ||||
| 2026-04-24 | 13F | Strs Ohio | 0 | -100,00 | 0 | |||||
| 2026-01-28 | 13F | Klp Kapitalforvaltning As | 4.300 | 38,71 | 113 | 60,00 | ||||
| 2026-02-17 | 13F | Almitas Capital LLC | 18.478 | -13,97 | 485 | 0,00 | ||||
| 2026-02-03 | 13F | International Assets Investment Management, Llc | 32 | 1 | ||||||
| 2026-02-17 | 13F | Alliancebernstein L.p. | 18.457 | -20,64 | 485 | -7,81 | ||||
| 2026-02-10 | 13F | Easterly Investment Partners Llc | 0 | -100,00 | 0 | |||||
| 2026-02-17 | 13F | Tudor Investment Corp Et Al | 116.048 | 3.049 | ||||||
| 2026-01-30 | 13F | Bogart Wealth, LLC | 0 | -100,00 | 0 | |||||
| 2026-02-13 | 13F | Sei Investments Co | 74.552 | 0,20 | 1.958 | 16,48 | ||||
| 2026-04-24 | 13F | Root Financial Partners, LLC | 9 | 0 | ||||||
| 2026-01-14 | 13F | Hennion & Walsh Asset Management, Inc. | 66.190 | 1.739 | ||||||
| 2026-02-13 | 13F | Squarepoint Ops LLC | 56.202 | 14,03 | 1.476 | 32,61 | ||||
| 2026-02-17 | 13F | Two Sigma Advisers, Lp | 193.500 | 124,22 | 5.083 | 160,67 | ||||
| 2026-01-27 | 13F | TD Waterhouse Canada Inc. | 100 | 3 | ||||||
| 2026-01-30 | 13F | Torren Management, LLC | 23 | 1 | ||||||
| 2026-03-20 | 13F/A | Hsbc Holdings Plc | 52.056 | -32,67 | 1.369 | -21,19 | ||||
| 2026-02-11 | 13F | Simplex Trading, Llc | Put | 11.500 | 5.650,00 | 302 | ||||
| 2026-02-11 | 13F | Simplex Trading, Llc | Call | 52.600 | -68,12 | 1.382 | 45.933,33 | |||
| 2026-02-17 | 13F | Quantinno Capital Management LP | 28.960 | 12,19 | 761 | 30,36 | ||||
| 2026-02-13 | 13F | Smartleaf Asset Management LLC | 298 | 30,70 | 8 | 40,00 | ||||
| 2026-03-03 | 13F/A | Caitong International Asset Management Co., Ltd | 1.834 | 214,58 | 48 | 269,23 | ||||
| 2026-02-17 | 13F | Bank Of America Corp /de/ | 152.902 | -2,14 | 4.017 | 13,74 | ||||
| 2026-02-11 | 13F | Strategic Advocates LLC | 534 | -14,15 | 14 | 0,00 | ||||
| 2026-02-17 | 13F | Price T Rowe Associates Inc /md/ | 22.413 | 7,28 | 1 | |||||
| 2026-01-29 | 13F | UBS Group AG | 83.559 | 288,85 | 2.195 | 352,58 | ||||
| 2026-01-28 | 13F | Peapod Lane Capital LLC | 165.781 | 0,73 | 4.355 | 17,10 | ||||
| 2026-02-13 | 13F | MAI Capital Management | 48 | 0,00 | 1 | 0,00 | ||||
| 2026-02-17 | 13F | California State Teachers Retirement System | 18.248 | -1,38 | 479 | 14,59 | ||||
| 2026-02-13 | 13F | Panagora Asset Management Inc | 18.988 | 0,00 | 499 | 16,08 | ||||
| 2026-02-05 | 13F | Allworth Financial LP | 72 | 0,00 | 2 | 0,00 | ||||
| 2026-02-13 | 13F | Wells Fargo & Company/mn | 120.781 | 261,06 | 3.173 | 319,58 | ||||
| 2026-02-13 | 13F | Kestra Advisory Services, LLC | 1.347 | 35 | ||||||
| 2026-02-17 | 13F | XTX Topco Ltd | 22.195 | 33,13 | 583 | 55,05 | ||||
| 2026-02-17 | 13F | MIRAE ASSET GLOBAL ETFS HOLDINGS Ltd. | 23.882 | -1,87 | 627 | 14,00 | ||||
| 2026-04-06 | 13F | Versant Capital Management, Inc | 2.691 | 84,69 | 43 | 10,53 | ||||
| 2026-02-13 | 13F | SRS Capital Advisors, Inc. | 125 | -79,44 | 3 | -76,92 | ||||
| 2026-04-03 | 13F | Adirondack Trust Co | 860 | 0,00 | 14 | -40,91 | ||||
| 2026-01-21 | 13F | Prime Capital Investment Advisors, LLC | 10.185 | 0,00 | 268 | 16,09 | ||||
| 2026-02-17 | 13F | Point72 Asset Management, L.P. | 236.954 | -36,18 | 6.225 | -25,82 | ||||
| 2025-11-14 | 13F | Credit Agricole S A | 0 | -100,00 | 0 | |||||
| 2026-01-21 | 13F | Flagship Harbor Advisors, Llc | 2.120 | 56 | ||||||
| 2026-02-17 | 13F | Northern Trust Corp | 178.825 | -10,96 | 4.698 | 3,50 | ||||
| 2026-04-16 | 13F | SG Americas Securities, LLC | 18.356 | 0,08 | 0 | |||||
| 2026-02-11 | 13F | Deutsche Bank Ag\ | 438.996 | -12,98 | 11.532 | 1,15 | ||||
| 2026-02-17 | 13F | Susquehanna Portfolio Strategies, LLC | 38.480 | 13,44 | 1.011 | 31,85 | ||||
| 2025-11-14 | 13F | Invenomic Capital Management LP | 0 | -100,00 | 0 | -100,00 | ||||
| 2026-02-13 | 13F | Caxton Associates Llp | 0 | -100,00 | 0 | |||||
| 2026-02-17 | 13F | Atom Investors LP | 0 | -100,00 | 0 | |||||
| 2026-01-26 | 13F | Main Street Group, LTD | 0 | -100,00 | 0 | |||||
| 2026-02-13 | 13F | Charles Schwab Investment Management Inc | 402.802 | 12,11 | 10.582 | 30,32 | ||||
| 2026-01-26 | 13F | Cwm, Llc | 259 | 5,28 | 0 | |||||
| 2026-02-12 | 13F | Nuveen, LLC | 331.643 | 14,02 | 8.712 | 32,54 | ||||
| 2026-02-17 | 13F | Schonfeld Strategic Advisors LLC | 30.503 | 801 | ||||||
| 2026-02-17 | 13F | Millennium Management Llc | 939.375 | -36,05 | 24.677 | -25,66 | ||||
| 2026-02-17 | 13F | Ameriprise Financial Inc | 499.511 | 0,92 | 13.122 | 17,32 | ||||
| 2026-01-23 | 13F | Avion Wealth | 56 | 0,00 | 0 | |||||
| 2026-02-10 | 13F | Bnp Paribas Arbitrage, Sa | 30.259 | -78,50 | 795 | -75,03 | ||||
| 2026-02-11 | 13F | Jpmorgan Chase & Co | 250.128 | -16,35 | 6.571 | -2,77 | ||||
| 2026-02-13 | 13F | Diametric Capital, LP | 200.160 | -17,16 | 5.258 | -3,70 | ||||
| 2026-02-12 | 13F | New York State Common Retirement Fund | 8.173 | 0,00 | 215 | 16,30 | ||||
| 2026-02-17 | 13F | Public Employees Retirement System Of Ohio | 1.017 | -12,85 | 27 | 0,00 | ||||
| 2026-02-11 | 13F | Rise Advisors, LLC | 0 | -100,00 | 0 | |||||
| 2026-02-18 | 13F | Mackenzie Financial Corp | 12.026 | -1,06 | 318 | 15,69 | ||||
| 2026-04-07 | 13F | Signaturefd, Llc | 596 | -73,21 | 9 | -84,48 | ||||
| 2026-02-17 | 13F | Royal Bank Of Canada | 1.301 | 5,69 | 35 | 25,00 |