Grundlæggende statistik
| Institutionelle aktier (lange) | 40.618.971 - 54,94% (ex 13D/G) - change of -10,10MM shares -19,91% MRQ |
| Institutionel værdi (lang) | $ 213.814 USD ($1000) |
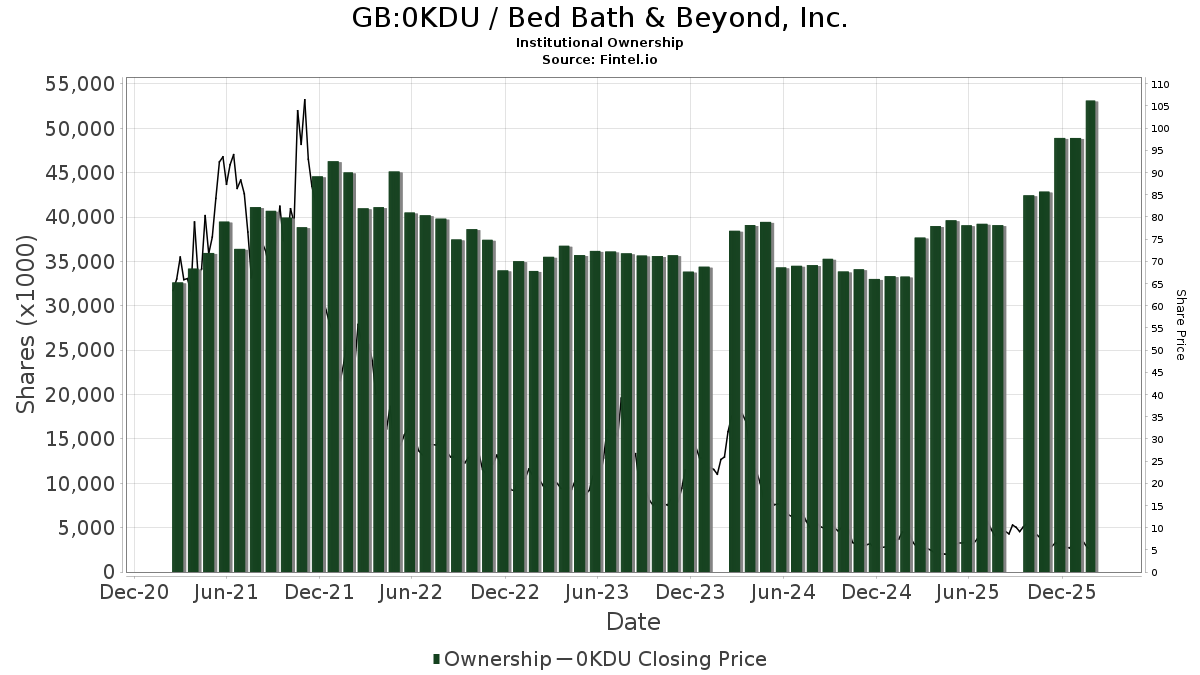
Institutionelt ejerskab og aktionærer
Bed Bath & Beyond, Inc. (GB:0KDU) har 187 institutionelle ejere og aktionærer, der har indsendt 13D/G- eller 13F-formularer til Securities Exchange Commission (SEC). Disse institutioner har i alt 40,618,971 aktier. Største aktionærer omfatter Toroso Investments, LLC, Vanguard Group Inc, BlackRock, Inc., Morgan Stanley, Geode Capital Management, Llc, Goldman Sachs Group Inc, State Street Corp, Lee Danner & Bass Inc, Federated Hermes, Inc., and Qube Research & Technologies Ltd .
Bed Bath & Beyond, Inc. (LSE:0KDU) institutionel ejerskabsstruktur viser aktuelle positioner i virksomheden efter institutioner og fonde, samt seneste ændringer i positionsstørrelse. Større aktionærer kan omfatte individuelle investorer, investeringsforeninger, hedgefonde eller institutioner. Skema 13D angiver, at investoren besidder (eller besidder) mere end 5 % af virksomheden og har til hensigt (eller har til hensigt at) aktivt at forfølge en ændring i forretningsstrategi. Skema 13G indikerer en passiv investering på over 5%.
The share price as of April 30, 2026 is 4,99 / share. Previously, on May 5, 2025, the share price was 3,86 / share. This represents an increase of 29,27% over that period.
Fondens stemningsscore
Fund Sentiment Score (fka Ownership Accumulation Score) finder de aktier, der bliver mest købt af fonde. Det er resultatet af en sofistikeret, multi-faktor kvantitativ model, der identificerer virksomheder med de højeste niveauer af institutionel akkumulering. Scoringsmodellen bruger en kombination af den samlede stigning i oplyste ejere, ændringerne i porteføljeallokeringer i disse ejere og andre målinger. Tallet går fra 0 til 100, hvor højere tal indikerer et højere niveau af akkumulering for sine jævnaldrende, og 50 er gennemsnittet.
Opdateringsfrekvens: Dagligt
Se Ownership Explorer, som giver en liste over højest rangerende virksomheder.
AI+ Ask Fintel’s AI assistant about Bed Bath & Beyond, Inc..
Select a question to share a public post with an AI-crafted answer.
Thinking of good questions…
13F og NPORT arkivering
Detaljer om 13F-arkivering er gratis. Detaljer om NP-ansøgninger kræver et premium-medlemskab. Grønne rækker angiver nye positioner. Røde rækker angiver lukkede positioner. Klik på linket ikon for at se den fulde transaktionshistorik.
Opgrader
for at låse premium-data op og eksportere til Excel ![]() .
.
| Fil dato | Kilde | Investor | Type | Gennemsnitlig pris (Øst) |
Aktier | Δ Aktier (%) |
Rapporteret Værdi ($1000) |
Δ Værdi (%) |
Port Alloc (%) |
|
|---|---|---|---|---|---|---|---|---|---|---|
| 2026-04-22 | 13F | Sterling Capital Management LLC | 2.273 | -42,51 | 11 | -52,38 | ||||
| 2026-04-29 | 13F | Skopos Labs, Inc. | 10.844 | 50 | ||||||
| 2026-02-06 | 13F | EverSource Wealth Advisors, LLC | 0 | -100,00 | 0 | |||||
| 2026-01-29 | 13F | IMC-Chicago, LLC | 41.329 | -46,45 | 226 | -70,20 | ||||
| 2026-02-11 | 13F | Fox Run Management, L.l.c. | 40.514 | 221 | ||||||
| 2026-02-17 | 13F | Shay Capital LLC | 459.553 | 36,87 | 2.509 | -23,67 | ||||
| 2026-04-21 | 13F | Maseco Llp | 0 | -100,00 | 0 | |||||
| 2026-02-17 | 13F | Shay Capital LLC | Call | 130.000 | -41,57 | 710 | -67,45 | |||
| 2026-04-23 | 13F | SJS Investment Consulting Inc. | 16 | 0 | ||||||
| 2026-02-10 | 13F | Axq Capital, Lp | 62.092 | 339 | ||||||
| 2026-02-17 | 13F | potrero capital research llc | 0 | -100,00 | 0 | |||||
| 2026-04-07 | 13F | CoreCap Advisors, LLC | 1.108 | 0,00 | 5 | -16,67 | ||||
| 2026-04-06 | 13F | GAMMA Investing LLC | 693 | 8,28 | 3 | 0,00 | ||||
| 2025-11-14 | 13F | Sig Brokerage, Lp | 0 | -100,00 | 0 | |||||
| 2025-11-14 | 13F | Wolverine Trading, Llc | Put | 212.500 | 142,86 | 1.961 | 236,36 | |||
| 2026-02-17 | 13F | Two Sigma Investments, Lp | 361.162 | -70,54 | 1.972 | -83,58 | ||||
| 2025-11-14 | 13F | Marex Group plc | 0 | -100,00 | 0 | -100,00 | ||||
| 2026-02-13 | 13F | MAI Capital Management | 50 | 0,00 | 0 | |||||
| 2026-02-13 | 13F | SPX Equities Gestao de Recursos Ltda | 0 | -100,00 | 0 | |||||
| 2025-11-05 | 13F | Hantz Financial Services, Inc. | 0 | -100,00 | 0 | |||||
| 2026-02-17 | 13F | Raymond James Financial Inc | 84.465 | 32,46 | 461 | -26,12 | ||||
| 2026-02-17 | 13F | Cetera Investment Advisers | 209.714 | 4,57 | 1.145 | -41,67 | ||||
| 2025-11-14 | 13F | Wolverine Trading, Llc | 142.817 | 153,78 | 1.318 | 251,47 | ||||
| 2025-12-15 | 13F | FNY Investment Advisers, LLC | Call | 0 | -100,00 | 0 | ||||
| 2025-11-14 | 13F | Wolverine Trading, Llc | Call | 237.600 | 16,87 | 2.193 | 61,73 | |||
| 2026-02-17 | 13F | Canada Pension Plan Investment Board | 34.500 | 6.800,00 | 188 | 4.600,00 | ||||
| 2026-02-19 | 13F | Invesco Ltd. | 54.181 | -54,51 | 296 | -74,70 | ||||
| 2025-11-14 | 13F | Balyasny Asset Management Llc | 0 | -100,00 | 0 | |||||
| 2026-01-29 | 13F | UBS Group AG | 618.127 | 146,25 | 3.375 | 37,32 | ||||
| 2026-02-13 | 13F | Pamplona Capital Management, LLC | 330.655 | 0,00 | 1.805 | -44,24 | ||||
| 2026-02-17 | 13F | California State Teachers Retirement System | 4.222 | 22,59 | 23 | -30,30 | ||||
| 2026-01-08 | 13F | Gryphon Financial Partners LLC | 270.709 | 0,00 | 1.478 | -44,23 | ||||
| 2025-11-14 | 13F | Gotham Asset Management, LLC | 0 | -100,00 | 0 | |||||
| 2026-02-10 | 13F | Intech Investment Management Llc | 35.453 | -13,92 | 194 | -52,11 | ||||
| 2026-04-15 | 13F | Fortitude Family Office, LLC | 413 | -28,05 | 2 | -66,67 | ||||
| 2026-02-13 | 13F | Rhumbline Advisers | 95.815 | 662,55 | 523 | 325,20 | ||||
| 2026-04-24 | 13F | Root Financial Partners, LLC | 2.001 | 6,72 | 9 | -10,00 | ||||
| 2026-04-21 | 13F | Refined Wealth Management | 422.565 | 1,25 | 1.961 | -13,96 | ||||
| 2026-02-17 | 13F | Capital Fund Management S.a. | 107.230 | 585 | ||||||
| 2026-01-30 | 13F | Us Bancorp \de\ | 1.043 | 1.369,01 | 6 | |||||
| 2026-02-12 | 13F | Federation des caisses Desjardins du Quebec | 165 | 0,00 | 1 | -100,00 | ||||
| 2026-01-26 | 13F | Cwm, Llc | 2.092 | 16,61 | 0 | |||||
| 2026-02-17 | 13F | Jones Financial Companies Lllp | 6.783 | 237,80 | 37 | 105,56 | ||||
| 2026-04-24 | 13F | Private Advisor Group, LLC | 14.145 | -1,43 | 66 | -16,67 | ||||
| 2026-02-17 | 13F | XTX Topco Ltd | 20.465 | -60,98 | 112 | -78,36 | ||||
| 2025-11-14 | 13F | Point72 (DIFC) Ltd | 2.264 | -87,73 | 22 | -82,54 | ||||
| 2026-02-04 | 13F | Versor Investments LP | 42.500 | 232 | ||||||
| 2026-02-13 | 13F | SRS Capital Advisors, Inc. | 230 | -66,18 | 1 | -83,33 | ||||
| 2025-11-14 | 13F | Corton Capital Inc. | 0 | -100,00 | 0 | |||||
| 2026-02-17 | 13F | Aqr Capital Management Llc | 0 | -100,00 | 0 | |||||
| 2025-11-14 | 13F | Strategic Wealth Partners, Ltd. | 158 | 0,00 | 2 | 0,00 | ||||
| 2025-11-14 | 13F | Zacks Investment Management | 0 | -100,00 | 0 | |||||
| 2026-02-13 | 13F | Minot DeBlois Advisors LLC | 10 | 0,00 | 0 | |||||
| 2026-01-23 | 13F | Assetmark, Inc | 81 | 0,00 | 0 | |||||
| 2026-01-29 | 13F | D.a. Davidson & Co. | 0 | -100,00 | 0 | |||||
| 2026-02-17 | 13F | Advisory Services Network, LLC | 41.325 | -14,38 | 226 | -52,33 | ||||
| 2026-02-17 | 13F | Susquehanna International Group, Llp | Put | 212.600 | -6,88 | 1.161 | -48,10 | |||
| 2026-02-17 | 13F | Susquehanna International Group, Llp | Call | 712.900 | -41,25 | 3.892 | -67,24 | |||
| 2026-02-12 | 13F | Renaissance Technologies Llc | 533.178 | 2.911 | ||||||
| 2026-04-13 | 13F | Clayton Financial Group LLC | 9 | 0,00 | 0 | |||||
| 2026-01-28 | 13F | Geneos Wealth Management Inc. | 651 | 0,00 | 4 | -50,00 | ||||
| 2026-02-17 | 13F | Susquehanna International Group, Llp | 359.416 | 1.962 | ||||||
| 2026-02-23 | 13F | Virtu Financial LLC | 40.556 | 0 | ||||||
| 2026-02-09 | 13F | Huntington National Bank | 368 | 0,00 | 2 | -33,33 | ||||
| 2026-02-13 | 13F | Resources Investment Advisors, LLC. | 23.706 | 4,65 | 129 | -41,63 | ||||
| 2026-02-12 | 13F | Counterpoint Mutual Funds LLC | 0 | -100,00 | 0 | |||||
| 2026-02-10 | 13F | Acadian Asset Management Llc | 358.747 | 659,41 | 2 | |||||
| 2026-02-13 | 13F | Walleye Capital LLC | Put | 100 | -99,71 | 1 | -100,00 | |||
| 2026-02-11 | 13F | Los Angeles Capital Management Llc | 40.035 | 137,31 | 306 | 85,45 | ||||
| 2026-02-12 | 13F | State Board Of Administration Of Florida Retirement System | 12.900 | 0,00 | 70 | -44,44 | ||||
| 2026-02-13 | 13F | Walleye Capital LLC | 1 | -99,98 | 0 | -100,00 | ||||
| 2026-02-13 | 13F | Walleye Capital LLC | Call | 65.600 | -14,02 | 358 | -52,01 | |||
| 2026-02-17 | 13F | Public Employees Retirement System Of Ohio | 6.762 | -3,51 | 37 | -47,06 | ||||
| 2026-01-29 | 13F | D.a. Davidson & Co. | Call | 0 | -100,00 | 0 | ||||
| 2026-04-24 | 13F | UMA Financial Services, Inc. | 2.631 | 0,00 | 12 | -14,29 | ||||
| 2026-02-13 | 13F | K2 Principal Fund, L.p. | Call | 0 | -100,00 | 0 | ||||
| 2026-02-17 | 13F | Caption Management, LLC | 0 | -100,00 | 0 | -100,00 | ||||
| 2025-11-17 | 13F/A | Dark Forest Capital Management Lp | 0 | -100,00 | 0 | -100,00 | ||||
| 2026-04-14 | 13F | Wealthcare Advisory Partners LLC | 13.911 | -4,91 | 65 | -18,99 | ||||
| 2026-02-11 | 13F | Ameritas Investment Partners, Inc. | 4.596 | 25 | ||||||
| 2026-02-17 | 13F | Sender Co & Partners, Inc. | 0 | -100,00 | 0 | |||||
| 2026-02-17 | 13F | Fmr Llc | 3.004 | 4,67 | 16 | -42,86 | ||||
| 2026-02-17 | 13F | Northern Trust Corp | 504.418 | 13,30 | 2.754 | -36,81 | ||||
| 2026-04-29 | 13F | Police & Firemen's Retirement System of New Jersey | 15.947 | 0,00 | 74 | -16,09 | ||||
| 2026-01-29 | 13F | Quent Capital, LLC | 0 | -100,00 | 0 | |||||
| 2026-02-17 | 13F | Lotus Technology Management, LP | 218.937 | 1.195 | ||||||
| 2026-01-20 | 13F | SOA Wealth Advisors, LLC. | 58 | 0,00 | 0 | |||||
| 2026-02-17 | 13F | Engineers Gate Manager LP | 11.555 | 63 | ||||||
| 2026-02-12 | 13F | Voya Investment Management Llc | 11.352 | 10,09 | 62 | -39,00 | ||||
| 2026-02-10 | 13F/A | Northwestern Mutual Wealth Management Co | 510 | 2.733,33 | 3 | |||||
| 2026-02-13 | 13F | Stifel Financial Corp | 256.242 | 6,99 | 1.399 | -40,32 | ||||
| 2026-02-13 | 13F | Charles Schwab Investment Management Inc | 571.873 | 20,67 | 3.122 | -32,70 | ||||
| 2026-02-20 | 13F | Sunbelt Securities, Inc. | 2.702 | -8,65 | 15 | -50,00 | ||||
| 2025-11-14 | 13F | Symmetry Investments LP | Call | 0 | -100,00 | 0 | -100,00 | |||
| 2025-11-14 | 13F | Squarepoint Ops LLC | Put | 0 | -100,00 | 0 | -100,00 | |||
| 2026-04-13 | 13F | Stockman Wealth Management, Inc. | 10.000 | 0,00 | 46 | -14,81 | ||||
| 2026-02-13 | 13F | Pingora Partners LLC | 8.300 | 0,00 | 45 | -44,44 | ||||
| 2026-02-17 | 13F | Qube Research & Technologies Ltd | 840.801 | 150,86 | 4.591 | 39,90 | ||||
| 2025-11-14 | 13F | Ionic Capital Management LLC | 0 | -100,00 | 0 | -100,00 | ||||
| 2026-04-30 | 13F | Nuveen, LLC | 347.637 | -84,93 | 1.613 | -87,19 | ||||
| 2025-11-14 | 13F | Quarry LP | 0 | -100,00 | 0 | |||||
| 2026-02-17 | 13F | Bank Of America Corp /de/ | 207.764 | 123,67 | 1.134 | 24,75 | ||||
| 2025-11-03 | 13F | TD Waterhouse Canada Inc. | 0 | -100,00 | 0 | |||||
| 2026-04-24 | 13F | Able Wealth Management LLC | 0 | -100,00 | 0 | |||||
| 2026-02-13 | 13F | National Bank Of Canada /fi/ | 938 | 11,14 | 5 | -37,50 | ||||
| 2026-02-17 | 13F | Wiley Bros.-aintree Capital, Llc | 18.144 | 99 | ||||||
| 2026-03-13 | 13F | Lane Brothers & Co Inc | 26.000 | 142 | ||||||
| 2026-04-07 | 13F | Farther Finance Advisors, LLC | 777 | 24,52 | 4 | 0,00 | ||||
| 2026-04-08 | 13F | Parkside Investments, LLC | 50.000 | 0,00 | 232 | -15,02 | ||||
| 2026-02-17 | 13F | Quantinno Capital Management LP | 12.802 | 70 | ||||||
| 2026-02-17 | 13F | Boothbay Fund Management, Llc | 109.567 | 598 | ||||||
| 2026-02-13 | 13F | Caxton Associates Llp | 0 | -100,00 | 0 | -100,00 | ||||
| 2026-04-22 | 13F | Patriot Financial Group Insurance Agency, LLC | 49.012 | 113,70 | 227 | 81,60 | ||||
| 2026-04-13 | 13F | True Wealth Design, LLC | 46 | 0 | ||||||
| 2026-02-13 | 13F | Caitong International Asset Management Co., Ltd | 1.069 | -54,70 | 6 | -78,26 | ||||
| 2026-02-17 | 13F/A | Cantor Fitzgerald, L. P. | 0 | -100,00 | 0 | -100,00 | ||||
| 2026-04-06 | 13F | Versant Capital Management, Inc | 922 | 4 | ||||||
| 2025-11-13 | 13F | Clear Street Markets Llc | 0 | -100,00 | 0 | |||||
| 2026-01-26 | 13F | Main Street Group, LTD | 0 | -100,00 | 0 | |||||
| 2025-11-14 | 13F | Murchinson Ltd. | 0 | -100,00 | 0 | |||||
| 2026-02-17 | 13F | Citadel Advisors Llc | Put | 269.300 | -15,05 | 1.470 | -52,63 | |||
| 2026-04-21 | 13F/A | Corsair Capital Management, L.p. | 0 | -100,00 | 0 | |||||
| 2026-02-10 | 13F | Connor, Clark & Lunn Investment Management Ltd. | 301.888 | 1.648 | ||||||
| 2026-02-17 | 13F | Safe Harbor Fiduciary, LLC | 1.544 | -77,44 | 8 | -82,98 | ||||
| 2026-02-17 | 13F | Citadel Advisors Llc | 146.934 | -87,33 | 802 | -92,94 | ||||
| 2026-02-13 | 13F | Barclays Plc | Put | 0 | -100,00 | 0 | -100,00 | |||
| 2026-02-17 | 13F | Citadel Advisors Llc | Call | 296.400 | 47,68 | 1.618 | -17,62 | |||
| 2026-02-17 | 13F | Russell Investments Group, Ltd. | 37.554 | 548,94 | 205 | 266,07 | ||||
| 2026-02-06 | 13F | Copia Wealth Management | 991 | 10,23 | 5 | -37,50 | ||||
| 2026-02-13 | 13F | Arrowstreet Capital, Limited Partnership | 0 | -100,00 | 0 | |||||
| 2026-02-17 | 13F | Capital Fund Management S.a. | Call | 124.200 | 0,00 | 678 | -44,20 | |||
| 2026-02-17 | 13F | Trexquant Investment LP | 55.101 | 301 | ||||||
| 2026-02-13 | 13F | Wells Fargo & Company/mn | 89.011 | 58,82 | 486 | -11,50 | ||||
| 2026-02-10 | 13F | Rothschild Investment Llc | 3 | 0 | ||||||
| 2026-04-28 | 13F | Lee Danner & Bass Inc | 1.062.450 | 2.187,30 | 4.930 | 1.848,22 | ||||
| 2025-11-14 | 13F | Fund 1 Investments, LLC | 0 | -100,00 | 0 | |||||
| 2026-04-28 | 13F | Bogart Wealth, LLC | 3.000 | 14 | ||||||
| 2026-01-29 | 13F | Concurrent Investment Advisors, LLC | 35.739 | 32,79 | 195 | -25,86 | ||||
| 2026-01-28 | 13F | DekaBank Deutsche Girozentrale | 1.975 | 0,00 | 0 | |||||
| 2026-02-12 | 13F | Jane Street Group, Llc | 803.379 | -71,71 | 4.386 | -84,22 | ||||
| 2026-02-17 | 13F | MIRAE ASSET GLOBAL ETFS HOLDINGS Ltd. | 55.815 | 5,89 | 305 | -41,09 | ||||
| 2026-02-12 | 13F | Jane Street Group, Llc | Put | 45.200 | -64,72 | 247 | -80,38 | |||
| 2026-02-12 | 13F | Jane Street Group, Llc | Call | 73.700 | 5,14 | 402 | -41,40 | |||
| 2026-02-11 | 13F | Group One Trading, L.p. | 11.906 | -92,62 | 65 | -95,89 | ||||
| 2026-02-09 | 13F | Cypress Capital Management LLC (WY) | 2 | 0,00 | 0 | |||||
| 2026-02-09 | 13F | Quest Partners LLC | 21.636 | -10,69 | 118 | -50,21 | ||||
| 2026-02-17 | 13F | Jump Financial, LLC | 57.995 | 317 | ||||||
| 2026-02-10 | 13F | Bnp Paribas Arbitrage, Sa | 16.974 | -95,25 | 93 | -97,37 | ||||
| 2026-02-17 | 13F | Banco Bilbao Vizcaya Argentaria, S.a. | 0 | -100,00 | 0 | |||||
| 2026-02-10 | 13F | Bank of New York Mellon Corp | 175.404 | 12,30 | 958 | -37,41 | ||||
| 2026-01-23 | 13F | Rsm Us Wealth Management Llc | 12.327 | 68 | ||||||
| 2026-02-13 | 13F | Sei Investments Co | 65.733 | -2,72 | 359 | -45,84 | ||||
| 2026-04-08 | 13F | Sax Wealth Advisors, Llc | 19.793 | 0,00 | 108 | 0,00 | ||||
| 2026-02-12 | 13F | CIBC Private Wealth Group, LLC | 9 | 0,00 | 0 | |||||
| 2025-11-07 | 13F | Shell Asset Management Co | 0 | -100,00 | 0 | |||||
| 2026-04-24 | 13F | ProShare Advisors LLC | 510.233 | -15,33 | 2.367 | -28,05 | ||||
| 2026-02-02 | 13F | Oppenheimer & Co Inc | 0 | -100,00 | 0 | |||||
| 2026-04-14 | 13F | Tradewinds Capital Management, LLC | 190 | 0,00 | 1 | -100,00 | ||||
| 2026-02-12 | 13F | New York State Common Retirement Fund | 8.656 | 0,00 | 47 | -44,05 | ||||
| 2026-02-13 | 13F | Colony Group, LLC | 0 | -100,00 | 0 | |||||
| 2026-02-17 | 13F | Gladstone Institutional Advisory LLC | 70.408 | 8,46 | 384 | -39,53 | ||||
| 2026-04-07 | 13F | Signaturefd, Llc | 25.712 | 2.571.100,00 | 119 | |||||
| 2026-02-17 | 13F | Tudor Investment Corp Et Al | 413.103 | 18,86 | 2.256 | -33,72 | ||||
| 2026-02-13 | 13F | Verition Fund Management LLC | 557.613 | 547,24 | 3.045 | 261,09 | ||||
| 2026-02-09 | 13F | Royce & Associates Lp | 710.035 | -1,38 | 3.877 | -45,01 | ||||
| 2026-02-05 | 13F | Allworth Financial LP | 880 | 95,12 | 5 | 0,00 | ||||
| 2026-02-03 | 13F | Fire Capital Management LLC | 147.209 | 0,00 | 804 | -44,27 | ||||
| 2026-02-17 | 13F | State Of Wisconsin Investment Board | 59.090 | 323 | ||||||
| 2026-01-29 | 13F | Concurrent Investment Advisors, LLC | Call | 0 | -100,00 | 0 | -100,00 | |||
| 2026-03-31 | 13F/A | Barclays Plc | Call | 0 | -100,00 | 0 | -100,00 | |||
| 2026-02-12 | 13F | Polen Capital Management Llc | 0 | -100,00 | 0 | |||||
| 2026-02-06 | 13F | Pnc Financial Services Group, Inc. | 2.582 | 138,63 | 14 | 40,00 | ||||
| 2026-02-13 | 13F | Manufacturers Life Insurance Company, The | 20.847 | 11,76 | 114 | -37,91 | ||||
| 2026-02-17 | 13F | nVerses Capital, LLC | 12.860 | 70 | ||||||
| 2026-02-23 | 13F | Leonteq Securities AG | 0 | -100,00 | 0 | |||||
| 2026-02-06 | 13F | Larson Financial Group LLC | 12 | 0 | ||||||
| 2026-02-05 | 13F | Amalgamated Bank | 2.155 | 44,83 | 0 | |||||
| 2026-02-09 | 13F | Geode Capital Management, Llc | 1.627.794 | 24,70 | 8.890 | -30,46 | ||||
| 2026-02-13 | 13F | Morgan Stanley | 2.438.552 | 61,81 | 13.314 | -9,75 | ||||
| 2026-02-11 | 13F | Jpmorgan Chase & Co | 40.292 | -92,11 | 220 | -95,62 | ||||
| 2025-11-14 | 13F | Squarepoint Ops LLC | 0 | -100,00 | 0 | -100,00 | ||||
| 2026-02-06 | 13F | Cedar Wealth Management, LLC | 3.881 | -84,85 | 21 | -91,60 | ||||
| 2026-02-13 | 13F | Walleye Trading LLC | Call | 167.200 | 54,81 | 913 | -13,72 | |||
| 2026-02-13 | 13F | Walleye Trading LLC | 33.716 | -60,50 | 184 | -77,96 | ||||
| 2026-02-13 | 13F | Walleye Trading LLC | Put | 153.600 | -35,24 | 839 | -63,91 | |||
| 2026-04-28 | 13F | Golden State Wealth Management, LLC | 496 | 0,00 | 2 | 0,00 | ||||
| 2026-02-13 | 13F | Marathon Trading Investment Management LLC | 11.000 | 60 | ||||||
| 2026-02-17 | 13F | Optiver Holding B.V. | 382 | -41,77 | 2 | -66,67 | ||||
| 2026-02-17 | 13F | Advisor Group Holdings, Inc. | 163.651 | -13,39 | 894 | -47,96 | ||||
| 2026-02-11 | 13F | LPL Financial LLC | 141.492 | -31,92 | 773 | -62,05 | ||||
| 2026-02-12 | 13F | MetLife Investment Management, LLC | 38.899 | 19,51 | 212 | -33,33 | ||||
| 2026-02-14 | 13F | Rockefeller Capital Management L.P. | 13.000 | 0,00 | 71 | -44,88 | ||||
| 2026-02-11 | 13F | Winton Capital Group Ltd | 37.500 | 205 | ||||||
| 2026-02-13 | 13F | Citigroup Inc | 10.100 | 234,66 | 55 | 89,66 | ||||
| 2026-04-21 | 13F | J.E. Simmons & Co., P.C. | 23.034 | 15,17 | 105 | -4,59 | ||||
| 2026-04-16 | 13F | SG Americas Securities, LLC | 35.505 | -63,25 | 0 | |||||
| 2026-02-12 | 13F | Steward Partners Investment Advisory, Llc | 1.877 | 0,00 | 10 | -44,44 | ||||
| 2026-02-02 | 13F | Wolverine Asset Management Llc | 228 | 1 | ||||||
| 2026-04-14 | 13F | Moisand Fitzgerald Tamayo, LLC | 64 | 0,00 | 0 | |||||
| 2025-11-12 | 13F/A | Norges Bank | 0 | -100,00 | 0 | -100,00 | ||||
| 2026-02-09 | 13F | Legal & General Group Plc | 6.136 | 22,52 | 34 | -32,65 | ||||
| 2026-02-13 | 13F | Diametric Capital, LP | 94.344 | 32,68 | 515 | -26,01 | ||||
| 2026-02-17 | 13F | Tower Research Capital LLC (TRC) | 2.128 | -9,06 | 12 | -50,00 | ||||
| 2026-02-12 | 13F | Cornerstone Capital, Inc. | 0 | -100,00 | 0 | |||||
| 2026-02-17 | 13F | Cantor Fitzgerald, L. P. | Call | 47.500 | 18,75 | 259 | -33,76 | |||
| 2026-02-12 | 13F | Federated Hermes, Inc. | 866.319 | 47,73 | 4.730 | -17,60 | ||||
| 2026-02-13 | 13F | State Street Corp | 1.314.053 | 24,75 | 7.175 | -30,43 | ||||
| 2026-02-12 | 13F | BlackRock, Inc. | 4.875.498 | 16,76 | 26.620 | -34,88 | ||||
| 2025-11-12 | 13F | Ameriflex Group, Inc. | 0 | -100,00 | 0 | |||||
| 2026-02-17 | 13F | Oxford Asset Management Llp | 14.839 | 81 | ||||||
| 2026-04-23 | 13F | Game Plan Financial Advisors, LLC | 2.000 | -33,33 | 9 | -43,75 | ||||
| 2025-11-21 | 13F | Nebula Research & Development LLC | 0 | -100,00 | 0 | |||||
| 2026-02-13 | 13F | Barclays Plc | 108.932 | 36,80 | 595 | -23,75 | ||||
| 2026-04-28 | 13F | PUREfi Wealth, LLC | 27.000 | 28,57 | 125 | 9,65 | ||||
| 2026-01-30 | 13F | Sigma Planning Corp | 0 | -100,00 | 0 | |||||
| 2026-01-29 | 13F | Vanguard Group Inc | 5.251.382 | 40,71 | 28.673 | -21,53 | ||||
| 2025-11-14 | 13F | Point72 Asia (Singapore) Pte. Ltd. | 1.168 | 11 | ||||||
| 2026-04-23 | 13F | WMG Financial Advisors, LLC | 101.700 | 9,53 | 472 | -6,92 | ||||
| 2025-11-14 | 13F | Ionic Capital Management LLC | Put | 0 | -100,00 | 0 | -100,00 | |||
| 2026-02-11 | 13F | Deutsche Bank Ag\ | 55.537 | 23,01 | 303 | -31,29 | ||||
| 2026-02-17 | 13F | Css Llc/il | Put | 10.000 | 55 | |||||
| 2026-02-17 | 13F | Css Llc/il | 1.000 | 5 | ||||||
| 2025-11-14 | 13F | Cubist Systematic Strategies, LLC | 57.731 | -45,00 | 565 | -21,75 | ||||
| 2026-02-06 | 13F | Covestor Ltd | Call | 0 | 0 | |||||
| 2026-02-12 | 13F | Penserra Capital Management LLC | 462.171 | 3 | ||||||
| 2026-02-13 | 13F | Marshall Wace, Llp | 0 | -100,00 | 0 | |||||
| 2026-02-17 | 13F | Polymer Capital Management (US) LLC | 77.324 | -20,47 | 422 | -55,63 | ||||
| 2025-11-13 | 13F | Total Investment Management Inc | 0 | -100,00 | 0 | |||||
| 2026-02-11 | 13F | Parallel Advisors, LLC | 506 | 0,00 | 3 | -50,00 | ||||
| 2026-02-17 | 13F | Alliancebernstein L.p. | 39.800 | 0,00 | 217 | -44,22 | ||||
| 2026-02-13 | 13F | Hudson Bay Capital Management LP | 0 | -100,00 | 0 | |||||
| 2026-02-12 | 13F | Haven Private, LLC | 20.835 | 0,36 | 114 | -44,33 | ||||
| 2026-04-21 | 13F | Claro Advisors LLC | 50.401 | 4,73 | 234 | -11,07 | ||||
| 2026-01-16 | 13F | Trust Co Of Vermont | 1.575 | 0,00 | 9 | -46,67 | ||||
| 2026-02-06 | 13F | Covestor Ltd | 8 | 0,00 | 0 | |||||
| 2026-02-12 | 13F | Dimensional Fund Advisors Lp | 606.321 | 39,06 | 3.311 | -22,39 | ||||
| 2026-02-13 | 13F | Toroso Investments, LLC | Call | 7.600 | 153,33 | 41 | 41,38 | |||
| 2026-02-17 | 13F | Two Sigma Advisers, Lp | 28.700 | -96,71 | 157 | -98,17 | ||||
| 2026-01-16 | 13F | FNY Investment Advisers, LLC | 0 | -100,00 | 0 | |||||
| 2026-02-13 | 13F | Gts Securities Llc | 16.189 | 88 | ||||||
| 2026-04-03 | 13F | Investors Research Corp | 27 | 0,00 | 0 | |||||
| 2026-02-13 | 13F | Toroso Investments, LLC | 5.749.350 | 26,08 | 31.391 | -29,68 | ||||
| 2025-11-25 | 13F | Briaud Financial Planning, Inc | 0 | -100,00 | 0 | |||||
| 2026-02-17 | 13F | Prelude Capital Management, Llc | 50.524 | 108,75 | 276 | 16,53 | ||||
| 2025-11-12 | 13F | Headlands Technologies LLC | 0 | -100,00 | 0 | |||||
| 2026-02-13 | 13F | Jacobs Levy Equity Management, Inc | 131.763 | 719 | ||||||
| 2025-11-12 | 13F | Harbour Investments, Inc. | 0 | -100,00 | 0 | |||||
| 2025-12-02 | 13F | IFP Advisors, Inc | 0 | 5 | ||||||
| 2025-11-14 | 13F | Millennium Management Llc | Call | 0 | -100,00 | 0 | -100,00 | |||
| 2026-02-17 | 13F | One68 Global Capital, LLC | 20.000 | 109 | ||||||
| 2026-02-13 | 13F | Quinn Opportunity Partners LLC | 0 | -100,00 | 0 | -100,00 | ||||
| 2026-04-28 | 13F | SBI Securities Co., Ltd. | 1.361 | -22,71 | 6 | -33,33 | ||||
| 2026-02-13 | 13F | Public Employees Retirement Association Of Colorado | 5.453 | 0,00 | 0 | |||||
| 2026-02-17 | 13F | Schonfeld Strategic Advisors LLC | 108.885 | 595 | ||||||
| 2026-02-17 | 13F | Atom Investors LP | 74.771 | 179,86 | 408 | 56,32 | ||||
| 2026-02-17 | 13F | Ameriprise Financial Inc | 97.779 | -90,27 | 534 | -94,58 | ||||
| 2026-04-30 | 13F | Nisa Investment Advisors, Llc | 394 | -87,27 | 2 | -93,75 | ||||
| 2026-02-17 | 13F | Royal Bank Of Canada | 88.952 | 3.473,80 | 485 | 1.920,83 | ||||
| 2026-02-13 | 13F | Entropy Technologies, LP | 29.483 | 161 | ||||||
| 2026-02-10 | 13F | Goldman Sachs Group Inc | 1.417.232 | 781,49 | 7.738 | 391,61 | ||||
| 2026-02-17 | 13F | Millennium Management Llc | 44.852 | -94,69 | 245 | -97,05 | ||||
| 2026-02-06 | 13F | Gsa Capital Partners Llp | 168.525 | 1 | ||||||
| 2026-04-21 | 13F | Wedbush Securities Inc | 63.033 | -41,71 | 0 | |||||
| 2026-02-06 | 13F | HighTower Advisors, LLC | 85.993 | 26,21 | 470 | -29,69 | ||||
| 2026-02-17 | 13F | Price T Rowe Associates Inc /md/ | 55.180 | 6,67 | 0 | |||||
| 2026-02-18 | 13F | GWM Advisors LLC | 0 | -100,00 | 0 |