Grundlæggende statistik
| Institutionelle ejere | 90 total, 88 long only, 0 short only, 2 long/short - change of -14,95% MRQ |
| Del pris | 16,77 |
| Gennemsnitlig porteføljeallokering | 0.1376 % - change of -3,58% MRQ |
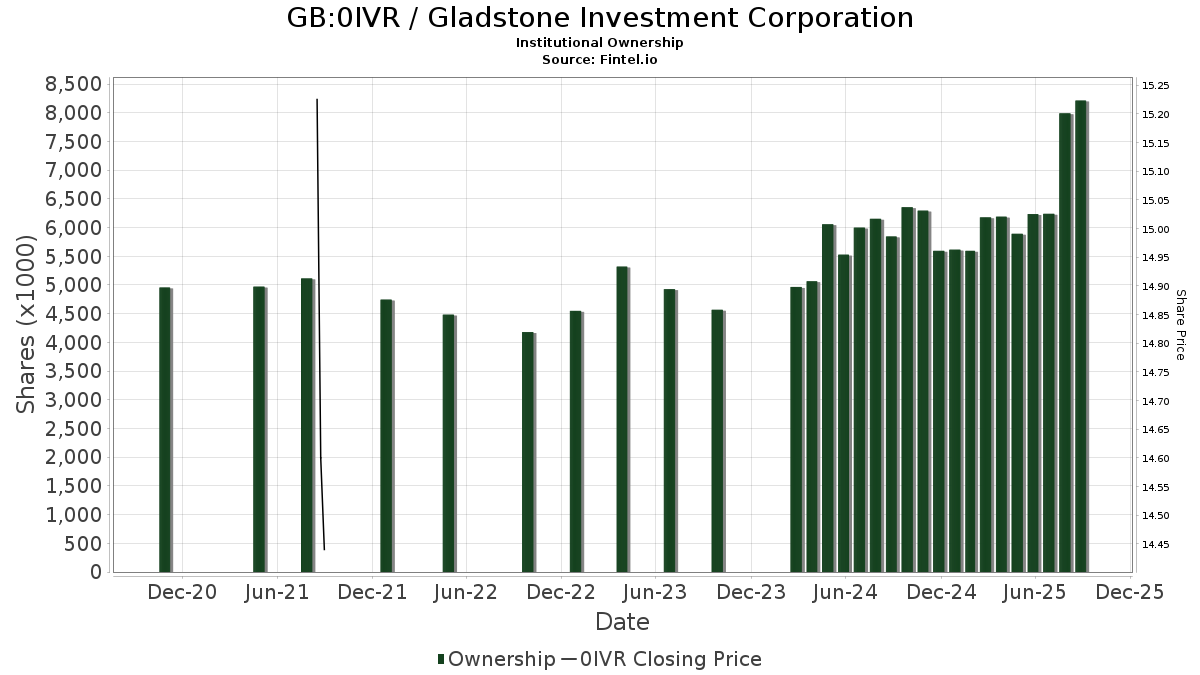
| Institutionelle aktier (lange) | 6.590.280 (ex 13D/G) - change of -0,92MM shares -12,19% MRQ |
| Institutionel værdi (lang) | $ 79.509 USD ($1000) |
Institutionelt ejerskab og aktionærer
Gladstone Investment Corporation (GB:0IVR) har 90 institutionelle ejere og aktionærer, der har indsendt 13D/G- eller 13F-formularer til Securities Exchange Commission (SEC). Disse institutioner har i alt 6,590,280 aktier. Største aktionærer omfatter Melia Wealth LLC, Van Eck Associates Corp, UBS Group AG, Morgan Stanley, BlackRock, Inc., PFG Advisors, Legal & General Group Plc, Outfitter Financial LLC, LPL Financial LLC, and Two Sigma Investments, Lp .
Gladstone Investment Corporation (LSE:0IVR) institutionel ejerskabsstruktur viser aktuelle positioner i virksomheden efter institutioner og fonde, samt seneste ændringer i positionsstørrelse. Større aktionærer kan omfatte individuelle investorer, investeringsforeninger, hedgefonde eller institutioner. Skema 13D angiver, at investoren besidder (eller besidder) mere end 5 % af virksomheden og har til hensigt (eller har til hensigt at) aktivt at forfølge en ændring i forretningsstrategi. Skema 13G indikerer en passiv investering på over 5%.
The share price as of May 1, 2026 is 16,77 / share. Previously, on May 2, 2025, the share price was 13,98 / share. This represents an increase of 19,97% over that period.
Fondens stemningsscore
Fund Sentiment Score (fka Ownership Accumulation Score) finder de aktier, der bliver mest købt af fonde. Det er resultatet af en sofistikeret, multi-faktor kvantitativ model, der identificerer virksomheder med de højeste niveauer af institutionel akkumulering. Scoringsmodellen bruger en kombination af den samlede stigning i oplyste ejere, ændringerne i porteføljeallokeringer i disse ejere og andre målinger. Tallet går fra 0 til 100, hvor højere tal indikerer et højere niveau af akkumulering for sine jævnaldrende, og 50 er gennemsnittet.
Opdateringsfrekvens: Dagligt
Se Ownership Explorer, som giver en liste over højest rangerende virksomheder.
AI+ Ask Fintel’s AI assistant about Gladstone Investment Corporation.
Select a question to share a public post with an AI-crafted answer.
Thinking of good questions…
13F og NPORT arkivering
Detaljer om 13F-arkivering er gratis. Detaljer om NP-ansøgninger kræver et premium-medlemskab. Grønne rækker angiver nye positioner. Røde rækker angiver lukkede positioner. Klik på linket ikon for at se den fulde transaktionshistorik.
Opgrader
for at låse premium-data op og eksportere til Excel ![]() .
.
| Fil dato | Kilde | Investor | Type | Gennemsnitlig pris (Øst) |
Aktier | Δ Aktier (%) |
Rapporteret Værdi ($1000) |
Δ Værdi (%) |
Port Alloc (%) |
|
|---|---|---|---|---|---|---|---|---|---|---|
| 2026-01-26 | 13F | Mirae Asset Global Investments Co., Ltd. | 14.000 | 0,00 | 196 | 1,04 | ||||
| 2025-11-14 | 13F | Oxford Asset Management Llp | 17.727 | 245 | ||||||
| 2026-01-30 | 13F | Us Bancorp \de\ | 46 | 1 | ||||||
| 2026-02-13 | 13F | Citigroup Inc | 805 | 7.950,00 | 11 | |||||
| 2026-02-12 | 13F | Advisors Asset Management, Inc. | 94.780 | -16,74 | 1.324 | -15,83 | ||||
| 2026-02-13 | 13F | Global Strategic Management Inc | 39.032 | -74,13 | 1 | -100,00 | ||||
| 2025-11-14 | 13F | Hrt Financial Lp | 0 | -100,00 | 0 | |||||
| 2026-01-27 | 13F | WealthCollab, LLC | 145 | 2 | ||||||
| 2026-02-13 | 13F | Morgan Stanley | 335.654 | 5,57 | 4.689 | 6,74 | ||||
| 2026-04-27 | 13F | Sound Income Strategies, LLC | 10.740 | 0,00 | 154 | 1,99 | ||||
| 2026-02-17 | 13F | Cetera Investment Advisers | 30.936 | -7,33 | 432 | -6,29 | ||||
| 2026-02-13 | 13F | Van Eck Associates Corp | 798.954 | -6,53 | 11 | 0,00 | ||||
| 2026-04-23 | 13F | North Star Investment Management Corp. | 5.000 | 0,00 | 71 | 2,90 | ||||
| 2026-02-17 | 13F | Bank Of America Corp /de/ | 12.389 | 38,49 | 173 | 40,65 | ||||
| 2026-01-23 | 13F | Assetmark, Inc | 622 | 0,00 | 9 | 0,00 | ||||
| 2026-05-01 | 13F | International Assets Investment Management, Llc | 2.190 | 0,00 | 31 | 3,33 | ||||
| 2026-04-13 | 13F | Creative Financial Designs Inc /adv | 600 | 0,00 | 9 | 0,00 | ||||
| 2026-02-12 | 13F | BlackRock, Inc. | 319.773 | 1,32 | 4.467 | 2,43 | ||||
| 2026-02-12 | 13F | Quadrant Capital Group Llc | 37 | 0,00 | 1 | |||||
| 2025-11-14 | 13F | United Capital Financial Advisers, Llc | 0 | -100,00 | 0 | -100,00 | ||||
| 2026-02-13 | 13F | Mariner, LLC | 0 | -100,00 | 0 | |||||
| 2026-02-17 | 13F | Magnetar Financial LLC | 0 | -100,00 | 0 | |||||
| 2026-01-26 | 13F | Prosperity Financial Group, Inc. | 16.000 | -17,53 | 224 | -16,79 | ||||
| 2026-02-09 | 13F | Harbour Investments, Inc. | 10 | 0,00 | 0 | |||||
| 2026-04-15 | 13F | DAVENPORT & Co LLC | 139.862 | 1,45 | 1.986 | 3,12 | ||||
| 2026-02-17 | 13F | NorthRock Partners, LLC | 10.262 | 143 | ||||||
| 2026-02-17 | 13F | Susquehanna International Group, Llp | Call | 0 | -100,00 | 0 | -100,00 | |||
| 2026-02-20 | 13F | Sunbelt Securities, Inc. | 704 | 1,73 | 10 | 0,00 | ||||
| 2025-11-14 | 13F | Virtu Financial LLC | 0 | -100,00 | 0 | |||||
| 2026-02-13 | 13F/A | Virtus ETF Advisers LLC | 0 | -100,00 | 0 | |||||
| 2026-02-19 | 13F | Invesco Ltd. | 54.224 | -8,79 | 758 | -7,80 | ||||
| 2026-04-15 | 13F | Valley National Advisers Inc | 150 | 0,00 | 0 | |||||
| 2026-02-11 | 13F | Jpmorgan Chase & Co | 6.915 | -4,61 | 97 | -4,00 | ||||
| 2026-02-17 | 13F | Two Sigma Advisers, Lp | 111.418 | 1.557 | ||||||
| 2026-02-18 | 13F | GWM Advisors LLC | 20.460 | 5,59 | 286 | 6,74 | ||||
| 2026-02-10 | 13F | Envestnet Asset Management Inc | 13.994 | -9,08 | 195 | -8,02 | ||||
| 2026-04-28 | 13F | Hardy Reed LLC | 11.300 | 1,73 | 160 | 3,23 | ||||
| 2026-04-15 | 13F | Exchange Traded Concepts, Llc | 0 | -100,00 | 0 | |||||
| 2026-04-17 | 13F | Kentucky Trust Co | 2.000 | 0,00 | 28 | 3,70 | ||||
| 2026-02-13 | 13F | Great West Life Assurance Co /can/ | 50.440 | 4,28 | 1 | |||||
| 2026-04-21 | 13F | Pflug Koory, LLC | 675 | 0,00 | 10 | 0,00 | ||||
| 2025-11-04 | 13F | Cornerstone Wealth Management, LLC | 0 | -100,00 | 0 | |||||
| 2026-02-17 | 13F | D. E. Shaw & Co., Inc. | 0 | -100,00 | 0 | |||||
| 2026-02-04 | 13F | Atlantic Union Bankshares Corp | 97.164 | -2,63 | 1.357 | -1,60 | ||||
| 2025-11-12 | 13F | Quantbot Technologies LP | 0 | -100,00 | 0 | |||||
| 2026-02-13 | 13F | Wells Fargo & Company/mn | 14.777 | 11,30 | 206 | 12,57 | ||||
| 2026-02-17 | 13F | Tower Research Capital LLC (TRC) | 2.046 | 271,32 | 29 | 300,00 | ||||
| 2026-01-29 | 13F | Comerica Bank | 950 | 0,00 | 13 | 0,00 | ||||
| 2026-05-01 | 13F | Fifth Third Bancorp | 1.049 | 15 | ||||||
| 2026-02-17 | 13F | Advisor Group Holdings, Inc. | 88.410 | 395,46 | 1.235 | 394,00 | ||||
| 2025-11-14 | 13F | Equitable Holdings, Inc. | 0 | -100,00 | 0 | -100,00 | ||||
| 2025-11-12 | 13F | Creekmur Asset Management LLC | 0 | 0 | ||||||
| 2026-02-12 | 13F | Jane Street Group, Llc | 14.005 | 196 | ||||||
| 2026-02-06 | 13F | Larson Financial Group LLC | 232 | 1,75 | 3 | 0,00 | ||||
| 2026-02-11 | 13F | Group One Trading, L.p. | Call | 0 | -100,00 | 0 | ||||
| 2026-02-13 | 13F | MAI Capital Management | 1.407 | 64,18 | 20 | 72,73 | ||||
| 2026-02-17 | 13F | Blair William & Co/il | 154.482 | -6,33 | 2.158 | -5,31 | ||||
| 2026-04-21 | 13F | Outfitter Financial LLC | 205.120 | 0,38 | 2.913 | 2,03 | ||||
| 2026-04-24 | 13F | Oakworth Capital, Inc. | 100 | 0,00 | 1 | 0,00 | ||||
| 2026-02-05 | 13F | Allworth Financial LP | 5.167 | 0,53 | 72 | 1,41 | ||||
| 2026-02-10 | 13F | State of Wyoming | 14.667 | -43,59 | 205 | -43,18 | ||||
| 2026-02-13 | 13F | Quarry LP | 0 | -100,00 | 0 | |||||
| 2026-01-28 | 13F | Geneos Wealth Management Inc. | 0 | -100,00 | 0 | -100,00 | ||||
| 2026-02-13 | 13F | Colony Group, LLC | 20.295 | 0,50 | 281 | 0,36 | ||||
| 2026-04-08 | 13F | Wealth Enhancement Advisory Services, Llc | 0 | -100,00 | 0 | |||||
| 2026-02-10 | 13F | Ritter Daniher Financial Advisory LLC / DE | 1.543 | 22 | ||||||
| 2026-04-09 | 13F | DHJJ Financial Advisors, Ltd. | 1.005 | 20.000,00 | 14 | |||||
| 2026-02-17 | 13F | Northern Trust Corp | 25.342 | -7,64 | 354 | -6,60 | ||||
| 2026-04-15 | 13F | Albert D Mason Inc | 67.936 | 1,65 | 965 | 3,32 | ||||
| 2026-04-20 | 13F | TrueMark Investments, LLC | 0 | -100,00 | 0 | |||||
| 2026-02-17 | 13F | Royal Bank Of Canada | 66.229 | 4,75 | 926 | 5,95 | ||||
| 2026-01-12 | 13F | Roble, Belko & Company, Inc | 0 | -100,00 | 0 | |||||
| 2026-02-06 | 13F | EverSource Wealth Advisors, LLC | 1.200 | 0,00 | 17 | 0,00 | ||||
| 2025-11-12 | 13F | Transce3nd, LLC | 0 | -100,00 | 0 | |||||
| 2026-01-16 | 13F | Crewe Advisors LLC | 766 | 0,00 | 11 | 0,00 | ||||
| 2026-04-29 | 13F | Garner Asset Management Corp | 34.493 | -4,96 | 490 | -3,55 | ||||
| 2026-04-07 | 13F | Signaturefd, Llc | 1.080 | 8,11 | 15 | 15,38 | ||||
| 2026-04-24 | 13F | Private Advisor Group, LLC | 14.628 | 2,40 | 208 | 4,02 | ||||
| 2026-02-09 | 13F | Melia Wealth LLC | 1.127.296 | -5,87 | 15.748 | -4,85 | ||||
| 2026-02-13 | 13F | National Bank Of Canada /fi/ | 2.000 | 100,00 | 28 | 107,69 | ||||
| 2026-02-17 | 13F | Raymond James Financial Inc | 49.736 | 13,16 | 695 | 14,33 | ||||
| 2026-02-17 | 13F | Millennium Management Llc | 0 | -100,00 | 0 | |||||
| 2026-02-17 | 13F | Ameriflex Group, Inc. | 19.308 | -54,40 | 270 | -54,02 | ||||
| 2026-02-17 | 13F | Susquehanna International Group, Llp | 30.742 | -19,30 | 429 | -18,44 | ||||
| 2026-02-17 | 13F | Susquehanna International Group, Llp | Put | 49.100 | -9,07 | 686 | -8,18 | |||
| 2026-02-11 | 13F | Parallel Advisors, LLC | 263 | 0,00 | 4 | 0,00 | ||||
| 2026-02-17 | 13F | Jones Financial Companies Lllp | 1.291 | 0,00 | 18 | 5,88 | ||||
| 2026-02-17 | 13F | Citadel Advisors Llc | Call | 37.400 | 17,98 | 522 | 19,18 | |||
| 2026-02-09 | 13F | Legal & General Group Plc | 273.752 | 23,01 | 3.833 | 24,62 | ||||
| 2026-02-12 | 13F | Commonwealth Equity Services, Llc | 28.396 | -8,69 | 397 | |||||
| 2026-04-15 | 13F | Register Financial Advisors LLC | 9.500 | 0,00 | 135 | 1,52 | ||||
| 2026-04-17 | 13F | United Advisor Group, LLC | 77.612 | 9,70 | 1.102 | 11,54 | ||||
| 2026-02-17 | 13F | Advisory Services Network, LLC | 0 | -100,00 | 0 | |||||
| 2026-04-28 | 13F | Abel Hall, LLC | 10.000 | 0,00 | 142 | 2,16 | ||||
| 2026-02-17 | 13F | Two Sigma Investments, Lp | 190.243 | 2.658 | ||||||
| 2026-02-13 | 13F | Verition Fund Management LLC | 0 | -100,00 | 0 | |||||
| 2026-02-17 | 13F | Aquatic Capital Management LLC | 3.562 | 50 | ||||||
| 2026-02-10 | 13F | Foundations Investment Advisors, LLC | 11.970 | -3,87 | 167 | -2,91 | ||||
| 2026-01-21 | 13F | Prime Capital Investment Advisors, LLC | 10.728 | -0,02 | 150 | 0,68 | ||||
| 2026-01-29 | 13F | UBS Group AG | 713.016 | 47,06 | 9.961 | 48,66 | ||||
| 2026-02-11 | 13F | LPL Financial LLC | 193.933 | -0,93 | 2.709 | 0,15 | ||||
| 2026-02-13 | 13F | Marshall Wace, Llp | 164.583 | -44,27 | 2.299 | -43,67 | ||||
| 2026-01-27 | 13F | PFG Advisors | 305.248 | 206,03 | 4.264 | 209,43 | ||||
| 2025-11-20 | 13F/A | BRYN MAWR TRUST Co | 0 | -100,00 | 0 | |||||
| 2026-02-12 | 13F | Steward Partners Investment Advisory, Llc | 3.000 | -16,67 | 42 | -16,33 | ||||
| 2026-04-22 | 13F | Janney Montgomery Scott LLC | 18.511 | -4,46 | 0 | |||||
| 2026-01-16 | 13F | Legacy Capital Wealth Partners, LLC | 111.329 | 10,00 | 1.555 | 11,23 | ||||
| 2026-01-30 | 13F | Caldwell Securities, Inc | 800 | 0,00 | 11 | 0,00 | ||||
| 2026-02-12 | 13F | Wealthspire Advisors, LLC | 0 | -100,00 | 0 | |||||
| 2026-02-13 | 13F | Baird Financial Group, Inc. | 90.801 | 0,00 | 1.268 | 1,12 | ||||
| 2026-02-17 | 13F | Virtus Investment Advisers, Inc. | 49.495 | -29,55 | 691 | -28,76 | ||||
| 2026-04-30 | 13F | Kestra Advisory Services, LLC | 0 | -100,00 | 0 | |||||
| 2026-04-07 | 13F | Farther Finance Advisors, LLC | 658 | -2,23 | 9 | 0,00 | ||||
| 2026-02-03 | 13F | Cassaday & Co Wealth Management LLC | 132.000 | 3,12 | 1.844 | 4,30 | ||||
| 2026-02-11 | 13F | Simplex Trading, Llc | Call | 13.000 | 364,29 | 182 | ||||
| 2026-02-11 | 13F | Simplex Trading, Llc | 0 | -100,00 | 0 | |||||
| 2026-04-07 | 13F | CoreCap Advisors, LLC | 0 | -100,00 | 0 | |||||
| 2026-02-11 | 13F | Simplex Trading, Llc | Put | 2.600 | -31,58 | 36 | ||||
| 2026-01-14 | 13F | ORG Partners LLC | 1.000 | 0,00 | 14 | 0,00 | ||||
| 2026-04-22 | 13F | Union Bancaire Privee, UBP SA | 3.570 | -76,81 | 51 | -99,85 |
Other Listings
| US:GAIN | 16,82 $ |