Grundlæggende statistik
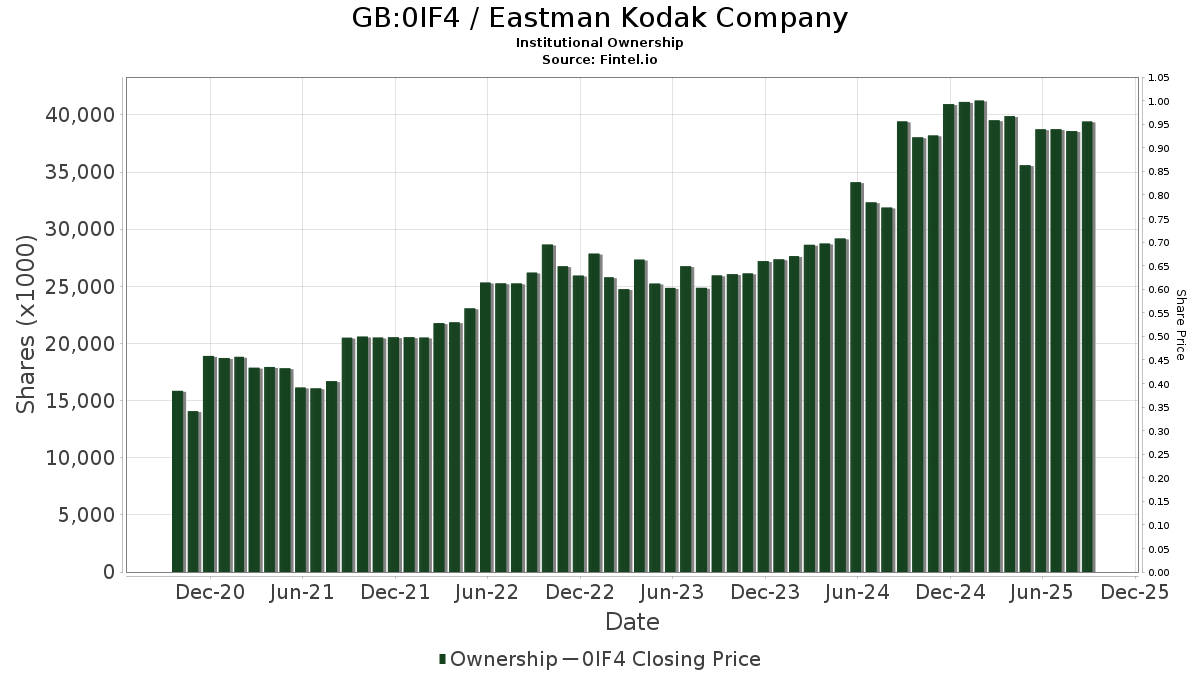
| Institutionelle aktier (lange) | 33.500.074 - 34,32% (ex 13D/G) - change of -6,02MM shares -15,24% MRQ |
| Institutionel værdi (lang) | $ 279.584 USD ($1000) |
Institutionelt ejerskab og aktionærer
Eastman Kodak Company (GB:0IF4) har 168 institutionelle ejere og aktionærer, der har indsendt 13D/G- eller 13F-formularer til Securities Exchange Commission (SEC). Disse institutioner har i alt 33,500,074 aktier. Største aktionærer omfatter Vanguard Group Inc, BlackRock, Inc., Marshall Wace, Llp, Dimensional Fund Advisors Lp, State Street Corp, Jane Street Group, Llc, Geode Capital Management, Llc, Gmt Capital Corp, Citadel Advisors Llc, and Goldman Sachs Group Inc .
Eastman Kodak Company (LSE:0IF4) institutionel ejerskabsstruktur viser aktuelle positioner i virksomheden efter institutioner og fonde, samt seneste ændringer i positionsstørrelse. Større aktionærer kan omfatte individuelle investorer, investeringsforeninger, hedgefonde eller institutioner. Skema 13D angiver, at investoren besidder (eller besidder) mere end 5 % af virksomheden og har til hensigt (eller har til hensigt at) aktivt at forfølge en ændring i forretningsstrategi. Skema 13G indikerer en passiv investering på over 5%.
The share price as of April 20, 2026 is 12,91 / share. Previously, on December 2, 2025, the share price was 7,91 / share. This represents an increase of 63,24% over that period.
Fondens stemningsscore
Fund Sentiment Score (fka Ownership Accumulation Score) finder de aktier, der bliver mest købt af fonde. Det er resultatet af en sofistikeret, multi-faktor kvantitativ model, der identificerer virksomheder med de højeste niveauer af institutionel akkumulering. Scoringsmodellen bruger en kombination af den samlede stigning i oplyste ejere, ændringerne i porteføljeallokeringer i disse ejere og andre målinger. Tallet går fra 0 til 100, hvor højere tal indikerer et højere niveau af akkumulering for sine jævnaldrende, og 50 er gennemsnittet.
Opdateringsfrekvens: Dagligt
Se Ownership Explorer, som giver en liste over højest rangerende virksomheder.
AI+ Ask Fintel’s AI assistant about Eastman Kodak Company.
Select a question to share a public post with an AI-crafted answer.
Thinking of good questions…
13F og NPORT arkivering
Detaljer om 13F-arkivering er gratis. Detaljer om NP-ansøgninger kræver et premium-medlemskab. Grønne rækker angiver nye positioner. Røde rækker angiver lukkede positioner. Klik på linket ikon for at se den fulde transaktionshistorik.
Opgrader
for at låse premium-data op og eksportere til Excel ![]() .
.
| Fil dato | Kilde | Investor | Type | Gennemsnitlig pris (Øst) |
Aktier | Δ Aktier (%) |
Rapporteret Værdi ($1000) |
Δ Værdi (%) |
Port Alloc (%) |
|
|---|---|---|---|---|---|---|---|---|---|---|
| 2026-02-17 | 13F | Parallax Volatility Advisers, L.P. | 0 | -100,00 | 0 | |||||
| 2026-01-27 | 13F | Round Rock Advisors, LLC | 0 | -100,00 | 0 | |||||
| 2026-02-11 | 13F | ARK Investment Management LLC | 10.745 | 4,22 | 91 | 36,36 | ||||
| 2026-02-09 | 13F | Harbour Investments, Inc. | 20 | 0,00 | 0 | |||||
| 2026-04-27 | 13F | Sound Income Strategies, LLC | 100 | 0,00 | 1 | |||||
| 2026-04-16 | 13F | Toth Financial Advisory Corp | 2.000 | 0,00 | 18 | 12,50 | ||||
| 2026-02-02 | 13F | Cornerstone Planning Group LLC | 81 | 0,00 | 1 | |||||
| 2025-10-29 | 13F | Triasima Portfolio Management inc. | 0 | -100,00 | 0 | |||||
| 2026-02-13 | 13F | Police & Firemen's Retirement System of New Jersey | 12.888 | -33,39 | 109 | -12,10 | ||||
| 2026-02-06 | 13F | Pnc Financial Services Group, Inc. | 127 | 1 | ||||||
| 2026-02-12 | 13F | BlackRock, Inc. | 3.824.296 | -16,76 | 32.354 | 9,86 | ||||
| 2026-02-13 | 13F | OpenArc Corporate Advisory, LLC | 10.000 | 85 | ||||||
| 2026-02-04 | 13F | Clark Wealth Partners | 0 | -100,00 | 0 | |||||
| 2026-02-17 | 13F | Price T Rowe Associates Inc /md/ | 70.021 | -9,27 | 1 | |||||
| 2025-11-14 | 13F | Raymond James Financial Inc | 0 | -100,00 | 0 | |||||
| 2026-02-13 | 13F | Victory Capital Management Inc | 0 | -100,00 | 0 | -100,00 | ||||
| 2026-02-12 | 13F | DRW Securities, LLC | Call | 0 | -100,00 | 0 | -100,00 | |||
| 2026-02-17 | 13F | Tower Research Capital LLC (TRC) | 5.540 | 47,14 | 47 | 91,67 | ||||
| 2026-04-08 | 13F | Wealth Enhancement Advisory Services, Llc | 17.169 | 63,02 | 193 | 119,32 | ||||
| 2025-11-14 | 13F | Corton Capital Inc. | 0 | -100,00 | 0 | |||||
| 2026-01-29 | 13F | Comerica Bank | 11.503 | 3.364,76 | 97 | 4.750,00 | ||||
| 2025-11-06 | 13F | Costello Asset Management, INC | 0 | -100,00 | 0 | |||||
| 2026-04-13 | 13F | IFP Advisors, Inc | 37 | 0 | -100,00 | |||||
| 2026-02-13 | 13F | Citigroup Inc | 1.610 | 1,19 | 14 | 30,00 | ||||
| 2025-11-12 | 13F | HAP Trading, LLC | Put | 53.200 | 2 | |||||
| 2026-03-04 | 13F | Leonteq Securities AG | 0 | -100,00 | 0 | |||||
| 2026-02-17 | 13F | Voloridge Investment Management, Llc | 56.121 | 475 | ||||||
| 2026-04-21 | 13F | PharVision Advisers, LLC | 0 | -100,00 | 0 | |||||
| 2026-02-17 | 13F | Bank Of America Corp /de/ | 61.586 | -11,52 | 521 | 16,82 | ||||
| 2026-04-10 | 13F | Novem Group | 11.950 | 0,00 | 108 | 6,93 | ||||
| 2026-02-12 | 13F | Hrt Financial Lp | 241.896 | 144,97 | 2 | |||||
| 2026-02-13 | 13F | Barclays Plc | 75.025 | -16,83 | 635 | 9,69 | ||||
| 2026-02-17 | 13F | Advisor Group Holdings, Inc. | 41.346 | -0,48 | 350 | 40,73 | ||||
| 2026-02-13 | 13F | Karpus Management, Inc. | 264 | 2 | ||||||
| 2026-02-17 | 13F | Russell Investments Group, Ltd. | 61.042 | -76,44 | 516 | -68,92 | ||||
| 2026-02-11 | 13F | Simplex Trading, Llc | 12.744 | -61,29 | 108 | |||||
| 2026-02-17 | 13F | Two Sigma Advisers, Lp | 91.901 | 58,45 | 777 | 109,43 | ||||
| 2026-02-11 | 13F | Simplex Trading, Llc | Call | 179.300 | -36,12 | 1.517 | 151.500,00 | |||
| 2026-02-11 | 13F | Simplex Trading, Llc | Put | 65.300 | -73,93 | 552 | 55.100,00 | |||
| 2026-02-06 | 13F | EverSource Wealth Advisors, LLC | 157 | -64,32 | 1 | -50,00 | ||||
| 2026-01-15 | 13F | Nisa Investment Advisors, Llc | 1.029 | 0,00 | 9 | 33,33 | ||||
| 2026-04-23 | 13F | SJS Investment Consulting Inc. | 96 | 1 | ||||||
| 2026-02-06 | 13F | Prescott Group Capital Management, L.l.c. | 374.345 | 0,00 | 3.167 | 31,97 | ||||
| 2026-02-12 | 13F | Quadrant Capital Group Llc | 717 | 117,93 | 6 | 200,00 | ||||
| 2026-02-23 | 13F | Virtu Financial LLC | 15.844 | 0 | ||||||
| 2026-02-04 | 13F | First Eagle Investment Management, LLC | 575.738 | -21,61 | 4.871 | 3,46 | ||||
| 2026-02-09 | 13F | Geode Capital Management, Llc | 1.398.633 | -8,73 | 11.835 | 20,46 | ||||
| 2026-02-12 | 13F | Marex Group plc | 0 | -100,00 | 0 | |||||
| 2026-02-17 | 13F | Kemnay Advisory Services Inc. | 8.348 | 71 | ||||||
| 2026-02-17 | 13F | Alliancebernstein L.p. | 53.280 | 0,19 | 451 | 32,35 | ||||
| 2026-04-21 | 13F | SLT Holdings LLC | 37.500 | 339 | ||||||
| 2026-02-12 | 13F | Dimensional Fund Advisors Lp | 2.064.403 | -24,73 | 17.465 | -0,65 | ||||
| 2026-01-29 | 13F | IMC-Chicago, LLC | 32.037 | 271 | ||||||
| 2026-01-29 | 13F | IMC-Chicago, LLC | Put | 105.900 | 25,62 | 896 | 65,74 | |||
| 2026-01-29 | 13F | IMC-Chicago, LLC | Call | 123.700 | -15,96 | 1.047 | 10,92 | |||
| 2026-02-11 | 13F | Ameritas Investment Partners, Inc. | 3.916 | 33 | ||||||
| 2026-02-17 | 13F | Tudor Investment Corp Et Al | 13.681 | 116 | ||||||
| 2026-02-17 | 13F | State Of Wisconsin Investment Board | 41.481 | -6,54 | 351 | 23,24 | ||||
| 2025-11-14 | 13F | Northwestern Mutual Wealth Management Co | 0 | -100,00 | 0 | |||||
| 2026-04-22 | 13F | Coston, McIsaac & Partners | 0 | -100,00 | 0 | |||||
| 2026-02-17 | 13F | Strive Financial Group ,LLC | 3 | 0 | ||||||
| 2025-11-13 | 13F | Quinn Opportunity Partners LLC | 0 | -100,00 | 0 | |||||
| 2026-02-13 | 13F | Verition Fund Management LLC | 81.825 | 130,75 | 692 | 204,85 | ||||
| 2026-02-17 | 13F | Graham Capital Management, L.P. | 0 | -100,00 | 0 | |||||
| 2025-11-13 | 13F | Total Investment Management Inc | 0 | -100,00 | 0 | |||||
| 2026-04-07 | 13F | CoreCap Advisors, LLC | 200 | 0,00 | 2 | 0,00 | ||||
| 2026-02-06 | 13F | Kimelman & Baird, LLC | 100 | 0,00 | 1 | |||||
| 2026-02-12 | 13F | Renaissance Technologies Llc | 194.345 | 1.644 | ||||||
| 2025-11-05 | 13F | Bessemer Group Inc | 0 | -100,00 | 0 | |||||
| 2026-04-07 | 13F | Estate Planners Group, LLC | 214 | 2 | ||||||
| 2026-04-22 | 13F | Accretive Wealth Partners, LLC | 16.500 | 0,00 | 149 | 7,19 | ||||
| 2026-02-13 | 13F | Caitong International Asset Management Co., Ltd | 2.150 | 18 | ||||||
| 2026-02-13 | 13F | Wells Fargo & Company/mn | 678.685 | -36,60 | 5.742 | -16,32 | ||||
| 2026-02-13 | 13F | State Street Corp | 1.887.955 | -16,99 | 15.972 | 9,55 | ||||
| 2026-04-06 | 13F | GAMMA Investing LLC | 919 | -5,16 | 8 | 0,00 | ||||
| 2026-02-11 | 13F | Empowered Funds, LLC | 353.909 | 10,85 | 2.994 | 46,33 | ||||
| 2026-02-11 | 13F | Jpmorgan Chase & Co | 21.011 | -19,80 | 178 | 5,99 | ||||
| 2026-04-14 | 13F | Tradewinds Capital Management, LLC | 500 | 0,00 | 5 | 0,00 | ||||
| 2026-02-10 | 13F | Bank of New York Mellon Corp | 234.683 | -7,41 | 1.985 | 22,23 | ||||
| 2026-02-17 | 13F | XTX Topco Ltd | 65.967 | 17,33 | 558 | 55,00 | ||||
| 2026-02-12 | 13F | New York State Common Retirement Fund | 45.681 | 0,00 | 386 | 32,19 | ||||
| 2026-02-17 | 13F | Susquehanna International Group, Llp | Put | 110.800 | -54,87 | 937 | -40,43 | |||
| 2026-02-17 | 13F | Balyasny Asset Management Llc | 10.540 | 89 | ||||||
| 2026-02-17 | 13F | Susquehanna International Group, Llp | Call | 742.400 | 44,72 | 6.281 | 91,00 | |||
| 2026-02-17 | 13F | Susquehanna International Group, Llp | 42.398 | -93,39 | 359 | -91,29 | ||||
| 2025-11-14 | 13F | Peak6 Llc | Put | 0 | -100,00 | 0 | -100,00 | |||
| 2026-02-17 | 13F | Mpwm Advisory Solutions, Llc | 0 | -100,00 | 0 | |||||
| 2025-11-14 | 13F | Peak6 Llc | 0 | -100,00 | 0 | -100,00 | ||||
| 2026-04-06 | 13F | Versant Capital Management, Inc | 119 | 1 | ||||||
| 2025-11-07 | 13F | Beacon Capital Management, LLC | 0 | -100,00 | 0 | |||||
| 2026-04-17 | 13F | Krilogy Financial LLC | 0 | -100,00 | 0 | |||||
| 2026-02-06 | 13F | Larson Financial Group LLC | 600 | 5 | ||||||
| 2026-02-11 | 13F | Inceptionr Llc | 22.997 | 195 | ||||||
| 2026-02-10 | 13F | State of Wyoming | 19.477 | 165 | ||||||
| 2026-04-10 | 13F | High Probability Advisors, LLC | 11.160 | 0,00 | 101 | 6,38 | ||||
| 2026-02-12 | 13F | CIBC Private Wealth Group, LLC | 9 | 0,00 | 0 | |||||
| 2026-02-17 | 13F | Citadel Advisors Llc | Call | 147.100 | -22,13 | 1.244 | 2,81 | |||
| 2026-02-13 | 13F | Parkside Financial Bank & Trust | 4 | 0,00 | 0 | |||||
| 2026-02-17 | 13F | Citadel Advisors Llc | Put | 353.800 | -10,20 | 2.993 | 18,53 | |||
| 2026-02-17 | 13F | Citadel Advisors Llc | 959.976 | 30,27 | 8.121 | 71,95 | ||||
| 2026-02-17 | 13F | Quantinno Capital Management LP | 58.796 | 24,62 | 497 | 64,57 | ||||
| 2026-02-06 | 13F | Global Retirement Partners, LLC | 95 | 1 | ||||||
| 2026-02-13 | 13F | C M Bidwell & Associates Ltd | 80 | 1 | ||||||
| 2026-02-06 | 13F | Gsa Capital Partners Llp | 28.898 | 0 | ||||||
| 2026-02-12 | 13F | Rossby Financial, LCC | 75 | 0,00 | 1 | |||||
| 2026-02-17 | 13F | Dark Forest Capital Management Lp | 0 | -100,00 | 0 | -100,00 | ||||
| 2026-02-04 | 13F | GGM Financials LLC | 400 | 0,00 | 3 | 50,00 | ||||
| 2026-02-13 | 13F | Smartleaf Asset Management LLC | 958 | -6,17 | 8 | 33,33 | ||||
| 2026-04-16 | 13F | SG Americas Securities, LLC | 0 | -100,00 | 0 | |||||
| 2026-02-13 | 13F | Segall Bryant & Hamill, Llc | 0 | -100,00 | 0 | |||||
| 2026-02-17 | 13F | Point72 Asset Management, L.P. | 194.804 | 1.340,11 | 1.648 | 1.816,28 | ||||
| 2026-02-17 | 13F | Aqr Capital Management Llc | 64.059 | -5,24 | 542 | 24,94 | ||||
| 2025-11-14 | 13F | Wolverine Trading, Llc | 62.641 | 39,49 | 403 | 56,20 | ||||
| 2026-02-17 | 13F | ExodusPoint Capital Management, LP | 0 | -100,00 | 0 | -100,00 | ||||
| 2025-11-14 | 13F | Wolverine Trading, Llc | Call | 159.000 | 58,84 | 1.024 | 77,91 | |||
| 2025-11-14 | 13F | Wolverine Trading, Llc | Put | 30.800 | -34,88 | 198 | -26,94 | |||
| 2026-01-21 | 13F | Flagship Harbor Advisors, Llc | 500 | 4 | ||||||
| 2026-01-29 | 13F | Sanctuary Advisors, LLC | 22.469 | -74,07 | 190 | -65,77 | ||||
| 2026-02-13 | 13F | Manufacturers Life Insurance Company, The | 0 | -100,00 | 0 | |||||
| 2026-04-21 | 13F | GHP Investment Advisors, Inc. | 1 | 0,00 | 0 | |||||
| 2025-11-14 | 13F | Brevan Howard Capital Management LP | 0 | -100,00 | 0 | |||||
| 2026-02-17 | 13F | MIRAE ASSET GLOBAL ETFS HOLDINGS Ltd. | 22.408 | -25,02 | 190 | -1,05 | ||||
| 2026-02-12 | 13F | Nuveen, LLC | 104.615 | -12,69 | 885 | 15,23 | ||||
| 2026-02-13 | 13F | Aire Advisors, Llc | 16.240 | 137 | ||||||
| 2025-11-12 | 13F | Creekmur Asset Management LLC | 25 | 0 | ||||||
| 2026-02-17 | 13F | Equitable Holdings, Inc. | 17.260 | 40,90 | 146 | 87,18 | ||||
| 2026-02-13 | 13F | Quarry LP | 2.229 | 6,04 | 19 | 38,46 | ||||
| 2026-02-11 | 13F | Deutsche Bank Ag\ | 53.109 | 5,13 | 449 | 39,01 | ||||
| 2026-02-13 | 13F | Charles Schwab Investment Management Inc | 155.987 | -15,79 | 1.320 | 11,12 | ||||
| 2026-02-12 | 13F | Skopos Labs, Inc. | 127.940 | 1.102 | ||||||
| 2026-01-22 | 13F | Northcape Wealth Management, Llc | 22.500 | -35,71 | 190 | -15,18 | ||||
| 2026-02-06 | 13F | ProShare Advisors LLC | 0 | -100,00 | 0 | |||||
| 2026-01-16 | 13F | Hopwood Financial Services, Inc. | 0 | -100,00 | 0 | |||||
| 2026-02-13 | 13F | National Bank Of Canada /fi/ | 100 | 0,00 | 1 | |||||
| 2026-02-13 | 13F | Ubs Asset Management Americas Inc | 1.388 | 12 | ||||||
| 2026-01-29 | 13F | Vanguard Group Inc | 5.712.683 | 9,90 | 48.329 | 45,05 | ||||
| 2026-02-17 | 13F | Parallax Volatility Advisers, L.P. | Put | 0 | -100,00 | 0 | ||||
| 2026-04-13 | 13F | True Wealth Design, LLC | 113 | 29,89 | 1 | |||||
| 2025-11-12 | 13F | Cobblestone Capital Advisors Llc /ny/ | 30.140 | 0,00 | 193 | 13,53 | ||||
| 2026-02-03 | 13F | Denali Advisors Llc | 130.492 | 0,00 | 1.104 | 31,94 | ||||
| 2026-04-02 | 13F | Byrne Asset Management LLC | 18.860 | -14,58 | 171 | -8,60 | ||||
| 2026-02-12 | 13F | Ankerstar Wealth, LLC | 15.000 | 127 | ||||||
| 2026-02-18 | 13F | GWM Advisors LLC | 10 | 0,00 | 0 | |||||
| 2026-02-13 | 13F | Headlands Technologies LLC | 13.649 | 115 | ||||||
| 2026-02-13 | 13F | Bank Of Nova Scotia | 14.213 | 120 | ||||||
| 2026-02-17 | 13F | Northern Trust Corp | 411.884 | -19,56 | 3.485 | 6,15 | ||||
| 2026-04-16 | 13F | Quotient Wealth Partners, LLC | 0 | -100,00 | 0 | |||||
| 2026-04-22 | 13F | Janney Montgomery Scott LLC | 14.900 | 0,00 | 0 | |||||
| 2026-02-13 | 13F | Morgan Stanley | 373.250 | 88,67 | 3.158 | 148,97 | ||||
| 2026-02-17 | 13F | Safe Harbor Fiduciary, LLC | 675 | 0,00 | 6 | 66,67 | ||||
| 2026-02-12 | 13F | Commonwealth Equity Services, Llc | 25.176 | -7,20 | 213 | |||||
| 2025-11-07 | 13F | Synovus Financial Corp | 18.161 | 0,00 | 116 | 13,73 | ||||
| 2026-02-09 | 13F | Hantz Financial Services, Inc. | 30 | 0,00 | 0 | |||||
| 2025-11-17 | 13F | FSA Wealth Management LLC | 1 | 0,00 | 0 | |||||
| 2026-02-13 | 13F | Rhumbline Advisers | 73.209 | -25,19 | 619 | -1,28 | ||||
| 2025-11-14 | 13F | Susquehanna Fundamental Investments, Llc | 0 | -100,00 | 0 | |||||
| 2026-02-17 | 13F | Engineers Gate Manager LP | 52.963 | 448 | ||||||
| 2025-11-14 | 13F | Cubist Systematic Strategies, LLC | 222.089 | 1.424 | ||||||
| 2026-02-17 | 13F | Boothbay Fund Management, Llc | 16.162 | 137 | ||||||
| 2026-02-12 | 13F | MetLife Investment Management, LLC | 26.697 | -25,77 | 226 | -2,17 | ||||
| 2025-11-14 | 13F | Caption Management, LLC | Put | 0 | -100,00 | 0 | ||||
| 2026-02-13 | 13F | MAI Capital Management | 150 | 0,00 | 1 | |||||
| 2025-11-14 | 13F | Strategic Wealth Partners, Ltd. | 1.161 | 0,00 | 7 | 16,67 | ||||
| 2026-02-17 | 13F | Fmr Llc | 7.107 | 60,94 | 60 | 114,29 | ||||
| 2026-04-13 | 13F | St Germain D J Co Inc | 200 | 0,00 | 2 | 0,00 | ||||
| 2025-11-14 | 13F | Point72 Asia (Singapore) Pte. Ltd. | 3.610 | 23 | ||||||
| 2026-02-17 | 13F | Royal Bank Of Canada | 5.741 | -95,39 | 49 | -93,87 | ||||
| 2026-02-11 | 13F | Group One Trading, L.p. | Put | 356.200 | 46,40 | 3.013 | 93,26 | |||
| 2026-02-11 | 13F | Group One Trading, L.p. | 362.158 | 41,25 | 3.064 | 86,43 | ||||
| 2026-02-11 | 13F | Group One Trading, L.p. | Call | 699.700 | -34,43 | 5.919 | -13,46 | |||
| 2026-02-17 | 13F | Two Sigma Investments, Lp | 598.214 | 48,38 | 5.061 | 95,82 | ||||
| 2025-10-30 | 13F | Covestor Ltd | 0 | -100,00 | 0 | |||||
| 2026-02-17 | 13F | Jones Financial Companies Lllp | 1.267 | 2,18 | 11 | 42,86 | ||||
| 2025-11-21 | 13F | Nebula Research & Development LLC | 0 | -100,00 | 0 | |||||
| 2026-02-09 | 13F | Legal & General Group Plc | 4.305 | -25,39 | 36 | 0,00 | ||||
| 2026-04-20 | 13F | Jfs Wealth Advisors, Llc | 555 | 0,00 | 5 | 25,00 | ||||
| 2026-02-13 | 13F | SRS Capital Advisors, Inc. | 832 | 7 | ||||||
| 2026-02-12 | 13F | Campbell & CO Investment Adviser LLC | 0 | -100,00 | 0 | |||||
| 2025-11-04 | 13F | Guerra Advisors Inc | 1 | 0 | ||||||
| 2026-02-06 | 13F/A | Rathbone Brothers plc | 12.800 | 0,00 | 108 | 31,71 | ||||
| 2026-02-17 | 13F | Captrust Financial Advisors | 32.828 | 278 | ||||||
| 2026-02-10 | 13F | Goldman Sachs Group Inc | 830.732 | 225,78 | 7.028 | 330,05 | ||||
| 2026-02-13 | 13F | Battery Global Advisors, LLC | 408 | 16 | ||||||
| 2026-01-26 | 13F | Cwm, Llc | 7.825 | 0,19 | 0 | |||||
| 2026-02-19 | 13F | Invesco Ltd. | 226.214 | -10,39 | 1.914 | 18,23 | ||||
| 2026-04-07 | 13F | Farther Finance Advisors, LLC | 414 | -94,11 | 4 | -94,92 | ||||
| 2026-02-06 | 13F | HighTower Advisors, LLC | 10.510 | 0,33 | 89 | 31,34 | ||||
| 2026-02-11 | 13F | Franklin Resources Inc | 28.570 | -25,18 | 242 | -1,23 | ||||
| 2026-02-10 | 13F | Axq Capital, Lp | 21.459 | 7,94 | 182 | 42,52 | ||||
| 2026-02-09 | 13F | Quest Partners LLC | 4.289 | 0,00 | 36 | 33,33 | ||||
| 2026-02-05 | 13F | Amalgamated Bank | 1.516 | -24,28 | 0 | |||||
| 2026-02-17 | 13F | Creative Planning | 46.947 | 3,91 | 397 | 37,37 | ||||
| 2026-02-09 | 13F | Hartland & Co., LLC | 0 | -100,00 | 0 | |||||
| 2026-02-10 | 13F | Bnp Paribas Arbitrage, Sa | 11.296 | -9,52 | 96 | 18,75 | ||||
| 2026-02-17 | 13F | Flat Footed LLC | 0 | -100,00 | 0 | |||||
| 2026-02-17 | 13F | Millennium Management Llc | 536.957 | 97,17 | 4.543 | 160,29 | ||||
| 2025-11-07 | 13F | Accretive Wealth Partners, LLC | Call | 0 | -100,00 | 0 | -100,00 | |||
| 2026-01-20 | 13F | Wall Street Access Asset Management, LLC | 38 | 0,00 | 0 | |||||
| 2025-11-13 | 13F | Brandywine Global Investment Management, LLC | 0 | -100,00 | 0 | |||||
| 2026-02-13 | 13F | Yakira Capital Management, Inc. | 0 | -100,00 | 0 | |||||
| 2026-01-29 | 13F | UBS Group AG | 385.835 | -18,22 | 3.264 | 7,94 | ||||
| 2026-02-17 | 13F | Hilltop Holdings Inc. | 21.700 | 72,22 | 184 | 128,75 | ||||
| 2026-02-13 | 13F | Pinnacle Wealth Planning Services, Inc. | 274 | 2 | ||||||
| 2026-02-03 | 13F | SBI Securities Co., Ltd. | 66 | -18,52 | 1 | |||||
| 2026-02-14 | 13F | Rockefeller Capital Management L.P. | 1.650 | -18,84 | 14 | 0,00 | ||||
| 2026-02-17 | 13F | Corsair Capital Management, L.p. | 54.603 | 462 | ||||||
| 2026-02-06 | 13F | FourThought Financial Partners, LLC | 52.384 | 443 | ||||||
| 2026-02-11 | 13F | LPL Financial LLC | 24.054 | 21,56 | 203 | 61,11 | ||||
| 2026-02-17 | 13F | California State Teachers Retirement System | 2.970 | -25,38 | 25 | 0,00 | ||||
| 2026-02-05 | 13F | Allworth Financial LP | 1 | -99,90 | 0 | -100,00 | ||||
| 2026-02-12 | 13F | Jane Street Group, Llc | Call | 126.500 | -2,09 | 1.070 | 29,23 | |||
| 2026-02-12 | 13F | Jane Street Group, Llc | 1.511.304 | 118,96 | 12.786 | 188,99 | ||||
| 2025-11-13 | 13F | Aristides Capital LLC | 0 | -100,00 | 0 | |||||
| 2026-02-12 | 13F | Jane Street Group, Llc | Put | 15.200 | -81,80 | 129 | -76,07 | |||
| 2026-02-17 | 13F | Bridgeway Capital Management Inc | 651.909 | 5,61 | 5.515 | 39,41 | ||||
| 2026-02-17 | 13F | Optiver Holding B.V. | 288 | -44,62 | 2 | -33,33 | ||||
| 2026-02-10 | 13F | Intech Investment Management Llc | 21.913 | -24,44 | 185 | 0,00 | ||||
| 2025-11-13 | 13F | Arrowstreet Capital, Limited Partnership | 0 | -100,00 | 0 | |||||
| 2026-04-22 | 13F | Sterling Capital Management LLC | 2.084 | -25,06 | 19 | -21,74 | ||||
| 2026-02-12 | 13F | Voya Investment Management Llc | 0 | -100,00 | 0 | |||||
| 2026-02-11 | 13F | SOUTH STATE Corp | 1.000 | 0,00 | 8 | 33,33 | ||||
| 2026-04-14 | 13F | Kozak & Associates, Inc. | 4.160 | 50 | ||||||
| 2026-02-10 | 13F | Quantbot Technologies LP | 0 | -100,00 | 0 | |||||
| 2026-02-11 | 13F | Rise Advisors, LLC | 0 | -100,00 | 0 | |||||
| 2026-02-13 | 13F | Prudential Financial Inc | 0 | -100,00 | 0 | |||||
| 2026-04-13 | 13F | Mather Group, Llc. | 50 | 0 | ||||||
| 2026-02-13 | 13F | Gmt Capital Corp | 981.400 | 0,00 | 8.303 | 31,99 | ||||
| 2026-02-13 | 13F | Squarepoint Ops LLC | 0 | -100,00 | 0 | |||||
| 2026-02-17 | 13F | D. E. Shaw & Co., Inc. | Call | 40.600 | 343 | |||||
| 2026-02-17 | 13F | D. E. Shaw & Co., Inc. | Put | 80.000 | 677 | |||||
| 2026-04-23 | 13F | Oppenheimer & Co Inc | 0 | -100,00 | 0 | |||||
| 2026-02-13 | 13F | First Trust Advisors Lp | 222.783 | 21,93 | 1.885 | 60,89 | ||||
| 2026-02-13 | 13F | Marshall Wace, Llp | 3.817.610 | 32.297 | ||||||
| 2026-02-17 | 13F | D. E. Shaw & Co., Inc. | 779.771 | 243,94 | 6.597 | 353,96 | ||||
| 2026-02-13 | 13F | American Century Companies Inc | 183.083 | -2,28 | 1.549 | 29,00 | ||||
| 2025-11-19 | 13F | Sunbelt Securities, Inc. | 0 | -100,00 | 0 |