Grundlæggende statistik
| Institutionelle ejere | 136 total, 131 long only, 0 short only, 5 long/short - change of -2,86% MRQ |
| Del pris | 25,96 |
| Gennemsnitlig porteføljeallokering | 0.0296 % - change of -50,25% MRQ |
| Institutionelle aktier (lange) | 9.666.929 (ex 13D/G) - change of -4,57MM shares -32,09% MRQ |
| Institutionel værdi (lang) | $ 212.354 USD ($1000) |
Institutionelt ejerskab og aktionærer
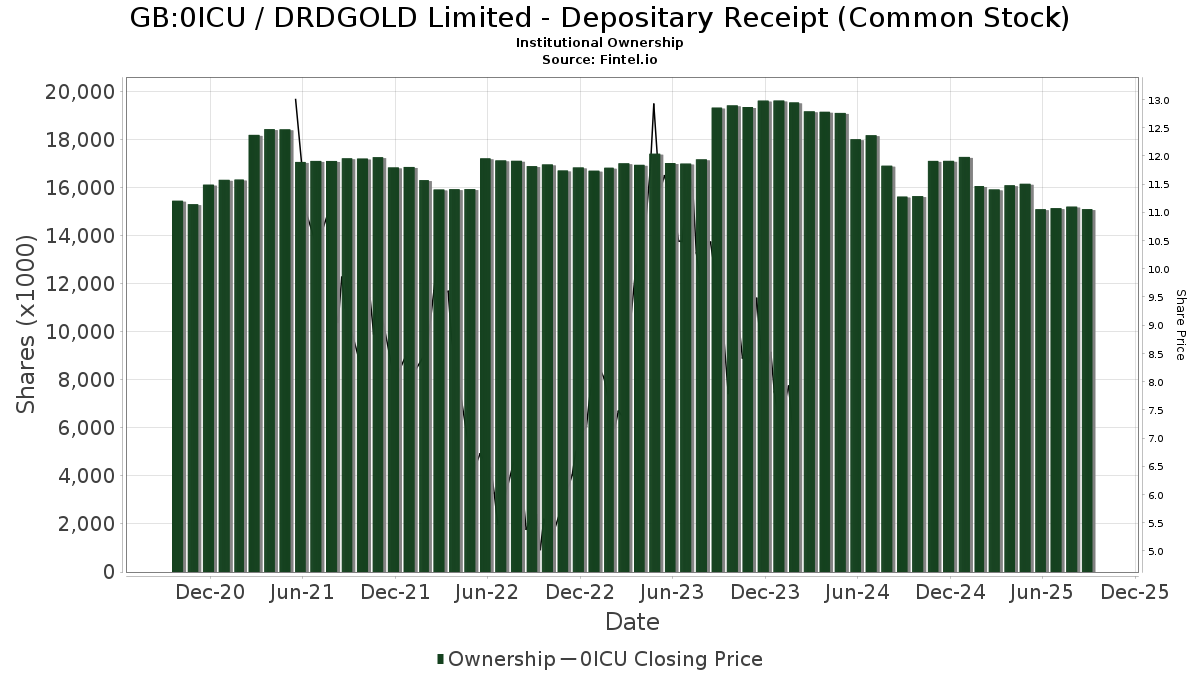
DRDGOLD Limited - Depositary Receipt (Common Stock) (GB:0ICU) har 136 institutionelle ejere og aktionærer, der har indsendt 13D/G- eller 13F-formularer til Securities Exchange Commission (SEC). Disse institutioner har i alt 9,666,929 aktier. Største aktionærer omfatter Acadian Asset Management Llc, Van Eck Associates Corp, Arrowstreet Capital, Limited Partnership, Connor, Clark & Lunn Investment Management Ltd., BlackRock, Inc., American Century Companies Inc, Amundi, Jane Street Group, Llc, Aqr Capital Management Llc, and U S Global Investors Inc .
DRDGOLD Limited - Depositary Receipt (Common Stock) (LSE:0ICU) institutionel ejerskabsstruktur viser aktuelle positioner i virksomheden efter institutioner og fonde, samt seneste ændringer i positionsstørrelse. Større aktionærer kan omfatte individuelle investorer, investeringsforeninger, hedgefonde eller institutioner. Skema 13D angiver, at investoren besidder (eller besidder) mere end 5 % af virksomheden og har til hensigt (eller har til hensigt at) aktivt at forfølge en ændring i forretningsstrategi. Skema 13G indikerer en passiv investering på over 5%.
The share price as of March 20, 2026 is 25,96 / share. Previously, on March 24, 2025, the share price was 13,89 / share. This represents an increase of 86,89% over that period.
Fondens stemningsscore
Fund Sentiment Score (fka Ownership Accumulation Score) finder de aktier, der bliver mest købt af fonde. Det er resultatet af en sofistikeret, multi-faktor kvantitativ model, der identificerer virksomheder med de højeste niveauer af institutionel akkumulering. Scoringsmodellen bruger en kombination af den samlede stigning i oplyste ejere, ændringerne i porteføljeallokeringer i disse ejere og andre målinger. Tallet går fra 0 til 100, hvor højere tal indikerer et højere niveau af akkumulering for sine jævnaldrende, og 50 er gennemsnittet.
Opdateringsfrekvens: Dagligt
Se Ownership Explorer, som giver en liste over højest rangerende virksomheder.
AI+ Ask Fintel’s AI assistant about DRDGOLD Limited - Depositary Receipt (Common Stock).
Select a question to share a public post with an AI-crafted answer.
Thinking of good questions…
13F og NPORT arkivering
Detaljer om 13F-arkivering er gratis. Detaljer om NP-ansøgninger kræver et premium-medlemskab. Grønne rækker angiver nye positioner. Røde rækker angiver lukkede positioner. Klik på linket ikon for at se den fulde transaktionshistorik.
Opgrader
for at låse premium-data op og eksportere til Excel ![]() .
.
| Fil dato | Kilde | Investor | Type | Gennemsnitlig pris (Øst) |
Aktier | Δ Aktier (%) |
Rapporteret Værdi ($1000) |
Δ Værdi (%) |
Port Alloc (%) |
|
|---|---|---|---|---|---|---|---|---|---|---|
| 2026-02-13 | 13F | Smartleaf Asset Management LLC | 4.480 | 140 | ||||||
| 2025-09-25 | NP | DFA INVESTMENT DIMENSIONS GROUP INC - Emerging Markets Targeted Value Portfolio Institutional Class This fund is a listed as child fund of Dimensional Fund Advisors Lp and if that institution has disclosed ownership in this security, then these positions will not be double counted when calculating total shares and total value | 0 | -100,00 | 0 | -100,00 | ||||
| 2025-09-25 | NP | DFA INVESTMENT DIMENSIONS GROUP INC - World ex U.S. Core Equity Portfolio Institutional Class Shares | 5.253 | 61,83 | 70 | 45,83 | ||||
| 2026-02-06 | 13F | Leonteq Securities AG | 1 | 0,00 | 0 | |||||
| 2026-02-14 | 13F | Rockefeller Capital Management L.P. | 875 | 0,00 | 27 | 12,50 | ||||
| 2026-02-17 | 13F | Balyasny Asset Management Llc | 0 | -100,00 | 0 | |||||
| 2025-11-14 | 13F | Point72 (DIFC) Ltd | 8.900 | 246 | ||||||
| 2026-02-17 | 13F | Trexquant Investment LP | 21.498 | 667 | ||||||
| 2025-11-14 | 13F | Larson Financial Group LLC | 0 | -100,00 | 0 | -100,00 | ||||
| 2026-02-11 | 13F | Prestige Wealth Management Group LLC | 38 | 1 | ||||||
| 2026-02-17 | 13F | Citadel Advisors Llc | Put | 32.900 | -8,10 | 1.020 | 3,24 | |||
| 2025-11-14 | 13F | Weiss Asset Management LP | 79.773 | 2.202 | ||||||
| 2026-02-17 | 13F | Citadel Advisors Llc | Call | 47.900 | -31,77 | 1.485 | -23,34 | |||
| 2026-02-24 | 13F | Bell Investment Advisors, Inc | 61 | 0,00 | 2 | 0,00 | ||||
| 2026-02-12 | 13F | Triumph Capital Management | 700 | 0,00 | 22 | 10,53 | ||||
| 2026-02-10 | 13F | Savant Capital, LLC | 14.777 | 8,22 | 458 | 21,81 | ||||
| 2026-02-17 | 13F | Clear Street Markets Llc | 0 | -100,00 | 0 | |||||
| 2026-03-03 | 13F/A | Caitong International Asset Management Co., Ltd | 26 | -88,18 | 1 | -100,00 | ||||
| 2026-02-06 | 13F | IFP Advisors, Inc | 1 | 0 | ||||||
| 2026-01-16 | 13F | Ronald Blue Trust, Inc. | 4.476 | 21,76 | 139 | 36,63 | ||||
| 2026-02-12 | 13F | New York State Common Retirement Fund | 13.973 | 0,00 | 433 | 12,47 | ||||
| 2025-10-27 | 13F | Kiker Wealth Management, LLC | 0 | -100,00 | 0 | |||||
| 2026-02-05 | 13F | Allworth Financial LP | 240 | 23,08 | 7 | 40,00 | ||||
| 2026-02-13 | 13F | OMERS ADMINISTRATION Corp | 0 | -100,00 | 0 | |||||
| 2026-03-12 | 13F/A | Peak6 Llc | Call | 80.000 | -51,52 | 2.481 | -45,54 | |||
| 2026-02-17 | 13F | Lazard Asset Management Llc | 172.564 | 5.351 | ||||||
| 2026-01-26 | 13F | Merit Financial Group, LLC | 10.263 | -16,40 | 318 | -5,92 | ||||
| 2026-02-17 | 13F | Schonfeld Strategic Advisors LLC | 0 | -100,00 | 0 | |||||
| 2026-01-13 | 13F | Stonehage Fleming Financial Services Holdings Ltd | 0 | -100,00 | 0 | |||||
| 2026-02-17 | 13F | Susquehanna International Group, Llp | Call | 31.700 | -64,10 | 983 | -59,66 | |||
| 2026-02-17 | 13F | Aquatic Capital Management LLC | 4.092 | 29,37 | 127 | 44,83 | ||||
| 2026-02-17 | 13F | Susquehanna International Group, Llp | 14.710 | -83,09 | 456 | -81,01 | ||||
| 2026-02-10 | 13F | Root Financial Partners, LLC | 37 | 0,00 | 1 | 0,00 | ||||
| 2026-02-17 | 13F | Advisor Group Holdings, Inc. | 7.564 | 8,15 | 235 | 33,71 | ||||
| 2025-11-14 | 13F | Two Sigma Investments, Lp | 0 | -100,00 | 0 | |||||
| 2026-02-17 | 13F | Aqr Capital Management Llc | 314.679 | 265,40 | 9.758 | 310,69 | ||||
| 2026-02-12 | 13F | Brinker Capital Investments, LLC | 17.464 | -7,61 | 542 | 3,84 | ||||
| 2026-02-17 | 13F | Ameriprise Financial Inc | 16.094 | -3,81 | 499 | 8,24 | ||||
| 2026-02-12 | 13F | Jane Street Group, Llc | 344.211 | -40,27 | 10.674 | -32,90 | ||||
| 2026-02-02 | 13F | Qrg Capital Management, Inc. | 0 | -100,00 | 0 | |||||
| 2026-02-11 | 13F | LPL Financial LLC | 20.246 | 68,16 | 628 | 88,86 | ||||
| 2026-02-10 | 13F/A | Northwestern Mutual Wealth Management Co | 20 | 1 | ||||||
| 2026-02-13 | 13F | Arrowstreet Capital, Limited Partnership | 1.049.652 | 6,12 | 32.550 | 19,24 | ||||
| 2025-09-25 | NP | DFSE - Dimensional Emerging Markets Sustainability Core 1 ETF | 2.577 | 0,00 | 34 | -10,53 | ||||
| 2026-02-13 | 13F | Ubs Asset Management Americas Inc | 38.733 | -45,79 | 1.201 | -39,07 | ||||
| 2026-02-11 | 13F | Parallel Advisors, LLC | 2.093 | 0,19 | 65 | 12,28 | ||||
| 2026-02-17 | 13F | Engineers Gate Manager LP | 11.436 | -15,09 | 355 | -4,58 | ||||
| 2026-02-17 | 13F | Old Mission Capital Llc | 25.743 | 798 | ||||||
| 2026-02-06 | 13F | Pnc Financial Services Group, Inc. | 11 | -94,21 | 0 | -100,00 | ||||
| 2026-01-05 | 13F | GAMMA Investing LLC | 8.450 | 4,15 | 262 | 17,49 | ||||
| 2026-02-06 | 13F | HighTower Advisors, LLC | 0 | -100,00 | 0 | |||||
| 2025-09-25 | NP | DFEM - Dimensional Emerging Markets Core Equity 2 ETF | 18.369 | 45,81 | 245 | 31,02 | ||||
| 2025-11-12 | 13F | Creekmur Asset Management LLC | 10 | 0,00 | 0 | |||||
| 2026-02-17 | 13F | Raymond James Financial Inc | 15.289 | 109,35 | 474 | 135,82 | ||||
| 2026-01-21 | 13F | Towarzystwo Funduszy Inwestycyjnych Allianz Polska S.A. | 26.700 | -6,97 | 834 | 5,18 | ||||
| 2026-02-18 | 13F | GWM Advisors LLC | 661 | 1,54 | 21 | 17,65 | ||||
| 2026-01-29 | 13F | UMA Financial Services, Inc. | 56 | -24,32 | 2 | -50,00 | ||||
| 2026-02-10 | 13F | Acadian Asset Management Llc | 1.629.081 | 148,66 | 50 | 177,78 | ||||
| 2026-02-11 | 13F | IMA Wealth, Inc. | 4 | 0 | ||||||
| 2026-02-13 | 13F | National Bank Of Canada /fi/ | 2.323 | 22,59 | 72 | 38,46 | ||||
| 2025-09-25 | NP | DFAE - Dimensional Emerging Core Equity Market ETF | 1.388 | 0,00 | 19 | -10,00 | ||||
| 2026-02-05 | 13F | SkyOak Wealth, LLC | 8.862 | 275 | ||||||
| 2026-02-13 | 13F | Morgan Stanley | 169.493 | 14,04 | 5.256 | 28,14 | ||||
| 2026-02-13 | 13F | Barclays Plc | 73.738 | -30,55 | 2.287 | -21,98 | ||||
| 2025-09-26 | NP | AEMGX - Acadian Emerging Markets Portfolio Investor Class Shares | 0 | -100,00 | 0 | -100,00 | ||||
| 2026-02-02 | 13F | New England Capital Financial Advisors LLC | 459 | 0,00 | 14 | 16,67 | ||||
| 2026-01-27 | 13F | TD Waterhouse Canada Inc. | 22.568 | 5.273,33 | 699 | 6.245,45 | ||||
| 2026-02-05 | 13F | Bessemer Group Inc | 252 | 0 | ||||||
| 2026-02-03 | 13F | Ballentine Partners, LLC | 7.356 | -9,31 | 228 | 2,24 | ||||
| 2025-09-25 | NP | DAADX - Emerging Markets ex China Core Equity Portfolio Institutional Class | 11.571 | 7,72 | 154 | -3,75 | ||||
| 2025-10-22 | 13F | CoreCap Advisors, LLC | 0 | -100,00 | 0 | |||||
| 2025-11-14 | 13F | Point72 Asia (Singapore) Pte. Ltd. | 19.692 | 543 | ||||||
| 2026-02-12 | 13F | Hrt Financial Lp | 8.979 | -82,91 | 0 | -100,00 | ||||
| 2026-02-13 | 13F | Citigroup Inc | 0 | -100,00 | 0 | |||||
| 2026-01-21 | 13F | Sound Income Strategies, LLC | 63 | 0,00 | 2 | 100,00 | ||||
| 2026-02-13 | 13F | Van Eck Associates Corp | 1.119.294 | -11,59 | 35 | 0,00 | ||||
| 2025-11-14 | 13F | Cubist Systematic Strategies, LLC | 78.190 | -52,01 | 2.158 | -0,60 | ||||
| 2026-02-10 | 13F | Bnp Paribas Arbitrage, Sa | 6.444 | 74,54 | 200 | 97,03 | ||||
| 2026-02-09 | 13F | Harbour Investments, Inc. | 10 | 0,00 | 0 | |||||
| 2026-02-12 | 13F | BlackRock, Inc. | 577.892 | -5,52 | 17.920 | 6,15 | ||||
| 2026-02-17 | 13F | Brevan Howard Capital Management LP | 0 | -100,00 | 0 | |||||
| 2026-02-12 | 13F | Skopos Labs, Inc. | 22.203 | -37,24 | 678 | -30,53 | ||||
| 2026-02-17 | 13F | Cetera Investment Advisers | 0 | -100,00 | 0 | |||||
| 2026-02-17 | 13F | Wellington Management Group Llp | 95.446 | -20,44 | 2.960 | -10,63 | ||||
| 2026-02-17 | 13F | Quantessence Capital LLC | 0 | -100,00 | 0 | |||||
| 2026-02-17 | 13F | Tower Research Capital LLC (TRC) | 0 | -100,00 | 0 | |||||
| 2026-02-06 | 13F/A | Rathbone Brothers plc | 16.890 | -36,44 | 524 | -28,65 | ||||
| 2026-02-12 | 13F | Renaissance Technologies Llc | 220.813 | -41,72 | 6.847 | -34,52 | ||||
| 2026-02-17 | 13F | Point72 Asset Management, L.P. | 0 | -100,00 | 0 | |||||
| 2026-01-28 | 13F | U S Global Investors Inc | 222.033 | 6,21 | 6.885 | 19,34 | ||||
| 2025-09-25 | NP | DFCEX - Emerging Markets Core Equity Portfolio - Institutional Class This fund is a listed as child fund of Dimensional Fund Advisors Lp and if that institution has disclosed ownership in this security, then these positions will not be double counted when calculating total shares and total value | 60.337 | 7,54 | 805 | -3,83 | ||||
| 2026-02-02 | 13F | PKO Investment Management Joint-Stock Co | 0 | -100,00 | 0 | |||||
| 2026-02-17 | 13F | Guggenheim Capital Llc | 15.618 | 0,22 | 484 | 12,56 | ||||
| 2026-02-10 | 13F | Quantbot Technologies LP | 0 | -100,00 | 0 | |||||
| 2026-02-17 | 13F | Advisory Services Network, LLC | 0 | -100,00 | 0 | |||||
| 2026-02-17 | 13F | Russell Investments Group, Ltd. | 3.530 | -51,45 | 110 | -45,00 | ||||
| 2025-11-14 | 13F | Wolverine Trading, Llc | Put | 13.600 | 375 | |||||
| 2026-02-13 | 13F | Rhumbline Advisers | 2.073 | -16,11 | 64 | -5,88 | ||||
| 2026-01-23 | 13F | Farther Finance Advisors, LLC | 2.256 | 33,49 | 70 | 50,00 | ||||
| 2026-02-17 | 13F | Bank Of America Corp /de/ | 16.389 | -55,31 | 508 | -49,80 | ||||
| 2025-11-14 | 13F | Wolverine Trading, Llc | 20.098 | 54,81 | 554 | 229,17 | ||||
| 2026-02-11 | 13F | Group One Trading, L.p. | Put | 17.800 | 1.518,18 | 552 | 1.736,67 | |||
| 2025-11-14 | 13F | Wolverine Trading, Llc | Call | 9.200 | 253 | |||||
| 2026-02-12 | 13F | Dimensional Fund Advisors Lp | 164.454 | 2,18 | 5.100 | 14,81 | ||||
| 2025-09-25 | NP | DEXC - Dimensional Emerging Markets ex China Core Equity ETF | 5.122 | 121,16 | 68 | 100,00 | ||||
| 2026-02-06 | 13F | FourThought Financial Partners, LLC | 9.680 | -19,82 | 300 | -9,91 | ||||
| 2026-01-29 | 13F | Ashton Thomas Private Wealth, LLC | 30.214 | -61,14 | 937 | -56,36 | ||||
| 2026-02-17 | 13F | Creative Planning | 20.921 | -2,02 | 649 | 10,02 | ||||
| 2026-02-03 | 13F | SBI Securities Co., Ltd. | 1.107 | 0,18 | 34 | 13,33 | ||||
| 2026-02-13 | 13F | Marshall Wace, Llp | 0 | -100,00 | 0 | |||||
| 2026-02-13 | 13F | Verition Fund Management LLC | 48.129 | 1.492 | ||||||
| 2026-02-12 | 13F | Campbell & CO Investment Adviser LLC | 26.451 | 3,50 | 820 | 16,31 | ||||
| 2026-02-17 | 13F | Royal Bank Of Canada | 7.837 | 70,22 | 243 | 91,34 | ||||
| 2026-01-23 | 13F | Financial Connections Group, Inc. | 537 | 0,00 | 0 | |||||
| 2025-11-20 | 13F | First Affirmative Financial Network | 8.545 | 236 | ||||||
| 2026-01-28 | 13F | Hoey Investments, Inc | 5 | 0,00 | 0 | |||||
| 2026-01-14 | 13F | Hennion & Walsh Asset Management, Inc. | 0 | -100,00 | 0 | -100,00 | ||||
| 2026-02-13 | 13F | S&t Bank/pa | 325 | 10 | ||||||
| 2026-02-13 | 13F | MAI Capital Management | 120 | 0,00 | 4 | 0,00 | ||||
| 2026-02-17 | 13F | Fmr Llc | 57 | 0,00 | 2 | 0,00 | ||||
| 2026-01-27 | 13F | WealthCollab, LLC | 465 | 0,00 | 14 | 16,67 | ||||
| 2025-09-25 | NP | DFA INVESTMENT DIMENSIONS GROUP INC - Emerging Markets Social Core Equity Portfolio Shares | 9.228 | 58,88 | 123 | 43,02 | ||||
| 2026-02-17 | 13F | DV Trading LLC | 6 | 0 | ||||||
| 2026-02-09 | 13F | Catalyst Funds Management Pty Ltd | 7.300 | 0,00 | 226 | 12,44 | ||||
| 2026-02-17 | 13F | Man Group plc | 62.310 | -50,54 | 1.932 | -44,43 | ||||
| 2026-01-29 | 13F | UBS Group AG | Call | 11.800 | 174,42 | 366 | 209,32 | |||
| 2026-02-11 | 13F | SmartHarvest Portfolios, LLC | 10.851 | 336 | ||||||
| 2026-01-29 | 13F | UBS Group AG | 92.164 | -40,03 | 2.858 | -32,61 | ||||
| 2026-02-13 | 13F | Towarzystwo Funduszy Inwestycyjnych Pzu Sa | 0 | -100,00 | 0 | |||||
| 2026-02-12 | 13F | Steward Partners Investment Advisory, Llc | 1.000 | 0,00 | 31 | 14,81 | ||||
| 2026-02-17 | 13F | ExodusPoint Capital Management, LP | 0 | -100,00 | 0 | -100,00 | ||||
| 2025-09-25 | NP | DFAX - Dimensional World ex U.S. Core Equity 2 ETF | 24.347 | 9,60 | 325 | -1,82 | ||||
| 2026-02-12 | 13F | Quadrant Capital Group Llc | 24.308 | -3,67 | 754 | 8,19 | ||||
| 2026-02-04 | 13F | Drive Wealth Management, Llc | 11.804 | -1,10 | 366 | 11,25 | ||||
| 2026-01-07 | 13F | Aventura Private Wealth, LLC | 4.876 | 0,00 | 151 | 12,69 | ||||
| 2026-01-30 | 13F | Us Bancorp \de\ | 0 | -100,00 | 0 | |||||
| 2026-01-20 | 13F | Signaturefd, Llc | 3.918 | 5,12 | 121 | 18,63 | ||||
| 2026-02-06 | 13F | Banque Cantonale Vaudoise | 1.366 | 42 | ||||||
| 2026-01-29 | 13F | IMC-Chicago, LLC | Put | 12.900 | 400 | |||||
| 2026-01-29 | 13F | IMC-Chicago, LLC | Call | 22.600 | 119,42 | 701 | 146,48 | |||
| 2026-02-17 | 13F | XTX Topco Ltd | 15.310 | 475 | ||||||
| 2026-02-11 | 13F | Group One Trading, L.p. | 2.820 | -57,01 | 87 | -51,93 | ||||
| 2026-02-11 | 13F | Simplex Trading, Llc | Put | 2.700 | -84,21 | 84 | ||||
| 2026-02-11 | 13F | Group One Trading, L.p. | Call | 4.600 | 6,98 | 143 | 20,34 | |||
| 2026-02-11 | 13F | Simplex Trading, Llc | 13.616 | 114,83 | 422 | |||||
| 2026-02-13 | 13F | American Century Companies Inc | 483.262 | -37,19 | 14.986 | -29,44 | ||||
| 2026-02-17 | 13F | Clear Street Markets Llc | Call | 25.000 | 775 | |||||
| 2026-01-29 | 13F | Sanctuary Advisors, LLC | 52.269 | -26,31 | 1.621 | -17,22 | ||||
| 2026-02-10 | 13F | Heritage Trust Co | 15.073 | 0,00 | 467 | 12,26 | ||||
| 2026-02-11 | 13F | Simplex Trading, Llc | Call | 5.700 | -64,38 | 177 | ||||
| 2026-02-18 | 13F | Cim, Llc | 17.775 | 551 | ||||||
| 2026-02-17 | 13F | Quadrature Capital Ltd | 9.921 | 308 | ||||||
| 2026-02-06 | 13F | EverSource Wealth Advisors, LLC | 4.836 | -10,23 | 150 | 0,68 | ||||
| 2026-02-13 | 13F | Wells Fargo & Company/mn | 6.733 | 127,01 | 209 | 156,79 | ||||
| 2026-01-23 | 13F | Assetmark, Inc | 116 | 0,00 | 4 | 0,00 | ||||
| 2026-02-13 | 13F | Y-Intercept (Hong Kong) Ltd | 7.808 | -77,37 | 242 | -74,58 | ||||
| 2026-02-02 | 13F | Benjamin Edwards Inc | 9.330 | -0,20 | 289 | 12,45 | ||||
| 2026-02-04 | 13F | Abc Arbitrage Sa | 127.033 | 107,22 | 3.939 | 132,94 | ||||
| 2026-02-17 | 13F | MIRAE ASSET GLOBAL ETFS HOLDINGS Ltd. | 60 | 2 | ||||||
| 2026-02-17 | 13F | Public Employees Retirement System Of Ohio | 128.995 | 11,08 | 4.000 | 24,80 | ||||
| 2026-02-12 | 13F | Bank Of Montreal /can/ | 7.969 | 247 | ||||||
| 2026-01-09 | 13F | Diversified Trust Co | 8.182 | 1,20 | 254 | 13,45 | ||||
| 2025-09-26 | NP | PMPIX - Precious Metals Ultrasector Profund Investor Class | 3.211 | 43 | ||||||
| 2026-02-17 | 13F | Millennium Management Llc | 102.111 | -74,28 | 3.166 | -71,11 | ||||
| 2026-02-18 | 13F | Vident Advisory, LLC | 64.317 | -23,74 | 1.994 | -14,31 | ||||
| 2026-02-11 | 13F | Jpmorgan Chase & Co | 7.956 | 48,52 | 247 | 67,35 | ||||
| 2026-02-17 | 13F | Amundi | 465.368 | -20,66 | 14.431 | -17,38 | ||||
| 2026-01-26 | 13F | Cwm, Llc | 49 | 0 | ||||||
| 2026-01-30 | 13F | Sigma Planning Corp | 8.543 | 3,64 | 265 | 16,30 | ||||
| 2026-02-13 | 13F | Sei Investments Co | 49.601 | 121,27 | 1.538 | 148,87 | ||||
| 2026-02-10 | 13F | Goldman Sachs Group Inc | 165.329 | -13,20 | 5.127 | -2,49 | ||||
| 2026-02-10 | 13F | Connor, Clark & Lunn Investment Management Ltd. | 653.566 | 14,50 | 20.267 | 28,65 | ||||
| 2026-02-17 | 13F | Caption Management, LLC | 21.000 | 0,00 | 651 | 12,44 |