Grundlæggende statistik
| Institutionelle aktier (lange) | 70.673.785 - 58,94% (ex 13D/G) - change of -5,36MM shares -7,04% MRQ |
| Institutionel værdi (lang) | $ 338.569 USD ($1000) |
Institutionelt ejerskab og aktionærer
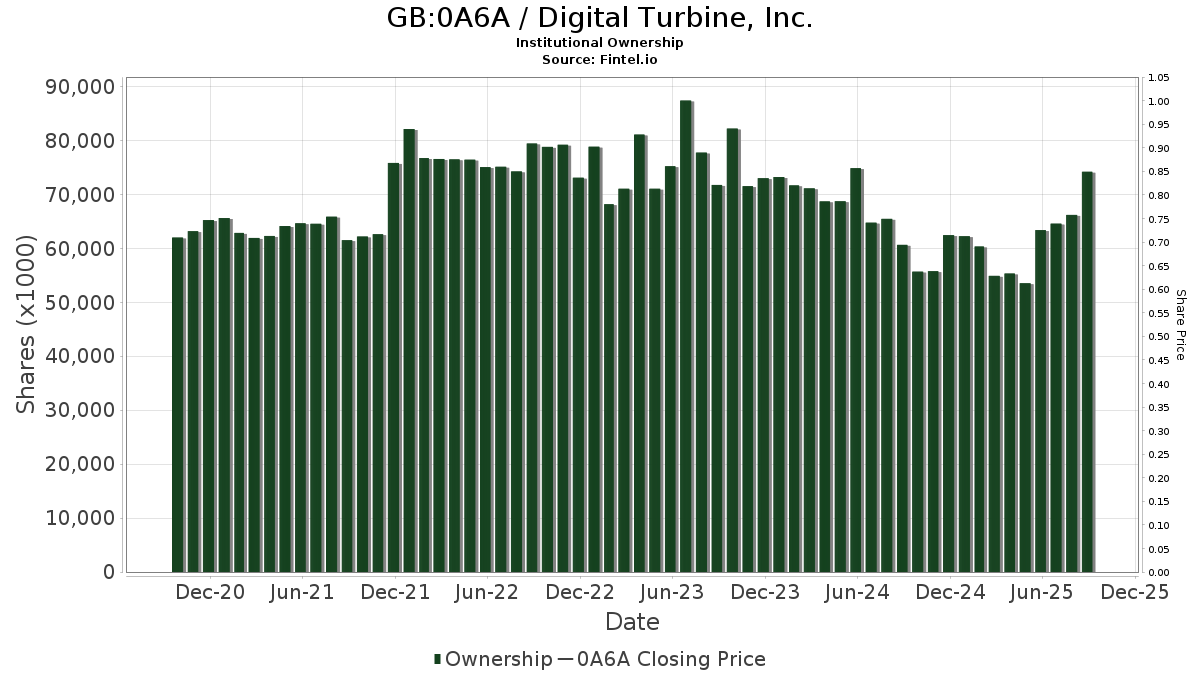
Digital Turbine, Inc. (GB:0A6A) har 200 institutionelle ejere og aktionærer, der har indsendt 13D/G- eller 13F-formularer til Securities Exchange Commission (SEC). Disse institutioner har i alt 70,673,785 aktier. Største aktionærer omfatter Vanguard Group Inc, BlackRock, Inc., Granahan Investment Management Inc/ma, Bank Of America Corp /de/, State Street Corp, Geode Capital Management, Llc, Arrowstreet Capital, Limited Partnership, Manatuck Hill Partners, LLC, Invesco Ltd., and Dimensional Fund Advisors Lp .
Digital Turbine, Inc. (LSE:0A6A) institutionel ejerskabsstruktur viser aktuelle positioner i virksomheden efter institutioner og fonde, samt seneste ændringer i positionsstørrelse. Større aktionærer kan omfatte individuelle investorer, investeringsforeninger, hedgefonde eller institutioner. Skema 13D angiver, at investoren besidder (eller besidder) mere end 5 % af virksomheden og har til hensigt (eller har til hensigt at) aktivt at forfølge en ændring i forretningsstrategi. Skema 13G indikerer en passiv investering på over 5%.
The share price as of April 10, 2026 is 2,84 / share. Previously, on December 2, 2025, the share price was 4,79 / share. This represents a decline of 40,70% over that period.
Fondens stemningsscore
Fund Sentiment Score (fka Ownership Accumulation Score) finder de aktier, der bliver mest købt af fonde. Det er resultatet af en sofistikeret, multi-faktor kvantitativ model, der identificerer virksomheder med de højeste niveauer af institutionel akkumulering. Scoringsmodellen bruger en kombination af den samlede stigning i oplyste ejere, ændringerne i porteføljeallokeringer i disse ejere og andre målinger. Tallet går fra 0 til 100, hvor højere tal indikerer et højere niveau af akkumulering for sine jævnaldrende, og 50 er gennemsnittet.
Opdateringsfrekvens: Dagligt
Se Ownership Explorer, som giver en liste over højest rangerende virksomheder.
AI+ Ask Fintel’s AI assistant about Digital Turbine, Inc..
Select a question to share a public post with an AI-crafted answer.
Thinking of good questions…
13F og NPORT arkivering
Detaljer om 13F-arkivering er gratis. Detaljer om NP-ansøgninger kræver et premium-medlemskab. Grønne rækker angiver nye positioner. Røde rækker angiver lukkede positioner. Klik på linket ikon for at se den fulde transaktionshistorik.
Opgrader
for at låse premium-data op og eksportere til Excel ![]() .
.
| Fil dato | Kilde | Investor | Type | Gennemsnitlig pris (Øst) |
Aktier | Δ Aktier (%) |
Rapporteret Værdi ($1000) |
Δ Værdi (%) |
Port Alloc (%) |
|
|---|---|---|---|---|---|---|---|---|---|---|
| 2026-02-17 | 13F | Cantor Fitzgerald, L. P. | 0 | -100,00 | 0 | -100,00 | ||||
| 2026-02-12 | 13F | Federation des caisses Desjardins du Quebec | 1.000 | 0,00 | 5 | -16,67 | ||||
| 2026-02-13 | 13F | American Century Companies Inc | 27.825 | 139 | ||||||
| 2026-02-12 | 13F | Bank Of Montreal /can/ | 58.487 | 0,00 | 292 | -21,93 | ||||
| 2026-02-17 | 13F | Granahan Investment Management Inc/ma | 6.349.463 | 11,12 | 31.747 | -13,19 | ||||
| 2026-02-17 | 13F | Balyasny Asset Management Llc | 0 | -100,00 | 0 | -100,00 | ||||
| 2026-02-17 | 13F | Optiver Holding B.V. | 14.079 | 1.747,64 | 70 | 1.650,00 | ||||
| 2026-02-11 | 13F | Cerity Partners LLC | 16.651 | 39,01 | 83 | 9,21 | ||||
| 2026-02-02 | 13F | AIGH Capital Management LLC | 0 | -100,00 | 0 | -100,00 | ||||
| 2026-02-13 | 13F | Sei Investments Co | 0 | -100,00 | 0 | -100,00 | ||||
| 2026-02-06 | 13F | Covestor Ltd | 24 | 0,00 | 0 | |||||
| 2025-11-06 | 13F | Versor Investments LP | 0 | -100,00 | 0 | -100,00 | ||||
| 2026-02-13 | 13F | Victory Capital Management Inc | 11.268 | 4,57 | 56 | -17,65 | ||||
| 2026-04-07 | 13F | Farther Finance Advisors, LLC | 72 | -77,14 | 0 | -100,00 | ||||
| 2026-01-28 | 13F | Quaker Wealth Management, LLC | 0 | -100,00 | 0 | -100,00 | ||||
| 2026-02-10 | 13F | Goldman Sachs Group Inc | 663.773 | -45,21 | 3.319 | -57,20 | ||||
| 2025-11-13 | 13F | Employees Retirement System of Texas | 0 | -100,00 | 0 | |||||
| 2026-02-17 | 13F | Millennium Management Llc | 128.540 | 643 | ||||||
| 2025-11-14 | 13F | Axa S.a. | 0 | -100,00 | 0 | -100,00 | ||||
| 2026-02-13 | 13F | Arrowstreet Capital, Limited Partnership | 2.129.363 | -12,35 | 10.647 | -31,53 | ||||
| 2026-02-10 | 13F | State of Wyoming | 0 | -100,00 | 0 | |||||
| 2026-02-10 | 13F | Bnp Paribas Arbitrage, Sa | 73.265 | -13,26 | 366 | -32,22 | ||||
| 2026-02-17 | 13F | Manatuck Hill Partners, LLC | 2.000.000 | 233,33 | 10.000 | 160,42 | ||||
| 2026-02-17 | 13F | Citadel Advisors Llc | Put | 290.000 | 43,99 | 1.450 | 12,58 | |||
| 2026-02-06 | 13F | HighTower Advisors, LLC | 145.413 | 0,57 | 727 | -21,41 | ||||
| 2026-02-12 | 13F | Gagnon Securities Llc | 81.839 | 0,00 | 409 | -21,80 | ||||
| 2026-02-02 | 13F | Oppenheimer & Co Inc | 14.735 | -21,55 | 74 | -39,17 | ||||
| 2026-02-17 | 13F | Worth Venture Partners, LLC | 85.125 | 34,32 | 426 | 4,94 | ||||
| 2026-03-04 | 13F | Leonteq Securities AG | 0 | -100,00 | 0 | -100,00 | ||||
| 2026-01-27 | 13F | Belpointe Asset Management LLC | 11.918 | -6,84 | 60 | -27,16 | ||||
| 2026-02-17 | 13F | Trexquant Investment LP | 407.097 | 2.035 | ||||||
| 2026-01-21 | 13F | SJS Investment Consulting Inc. | 36 | 0 | ||||||
| 2026-02-13 | 13F | S Squared Technology, LLC | 653.571 | 12,96 | 3.268 | -11,75 | ||||
| 2026-02-17 | 13F | CastleKnight Management LP | 70.100 | 0,00 | 350 | -21,87 | ||||
| 2026-01-26 | 13F | Cwm, Llc | 42.083 | 22,08 | 0 | |||||
| 2026-02-10 | 13F | Rothschild Investment Llc | 38 | 0 | ||||||
| 2026-02-17 | 13F | Bayesian Capital Management, LP | 0 | -100,00 | 0 | -100,00 | ||||
| 2026-02-10 | 13F/A | Northwestern Mutual Wealth Management Co | 716 | 0,42 | 4 | -25,00 | ||||
| 2026-02-13 | 13F | Police & Firemen's Retirement System of New Jersey | 28.096 | 0,00 | 140 | -21,79 | ||||
| 2026-02-05 | 13F | Allworth Financial LP | 4.674 | 9,82 | 23 | -14,81 | ||||
| 2026-02-13 | 13F | Panagora Asset Management Inc | 103.448 | 517 | ||||||
| 2026-02-10 | 13F | Intech Investment Management Llc | 36.238 | -13,19 | 181 | -32,21 | ||||
| 2026-02-17 | 13F | G2 Investment Partners Management LLC | 1.404.079 | -18,30 | 7.020 | -36,18 | ||||
| 2026-02-11 | 13F | LPL Financial LLC | 62.458 | 5,83 | 312 | -17,24 | ||||
| 2026-02-13 | 13F | Kilter Group LLC | 0 | -100,00 | 0 | |||||
| 2026-02-17 | 13F | Citadel Advisors Llc | Call | 335.400 | -17,87 | 1.677 | -35,82 | |||
| 2026-02-17 | 13F | Citadel Advisors Llc | 1.074.205 | 35,12 | 5.371 | 5,56 | ||||
| 2025-11-12 | 13F | Catalyst Funds Management Pty Ltd | 0 | -100,00 | 0 | |||||
| 2026-01-27 | 13F | TD Waterhouse Canada Inc. | 1 | 0,00 | 0 | |||||
| 2026-02-17 | 13F | Soviero Asset Management, LP | 240.000 | 1.200 | ||||||
| 2026-02-06 | 13F | ProShare Advisors LLC | 19.816 | 10,64 | 99 | -13,16 | ||||
| 2026-01-30 | 13F | Catalytic Wealth RIA, LLC | 406.139 | 0,00 | 2.031 | -21,89 | ||||
| 2026-03-12 | 13F/A | Peak6 Llc | Call | 0 | -100,00 | 0 | -100,00 | |||
| 2026-02-06 | 13F | Global Retirement Partners, LLC | 492 | 0,00 | 2 | -33,33 | ||||
| 2026-02-05 | 13F | Baader Bank INC | 252.436 | -18,74 | 1.262 | -35,89 | ||||
| 2026-02-10 | 13F | Envestnet Asset Management Inc | 15.531 | 3,54 | 78 | -19,79 | ||||
| 2026-02-06 | 13F | Kingdom Financial Group LLC. | 67.066 | 335 | ||||||
| 2026-02-12 | 13F | Wedbush Securities Inc | 10.400 | 0,00 | 0 | |||||
| 2026-02-17 | 13F | Two Sigma Advisers, Lp | 184.374 | 30,79 | 922 | 2,11 | ||||
| 2026-02-17 | 13F | Royal Bank Of Canada | 46.526 | 1.297,18 | 232 | 1.004,76 | ||||
| 2026-02-17 | 13F | Susquehanna International Group, Llp | Call | 874.000 | -8,17 | 4.370 | -28,25 | |||
| 2026-02-17 | 13F | Susquehanna International Group, Llp | 14.647 | -9,46 | 73 | -29,13 | ||||
| 2026-02-17 | 13F | Susquehanna International Group, Llp | Put | 272.800 | 44,26 | 1.364 | 12,73 | |||
| 2025-10-20 | 13F | Allspring Global Investments Holdings, LLC | 0 | -100,00 | 0 | -100,00 | ||||
| 2025-11-14 | 13F | Wolverine Trading, Llc | 0 | -100,00 | 0 | -100,00 | ||||
| 2026-02-18 | 13F | Mackenzie Financial Corp | 99.772 | 502 | ||||||
| 2026-02-17 | 13F | D. E. Shaw & Co., Inc. | Put | 50.000 | 0,00 | 250 | -21,87 | |||
| 2026-01-29 | 13F | UBS Group AG | 779.585 | 443,95 | 3.898 | 324,97 | ||||
| 2026-04-08 | 13F | Wealth Enhancement Advisory Services, Llc | 34.154 | 2,63 | 99 | -42,01 | ||||
| 2026-02-13 | 13F | Natixis | 79.300 | 396 | ||||||
| 2026-01-28 | 13F | Legacy Capital Group California, Inc. | 0 | -100,00 | 0 | -100,00 | ||||
| 2026-02-12 | 13F | Hrt Financial Lp | 810.647 | 24,48 | 4 | 0,00 | ||||
| 2026-02-17 | 13F | Silvercrest Asset Management Group Llc | 1.041.060 | 70,62 | 5.205 | 33,29 | ||||
| 2026-02-17 | 13F | Advisor Group Holdings, Inc. | 20.748 | -34,67 | 104 | -30,87 | ||||
| 2026-02-09 | 13F | Geode Capital Management, Llc | 2.528.772 | 4,59 | 12.646 | -18,29 | ||||
| 2026-01-30 | 13F | Activest Wealth Management | 1.000 | 0,00 | 5 | -16,67 | ||||
| 2026-02-17 | 13F | Tower Research Capital LLC (TRC) | 2.560 | -41,55 | 13 | -57,14 | ||||
| 2026-02-17 | 13F | D. E. Shaw & Co., Inc. | 1.163.178 | -59,90 | 5.816 | -68,68 | ||||
| 2026-02-17 | 13F | Price T Rowe Associates Inc /md/ | 140.271 | 2,46 | 1 | |||||
| 2026-02-11 | 13F | Simplex Trading, Llc | Put | 97.000 | -16,09 | 485 | ||||
| 2025-11-14 | 13F | AXA Investment Managers S.A. | 49.455 | 317 | ||||||
| 2026-02-17 | 13F | Algert Global Llc | 207.040 | 1 | ||||||
| 2025-11-03 | 13F | Cypress Capital Management LLC (WY) | 0 | -100,00 | 0 | -100,00 | ||||
| 2026-02-04 | 13F | Legacy Financial Advisors, Inc. | 19.124 | 0,65 | 96 | -21,49 | ||||
| 2026-02-06 | 13F | Pnc Financial Services Group, Inc. | 16.620 | 701,35 | 83 | 538,46 | ||||
| 2026-02-17 | 13F | Schonfeld Strategic Advisors LLC | 14.956 | 75 | ||||||
| 2026-02-02 | 13F | CX Institutional | 0 | -100,00 | 0 | |||||
| 2026-02-13 | 13F | Barclays Plc | 859.408 | 1,72 | 4.297 | -20,53 | ||||
| 2026-02-14 | 13F | Rockefeller Capital Management L.P. | 348 | 2 | ||||||
| 2026-02-17 | 13F | State Of Wisconsin Investment Board | 40.528 | -36,25 | 203 | -50,25 | ||||
| 2025-11-21 | 13F/A | CIBC Bancorp USA Inc. | 11.166 | 71 | ||||||
| 2026-02-17 | 13F | Russell Investments Group, Ltd. | 186.924 | -8,68 | 935 | -28,70 | ||||
| 2026-02-17 | 13F | Alliancebernstein L.p. | 140.970 | -0,07 | 705 | -21,95 | ||||
| 2026-02-12 | 13F | BlackRock, Inc. | 9.026.700 | 3,57 | 45.134 | -19,08 | ||||
| 2026-02-12 | 13F | Dimensional Fund Advisors Lp | 1.507.478 | 24,72 | 7.538 | -2,50 | ||||
| 2026-02-10 | 13F | P.a.w. Capital Corp | 290.000 | -10,77 | 1.450 | -30,29 | ||||
| 2026-02-13 | 13F | Walleye Trading LLC | Put | 4.200 | 61,54 | 21 | 31,25 | |||
| 2026-02-02 | 13F | Strs Ohio | 1.000 | 0,00 | 5 | -16,67 | ||||
| 2026-02-13 | 13F | Walleye Trading LLC | Call | 35.000 | 243,14 | 175 | 169,23 | |||
| 2026-01-15 | 13F | Fortitude Family Office, LLC | 106 | 0,00 | 1 | |||||
| 2026-04-13 | 13F | IFP Advisors, Inc | 595 | -52,13 | 2 | -83,33 | ||||
| 2026-01-29 | 13F | Sanctuary Advisors, LLC | 46.654 | 302,71 | 233 | 214,86 | ||||
| 2026-02-13 | 13F | MYDA Advisors LLC | 0 | -100,00 | 0 | -100,00 | ||||
| 2026-02-10 | 13F | Quantbot Technologies LP | 95.179 | -8,79 | 476 | -28,79 | ||||
| 2026-02-10 | 13F | Connor, Clark & Lunn Investment Management Ltd. | 0 | -100,00 | 0 | |||||
| 2026-02-10 | 13F | Bank of New York Mellon Corp | 390.698 | 34,36 | 1.953 | 4,94 | ||||
| 2026-02-04 | 13F | Ameritas Advisory Services, LLC | 0 | -100,00 | 0 | -100,00 | ||||
| 2026-02-13 | 13F | Mariner, LLC | 54.562 | -54,65 | 273 | -64,63 | ||||
| 2026-02-06 | 13F | Gsa Capital Partners Llp | 189.394 | 890,24 | 1 | |||||
| 2026-02-12 | 13F | Renaissance Technologies Llc | 742.300 | 3.712 | ||||||
| 2026-02-13 | 13F | Citigroup Inc | 301.060 | -4,98 | 1.505 | -25,75 | ||||
| 2026-02-17 | 13F | Tudor Investment Corp Et Al | 368.310 | 740,31 | 1.842 | 557,50 | ||||
| 2025-11-14 | 13F | Hamilton Wealth, LLC | 0 | -100,00 | 0 | -100,00 | ||||
| 2026-02-11 | 13F | Simplex Trading, Llc | 81.105 | -20,10 | 406 | |||||
| 2026-02-17 | 13F | Bank Of America Corp /de/ | 3.084.002 | 14,76 | 15.420 | -10,34 | ||||
| 2026-02-11 | 13F | Simplex Trading, Llc | Call | 104.100 | -9,79 | 520 | ||||
| 2026-02-17 | 13F | XTX Topco Ltd | 196.075 | 21,33 | 980 | -5,22 | ||||
| 2026-04-07 | 13F/A | Round Rock Advisors, LLC | 93.689 | 468 | ||||||
| 2026-02-04 | 13F | Perkins Capital Management Inc | 366.100 | -5,18 | 1.830 | -25,94 | ||||
| 2026-02-13 | 13F | Charles Schwab Investment Management Inc | 852.731 | 1,43 | 4.264 | -20,76 | ||||
| 2026-02-13 | 13F | SRS Capital Advisors, Inc. | 25 | -94,19 | 0 | -100,00 | ||||
| 2026-02-09 | 13F | Annis Gardner Whiting Capital Advisors, LLC | 600 | 0,00 | 3 | 0,00 | ||||
| 2026-01-15 | 13F | Nisa Investment Advisors, Llc | 8.525 | -6,47 | 43 | -27,59 | ||||
| 2026-02-13 | 13F | Altrafin AG | 0 | -100,00 | 0 | |||||
| 2025-11-13 | 13F | Marshall Wace, Llp | 0 | -100,00 | 0 | -100,00 | ||||
| 2025-11-14 | 13F | Walleye Capital LLC | Put | 0 | -100,00 | 0 | -100,00 | |||
| 2026-02-13 | 13F | Verition Fund Management LLC | 286.616 | 173,35 | 1.433 | 113,56 | ||||
| 2026-02-17 | 13F | Creative Planning | 25.237 | 8,38 | 126 | -15,44 | ||||
| 2026-02-13 | 13F | Walleye Trading LLC | 10.435 | 1,92 | 52 | -20,00 | ||||
| 2026-02-10 | 13F | Cherry Tree Wealth Management, LLC | 4.000 | -20,00 | 20 | -37,50 | ||||
| 2026-02-13 | 13F | Herald Investment Management Ltd | 600.000 | 0,00 | 2.994 | -22,03 | ||||
| 2026-04-06 | 13F | GAMMA Investing LLC | 560 | -61,90 | 2 | -85,71 | ||||
| 2025-11-14 | 13F | Wolverine Trading, Llc | Call | 163.000 | 54,06 | 968 | 59,74 | |||
| 2025-11-14 | 13F | Wolverine Trading, Llc | Put | 42.000 | -29,53 | 249 | -26,98 | |||
| 2026-02-13 | 13F | Squarepoint Ops LLC | 919.027 | -5,65 | 4.595 | -26,29 | ||||
| 2026-02-13 | 13F | Segall Bryant & Hamill, Llc | 0 | -100,00 | 0 | |||||
| 2026-01-28 | 13F | Universal- Beteiligungs- und Servicegesellschaft mbH | 255.499 | -16,37 | 1.288 | -34,17 | ||||
| 2026-02-11 | 13F | Ameritas Investment Partners, Inc. | 9.410 | 0,00 | 47 | -21,67 | ||||
| 2026-02-12 | 13F | New York State Common Retirement Fund | 24.929 | 0,00 | 125 | -22,01 | ||||
| 2026-02-13 | 13F | Squarepoint Ops LLC | Call | 29.700 | 4,21 | 148 | -18,68 | |||
| 2026-02-17 | 13F | Quadrature Capital Ltd | 29.277 | 146 | ||||||
| 2026-02-13 | 13F | Squarepoint Ops LLC | Put | 16.500 | 5,10 | 82 | -18,00 | |||
| 2026-02-05 | 13F | Plancorp, LLC | 0 | -100,00 | 0 | -100,00 | ||||
| 2026-02-05 | 13F | Stoneridge Investment Partners Llc | 32.663 | 19,96 | 0 | |||||
| 2026-02-17 | 13F | Cape Investment Advisory, Inc. | 400 | 2 | ||||||
| 2026-02-20 | 13F | Sunbelt Securities, Inc. | 1.823 | 0,00 | 9 | -18,18 | ||||
| 2026-02-17 | 13F | Quantinno Capital Management LP | 30.300 | 152 | ||||||
| 2026-02-12 | 13F | EntryPoint Capital, LLC | 16.778 | 45,68 | 84 | 13,70 | ||||
| 2026-03-26 | 13F | Leonteq Securities AG | Put | 0 | -100,00 | 0 | -100,00 | |||
| 2026-02-13 | 13F | Prudential Financial Inc | 263.474 | 2.012,19 | 1.317 | 1.567,09 | ||||
| 2025-11-14 | 13F | Ubs Asset Management Americas Inc | 0 | -100,00 | 0 | -100,00 | ||||
| 2026-02-13 | 13F | State Street Corp | 2.789.126 | -2,85 | 13.946 | -24,10 | ||||
| 2025-11-14 | 13F | Cubist Systematic Strategies, LLC | Call | 117.300 | -60,12 | 751 | -56,77 | |||
| 2025-11-14 | 13F | Cubist Systematic Strategies, LLC | Put | 43.200 | -69,45 | 276 | -66,91 | |||
| 2026-01-23 | 13F | State of Alaska, Department of Revenue | 60.550 | 1.126,95 | 0 | |||||
| 2026-02-13 | 13F | C M Bidwell & Associates Ltd | 0 | -100,00 | 0 | |||||
| 2026-02-17 | 13F | Oxford Asset Management Llp | 17.391 | 87 | ||||||
| 2026-02-13 | 13F | Caitong International Asset Management Co., Ltd | 1.563 | 8 | ||||||
| 2026-02-12 | 13F | DRW Securities, LLC | 13.284 | 66 | ||||||
| 2026-02-13 | 13F | Sterling Capital Management LLC | 2.651 | -1,38 | 13 | -23,53 | ||||
| 2026-02-17 | 13F | California State Teachers Retirement System | 6.675 | -4,05 | 33 | -25,00 | ||||
| 2026-02-11 | 13F | O'shaughnessy Asset Management, Llc | 13.180 | 23,83 | 66 | -4,41 | ||||
| 2026-02-18 | 13F/A | Fuller & Thaler Asset Management, Inc. | 128.420 | -1,80 | 642 | -23,21 | ||||
| 2026-02-12 | 13F | Counterpoint Mutual Funds LLC | 634.542 | 634,81 | 3.173 | 474,64 | ||||
| 2026-02-13 | 13F | Ieq Capital, Llc | 81.604 | 92,33 | 408 | 50,55 | ||||
| 2026-02-12 | 13F | Jane Street Group, Llc | 959.412 | 617,49 | 4.797 | 461,05 | ||||
| 2026-02-17 | 13F | MIRAE ASSET GLOBAL ETFS HOLDINGS Ltd. | 50.200 | 3,16 | 251 | -19,29 | ||||
| 2026-03-06 | 13F | Hsbc Holdings Plc | 56.994 | -4,54 | 288 | -19,33 | ||||
| 2026-01-30 | 13F | Us Bancorp \de\ | 1.032 | 21,55 | 5 | 0,00 | ||||
| 2026-02-12 | 13F | Jane Street Group, Llc | Put | 104.700 | -25,16 | 524 | -41,56 | |||
| 2026-02-12 | 13F | Jane Street Group, Llc | Call | 108.100 | 253,27 | 540 | 176,92 | |||
| 2026-02-17 | 13F | Strive Financial Group ,LLC | 1.300 | 6 | ||||||
| 2026-02-12 | 13F | Steward Partners Investment Advisory, Llc | 1.120 | 115,38 | 6 | 66,67 | ||||
| 2026-02-12 | 13F | Nuveen, LLC | 355.731 | -7,73 | 1.779 | -27,93 | ||||
| 2026-02-13 | 13F | Smartleaf Asset Management LLC | 10.063 | 0,02 | 51 | -15,25 | ||||
| 2025-11-06 | 13F | Cornerstone Investment Partners, LLC | 0 | -100,00 | 0 | -100,00 | ||||
| 2026-02-17 | 13F | Capstone Investment Advisors, Llc | 0 | -100,00 | 0 | -100,00 | ||||
| 2026-02-13 | 13F | Wells Fargo & Company/mn | 162.359 | 4,68 | 812 | -18,25 | ||||
| 2025-11-13 | 13F | MYDA Advisors LLC | Call | 0 | -100,00 | 0 | -100,00 | |||
| 2026-01-21 | 13F | Sound Income Strategies, LLC | 1 | 0,00 | 0 | |||||
| 2025-11-14 | 13F | Binnacle Investments Inc | 30 | 0 | ||||||
| 2026-02-17 | 13F | Aqr Capital Management Llc | 928.392 | 24,71 | 4.642 | -2,58 | ||||
| 2026-02-06 | 13F | EverSource Wealth Advisors, LLC | 2.078 | 47,06 | 10 | 11,11 | ||||
| 2026-02-17 | 13F | Sherbrooke Park Advisers Llc | 12.692 | 63 | ||||||
| 2026-02-11 | 13F | Deutsche Bank Ag\ | 101.736 | 3,97 | 509 | -18,85 | ||||
| 2026-02-05 | 13F | Amalgamated Bank | 3.406 | 5,97 | 0 | |||||
| 2026-02-17 | 13F | Point72 Asset Management, L.P. | Put | 69.000 | 345 | |||||
| 2026-02-13 | 13F | Quarry LP | 5.594 | 1.323,41 | 28 | 1.250,00 | ||||
| 2026-02-17 | 13F | Point72 Asset Management, L.P. | Call | 168.300 | 842 | |||||
| 2026-02-17 | 13F | Point72 Asset Management, L.P. | 267.519 | 1.338 | ||||||
| 2026-02-17 | 13F | Lazard Asset Management Llc | 13.068 | -25,20 | 65 | -41,44 | ||||
| 2026-02-17 | 13F | Polymer Capital Management (US) LLC | 13.202 | 66 | ||||||
| 2026-01-12 | 13F | Thompson Davis & Co., Inc. | 13.350 | 67 | ||||||
| 2026-02-13 | 13F | Parkside Financial Bank & Trust | 175 | 0,00 | 1 | -100,00 | ||||
| 2026-01-26 | 13F | Whittier Trust Co | 110 | -27,63 | 1 | |||||
| 2026-02-09 | 13F | Hartland & Co., LLC | 0 | -100,00 | 0 | -100,00 | ||||
| 2026-04-13 | 13F | True Wealth Design, LLC | 159 | 152,38 | 0 | |||||
| 2026-02-13 | 13F | Manufacturers Life Insurance Company, The | 32.488 | -4,49 | 162 | -25,35 | ||||
| 2026-02-17 | 13F | Boothbay Fund Management, Llc | 331.699 | -15,39 | 1.658 | -33,92 | ||||
| 2026-02-17 | 13F | Tenzing Global Management, LLC | 0 | -100,00 | 0 | -100,00 | ||||
| 2026-02-17 | 13F | Northern Trust Corp | 820.336 | -4,32 | 4.102 | -25,26 | ||||
| 2026-01-29 | 13F | IMC-Chicago, LLC | 40.047 | -51,12 | 200 | -61,83 | ||||
| 2026-01-29 | 13F | IMC-Chicago, LLC | Put | 211.200 | -1,26 | 1.056 | -22,81 | |||
| 2026-01-29 | 13F | IMC-Chicago, LLC | Call | 369.500 | 70,36 | 1.848 | 33,07 | |||
| 2026-02-12 | 13F | Voya Investment Management Llc | 18.806 | 0,00 | 94 | -21,67 | ||||
| 2026-01-22 | 13F | Vision Financial Markets Llc | 100 | 0,00 | 0 | |||||
| 2026-02-11 | 13F | Jpmorgan Chase & Co | 567.520 | -7,43 | 2.838 | -27,68 | ||||
| 2025-11-14 | 13F | Garden State Investment Advisory Services LLC | 0 | -100,00 | 0 | -100,00 | ||||
| 2026-01-26 | 13F | Brendel Financial Advisors LLC | 68.007 | 2,30 | 340 | -20,00 | ||||
| 2025-11-14 | 13F | EAM Investors, LLC | 0 | -100,00 | 0 | |||||
| 2026-02-17 | 13F | Engineers Gate Manager LP | 209.720 | 1.049 | ||||||
| 2026-02-17 | 13F | PharVision Advisers, LLC | 82.744 | 414 | ||||||
| 2026-02-17 | 13F | Brevan Howard Capital Management LP | 12.043 | -45,45 | 60 | -57,45 | ||||
| 2026-02-17 | 13F | VARCOV Co. | 46.465 | 232 | ||||||
| 2026-02-18 | 13F | GWM Advisors LLC | 1.075 | 5 | ||||||
| 2026-02-17 | 13F | Scientech Research LLC | 11.652 | 58 | ||||||
| 2026-01-13 | 13F | Stonehage Fleming Financial Services Holdings Ltd | 49.920 | 250 | ||||||
| 2026-01-29 | 13F | Vanguard Group Inc | 9.101.779 | 0,33 | 45.509 | -21,62 | ||||
| 2025-10-20 | 13F | Calamos Advisors LLC | 0 | -100,00 | 0 | -100,00 | ||||
| 2026-03-30 | 13F/A | Barclays Plc | Call | 0 | -100,00 | 0 | -100,00 | |||
| 2026-02-12 | 13F | State Board Of Administration Of Florida Retirement System | 32.057 | 0,00 | 160 | -21,95 | ||||
| 2026-02-12 | 13F | Commonwealth Equity Services, Llc | 37.627 | 11,97 | 188 | |||||
| 2026-01-21 | 13F | Greenleaf Trust | 19.542 | 0,00 | 98 | -22,40 | ||||
| 2026-02-06 | 13F/A | Rathbone Brothers plc | 101.015 | 0,00 | 505 | -21,83 | ||||
| 2026-02-11 | 13F | Meeder Asset Management Inc | 4.282 | 0,00 | 21 | -22,22 | ||||
| 2025-11-12 | 13F | Headlands Technologies LLC | 0 | -100,00 | 0 | |||||
| 2026-02-12 | 13F | Hollencrest Capital Management | 1.200 | 0,00 | 6 | -14,29 | ||||
| 2026-02-13 | 13F | Colony Group, LLC | 0 | -100,00 | 0 | -100,00 | ||||
| 2026-02-13 | 13F | Rhumbline Advisers | 132.994 | -12,47 | 665 | -31,69 | ||||
| 2026-02-17 | 13F | Jones Financial Companies Lllp | 1.723 | 11.386,67 | 9 | |||||
| 2026-02-12 | 13F | MetLife Investment Management, LLC | 51.209 | -14,36 | 256 | -32,98 | ||||
| 2026-02-09 | 13F | Legal & General Group Plc | 11.158 | 5,03 | 56 | -19,12 | ||||
| 2026-02-13 | 13F | Walleye Capital LLC | Call | 59.000 | 295 | |||||
| 2026-02-17 | 13F | SageView Advisory Group, LLC | 100 | 0 | ||||||
| 2026-02-13 | 13F | Walleye Capital LLC | 3.945 | 20 | ||||||
| 2026-02-10 | 13F | Acadian Asset Management Llc | 596.145 | 12,10 | 3 | -33,33 | ||||
| 2026-02-17 | 13F | Raymond James Financial Inc | 300.483 | -16,02 | 1.502 | -34,38 | ||||
| 2026-02-17 | 13F | Captrust Financial Advisors | 12.379 | 20,00 | 62 | -7,58 | ||||
| 2026-01-09 | 13F | SG Americas Securities, LLC | 176.354 | -3,46 | 1 | -100,00 | ||||
| 2026-02-17 | 13F | Mercer Global Advisors Inc /adv | 14.541 | 73 | ||||||
| 2026-02-13 | 13F | Morgan Stanley | 1.427.510 | -12,36 | 7.138 | -31,53 | ||||
| 2026-01-14 | 13F | Pallas Capital Advisors LLC | 15.144 | 7,91 | 76 | -15,73 | ||||
| 2026-02-13 | 13F | Pin Oak Investment Advisors Inc | 313 | 0,00 | 0 | -100,00 | ||||
| 2026-02-11 | 13F | Franklin Resources Inc | 50.331 | -5,29 | 252 | -26,18 | ||||
| 2026-02-05 | 13F | Cambridge Investment Research Advisors, Inc. | 0 | -100,00 | 0 | |||||
| 2026-01-26 | 13F | PFG Investments, LLC | 10.032 | 50 | ||||||
| 2026-02-05 | 13F | HighMark Wealth Management LLC | 150 | -51,61 | 1 | -100,00 | ||||
| 2025-10-21 | 13F | McElhenny Sheffield Capital Management, LLC | 0 | -100,00 | 0 | -100,00 | ||||
| 2025-11-14 | 13F | Strategic Wealth Partners, Ltd. | 2.105 | 13 | ||||||
| 2026-04-06 | 13F | Versant Capital Management, Inc | 0 | -100,00 | 0 | |||||
| 2026-02-17 | 13F | Two Sigma Investments, Lp | 1.246.343 | 28,80 | 6.232 | 0,61 | ||||
| 2026-02-04 | 13F | Bailard, Inc. | 45.829 | 229 | ||||||
| 2026-02-17 | 13F | Jump Financial, LLC | 130.756 | 654 | ||||||
| 2026-02-10 | 13F | Lido Advisors, LLC | 39.256 | 0,00 | 251 | 0,00 | ||||
| 2026-02-11 | 13F | Parallel Advisors, LLC | 157 | 0,00 | 1 | -100,00 | ||||
| 2026-02-17 | 13F | Graham Capital Management, L.P. | 27.659 | -54,81 | 138 | -64,71 | ||||
| 2026-02-17 | 13F | Cetera Investment Advisers | 19.509 | 46,95 | 98 | 15,48 | ||||
| 2026-01-09 | 13F | Diversified Trust Co | 26.300 | 132 | ||||||
| 2026-01-20 | 13F | Harbor Capital Advisors, Inc. | 692.459 | -14,32 | 3 | -40,00 | ||||
| 2026-02-03 | 13F | SBI Securities Co., Ltd. | 8.666 | -47,52 | 43 | -59,05 | ||||
| 2025-10-30 | 13F | Twin Peaks Wealth Advisors, LLC | 0 | -100,00 | 0 | |||||
| 2026-02-10 | 13F | Axq Capital, Lp | 25.586 | 128 | ||||||
| 2026-02-11 | 13F | Group One Trading, L.p. | Put | 90.900 | -18,18 | 454 | -36,15 | |||
| 2026-02-11 | 13F | Group One Trading, L.p. | Call | 457.100 | 25,34 | 2.286 | -2,10 | |||
| 2026-02-19 | 13F | Invesco Ltd. | 1.829.003 | 368,95 | 9.145 | 266,39 | ||||
| 2025-11-14 | 13F | Driehaus Capital Management Llc | 0 | -100,00 | 0 | -100,00 | ||||
| 2026-03-26 | 13F | Leonteq Securities AG | Call | 0 | -100,00 | 0 | -100,00 | |||
| 2026-02-13 | 13F | MAI Capital Management | 16.844 | 0,15 | 84 | -21,50 | ||||
| 2026-02-17 | 13F | Fmr Llc | 47.960 | 26,02 | 240 | -1,65 | ||||
| 2026-02-12 | 13F | Cibc World Markets Corp | 0 | -100,00 | 0 | -100,00 |