Grundlæggende statistik
| Institutionelle aktier (lange) | 32.545.049 - 35,16% (ex 13D/G) - change of 3,31MM shares 11,32% MRQ |
| Institutionel værdi (lang) | $ 152.896 USD ($1000) |
Institutionelt ejerskab og aktionærer
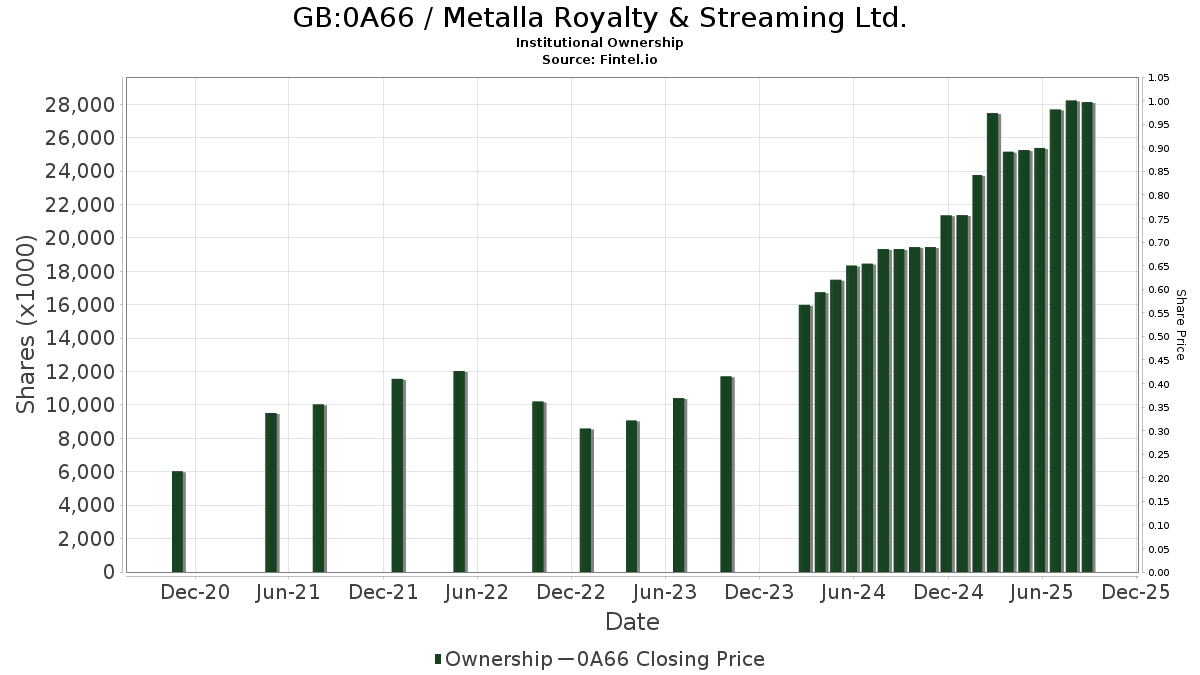
Metalla Royalty & Streaming Ltd. (GB:0A66) har 91 institutionelle ejere og aktionærer, der har indsendt 13D/G- eller 13F-formularer til Securities Exchange Commission (SEC). Disse institutioner har i alt 32,545,049 aktier. Største aktionærer omfatter Euro Pacific Asset Management, LLC, EPGFX - EuroPac Gold Fund Class A, Merk Investments LLC, ASA Gold & Precious Metals Ltd, Van Eck Associates Corp, Fmr Llc, Global Strategic Management Inc, U S Global Investors Inc, Sprott Inc., and Mackenzie Financial Corp .
Metalla Royalty & Streaming Ltd. (LSE:0A66) institutionel ejerskabsstruktur viser aktuelle positioner i virksomheden efter institutioner og fonde, samt seneste ændringer i positionsstørrelse. Større aktionærer kan omfatte individuelle investorer, investeringsforeninger, hedgefonde eller institutioner. Skema 13D angiver, at investoren besidder (eller besidder) mere end 5 % af virksomheden og har til hensigt (eller har til hensigt at) aktivt at forfølge en ændring i forretningsstrategi. Skema 13G indikerer en passiv investering på over 5%.
Fondens stemningsscore
Fund Sentiment Score (fka Ownership Accumulation Score) finder de aktier, der bliver mest købt af fonde. Det er resultatet af en sofistikeret, multi-faktor kvantitativ model, der identificerer virksomheder med de højeste niveauer af institutionel akkumulering. Scoringsmodellen bruger en kombination af den samlede stigning i oplyste ejere, ændringerne i porteføljeallokeringer i disse ejere og andre målinger. Tallet går fra 0 til 100, hvor højere tal indikerer et højere niveau af akkumulering for sine jævnaldrende, og 50 er gennemsnittet.
Opdateringsfrekvens: Dagligt
Se Ownership Explorer, som giver en liste over højest rangerende virksomheder.
AI+ Ask Fintel’s AI assistant about Metalla Royalty & Streaming Ltd..
Select a question to share a public post with an AI-crafted answer.
Thinking of good questions…
13F og NPORT arkivering
Detaljer om 13F-arkivering er gratis. Detaljer om NP-ansøgninger kræver et premium-medlemskab. Grønne rækker angiver nye positioner. Røde rækker angiver lukkede positioner. Klik på linket ikon for at se den fulde transaktionshistorik.
Opgrader
for at låse premium-data op og eksportere til Excel ![]() .
.
| Fil dato | Kilde | Investor | Type | Gennemsnitlig pris (Øst) |
Aktier | Δ Aktier (%) |
Rapporteret Værdi ($1000) |
Δ Værdi (%) |
Port Alloc (%) |
|
|---|---|---|---|---|---|---|---|---|---|---|
| 2025-10-22 | 13F | CoreCap Advisors, LLC | 0 | -100,00 | 0 | |||||
| 2026-02-23 | 13F | Virtu Financial LLC | 21.540 | 16,55 | 0 | |||||
| 2025-09-26 | NP | EPGFX - EuroPac Gold Fund Class A | 3.155.115 | 0,00 | 11.955 | 24,07 | ||||
| 2026-02-12 | 13F | Insigneo Advisory Services, Llc | 343.024 | -3,92 | 2.669 | 17,69 | ||||
| 2026-02-17 | 13F | Millennium Management Llc | 17.759 | -23,48 | 138 | -6,12 | ||||
| 2025-11-05 | 13F | Sentry Investment Management Llc | 0 | -100,00 | 0 | |||||
| 2026-02-13 | 13F | Global Strategic Management Inc | 2.082.799 | 157,03 | 16 | -99,84 | ||||
| 2026-02-13 | 13F | Toroso Investments, LLC | 23.132 | -3,64 | 180 | 17,76 | ||||
| 2025-11-12 | 13F | Creekmur Asset Management LLC | 179 | 17.800,00 | 1 | |||||
| 2026-02-12 | 13F | SWAN Capital LLC | 0 | -100,00 | 0 | |||||
| 2026-02-11 | 13F | Gwn Securities Inc. | 42.877 | 334 | ||||||
| 2026-02-06 | 13F | Global Retirement Partners, LLC | 4.360 | 34 | ||||||
| 2026-02-13 | 13F | Arrowstreet Capital, Limited Partnership | 169.103 | 409,09 | 1.301 | 516,59 | ||||
| 2026-02-17 | 13F | Man Group plc | 24.945 | -44,69 | 194 | -32,17 | ||||
| 2025-11-14 | 13F | Cubist Systematic Strategies, LLC | 63.266 | 73,41 | 402 | 186,43 | ||||
| 2026-02-13 | 13F | Merk Investments LLC | 3.000.000 | 0,00 | 23.340 | 22,52 | ||||
| 2026-01-07 | 13F | Northside Capital Management, LLC | 111.578 | 0,00 | 868 | 22,60 | ||||
| 2026-02-10 | 13F | Hillsdale Investment Management Inc. | 285.900 | -9,61 | 2.204 | 9,33 | ||||
| 2026-02-12 | 13F | Bank Of Montreal /can/ | 0 | -100,00 | 0 | |||||
| 2026-02-12 | 13F | Sprott Inc. | 1.415.520 | 91,75 | 11.013 | 134,95 | ||||
| 2026-02-11 | 13F | Horizon Kinetics Asset Management Llc | 404.397 | 0,00 | 3.146 | 22,56 | ||||
| 2026-02-17 | 13F | Advisor Group Holdings, Inc. | 84.534 | 495,98 | 658 | 742,31 | ||||
| 2026-02-13 | 13F | SRS Capital Advisors, Inc. | 2.200 | 0,00 | 17 | 30,77 | ||||
| 2026-02-17 | 13F | Cetera Investment Advisers | 29.681 | 231 | ||||||
| 2026-02-17 | 13F | Susquehanna International Group, Llp | Put | 17.100 | -68,85 | 133 | -61,78 | |||
| 2026-02-17 | 13F | Susquehanna International Group, Llp | Call | 11.000 | -74,42 | 86 | -68,86 | |||
| 2026-02-06 | 13F | HighTower Advisors, LLC | 127.844 | -3,29 | 995 | 18,47 | ||||
| 2026-02-12 | 13F | Jane Street Group, Llc | Call | 0 | -100,00 | 0 | -100,00 | |||
| 2026-02-13 | 13F | OMERS ADMINISTRATION Corp | 0 | -100,00 | 0 | |||||
| 2026-02-17 | 13F | Susquehanna International Group, Llp | 77.353 | 12,53 | 602 | 37,84 | ||||
| 2025-11-14 | 13F | Balyasny Asset Management Llc | 0 | -100,00 | 0 | -100,00 | ||||
| 2025-11-14 | 13F | Northern Trust Corp | 0 | -100,00 | 0 | |||||
| 2026-02-12 | 13F | Wealthspire Advisors, LLC | 34.475 | 268 | ||||||
| 2026-02-12 | 13F | Alps Advisors Inc | 284.691 | 2.215 | ||||||
| 2025-10-06 | 13F | NWF Advisory Services Inc. | 0 | -100,00 | 0 | -100,00 | ||||
| 2026-02-06 | 13F | Banque Cantonale Vaudoise | 4.080 | 31 | ||||||
| 2026-02-17 | 13F | Royal Bank Of Canada | 7.084 | -1,12 | 55 | 22,22 | ||||
| 2026-01-07 | 13F | Massmutual Trust Co Fsb/adv | 4.680 | 0,00 | 36 | 24,14 | ||||
| 2025-09-30 | NP | ASA Gold & Precious Metals Ltd | 3.000.000 | 0,00 | 16.410 | 69,88 | ||||
| 2026-01-13 | 13F | Stonehage Fleming Financial Services Holdings Ltd | 20.490 | 0,00 | 159 | 22,31 | ||||
| 2026-02-12 | 13F | Campbell & CO Investment Adviser LLC | 62.290 | 442,83 | 485 | 572,22 | ||||
| 2026-02-17 | 13F | Raymond James Financial Inc | 291.485 | -3,79 | 2.268 | 17,89 | ||||
| 2026-01-16 | 13F | Ronald Blue Trust, Inc. | 1.500 | 0,00 | 12 | 22,22 | ||||
| 2025-11-13 | 13F | Marshall Wace, Llp | 0 | -100,00 | 0 | |||||
| 2026-02-10 | 13F | Quantbot Technologies LP | 40.689 | 12,51 | 317 | 37,99 | ||||
| 2026-02-13 | 13F | Morgan Stanley | 729.656 | 46,97 | 5.677 | 80,08 | ||||
| 2026-02-17 | 13F | Point72 Asset Management, L.P. | 13.287 | 103 | ||||||
| 2026-01-26 | 13F | PFG Investments, LLC | 11.910 | 11,86 | 93 | 37,31 | ||||
| 2026-03-04 | 13F | Leonteq Securities AG | 0 | -100,00 | 0 | |||||
| 2026-02-13 | 13F | MAI Capital Management | 2.419 | 0,00 | 19 | 20,00 | ||||
| 2026-02-13 | 13F | Walleye Capital LLC | 35.439 | -88,27 | 276 | -85,67 | ||||
| 2026-02-17 | 13F | XTX Topco Ltd | 38.862 | 33,37 | 302 | 63,24 | ||||
| 2026-02-12 | 13F | Jane Street Group, Llc | 358.962 | 147,15 | 2.793 | 202,82 | ||||
| 2026-02-17 | 13F | Boreal Capital Management LLC | 41.630 | 0,00 | 324 | 22,35 | ||||
| 2026-02-10 | 13F | Bnp Paribas Arbitrage, Sa | 10.194 | 79 | ||||||
| 2026-02-12 | 13F | Commonwealth Equity Services, Llc | 14.319 | 111 | ||||||
| 2026-02-17 | 13F | Brevan Howard Capital Management LP | 67.095 | 281,22 | 522 | 369,37 | ||||
| 2026-02-13 | 13F | Wexford Capital Lp | 10.174 | 55,80 | 79 | 92,68 | ||||
| 2026-02-05 | 13F | Cambridge Investment Research Advisors, Inc. | 58.173 | -41,62 | 0 | |||||
| 2026-01-23 | 13F | Halbert Hargrove Global Advisors, Llc | 1.200 | 9 | ||||||
| 2026-02-17 | 13F | Graham Capital Management, L.P. | 34.621 | -18,31 | 269 | 0,00 | ||||
| 2026-02-17 | 13F | Tudor Investment Corp Et Al | 387.567 | 2.105,97 | 3.015 | 2.616,22 | ||||
| 2026-02-11 | 13F | Simplex Trading, Llc | 19.555 | -56,48 | 152 | |||||
| 2026-01-07 | 13F | Hilltop National Bank | 869 | 0,00 | 7 | 20,00 | ||||
| 2026-01-29 | 13F | UBS Group AG | 5.576 | -85,47 | 43 | -82,30 | ||||
| 2026-02-06 | 13F | Pnc Financial Services Group, Inc. | 1.000 | 0,00 | 8 | 16,67 | ||||
| 2026-02-17 | 13F | Quadrature Capital Ltd | 30.503 | 141,17 | 237 | 196,25 | ||||
| 2026-02-17 | 13F | Jain Global LLC | 0 | -100,00 | 0 | |||||
| 2026-02-17 | 13F | Perritt Capital Management Inc | 0 | -100,00 | 0 | |||||
| 2026-02-17 | 13F | Two Sigma Investments, Lp | 669.055 | 43,05 | 5.205 | 75,25 | ||||
| 2025-11-14 | 13F | Hrt Financial Lp | 0 | -100,00 | 0 | |||||
| 2026-01-26 | 13F | Cwm, Llc | 3.955 | -0,53 | 0 | |||||
| 2026-02-17 | 13F | Aquatic Capital Management LLC | 15.784 | 123 | ||||||
| 2026-02-17 | 13F | Jones Financial Companies Lllp | 496 | 4 | ||||||
| 2026-02-18 | 13F | Mackenzie Financial Corp | 731.231 | 1.657,77 | 5.557 | 1.996,98 | ||||
| 2026-02-12 | 13F | Renaissance Technologies Llc | 145.700 | 40,42 | 1.134 | 72,19 | ||||
| 2026-02-11 | 13F | Jpmorgan Chase & Co | 150.282 | 1.120,71 | 1.169 | 1.398,72 | ||||
| 2026-02-17 | 13F | LB Partners LLC | 36.000 | 0,00 | 280 | 22,81 | ||||
| 2025-11-14 | 13F | Point72 (DIFC) Ltd | 1.200 | -61,24 | 8 | -36,36 | ||||
| 2026-02-02 | 13F | Mutual Advisors, LLC | 21.670 | 169 | ||||||
| 2026-02-13 | 13F | Citigroup Inc | 0 | -100,00 | 0 | |||||
| 2026-02-17 | 13F | D. E. Shaw & Co., Inc. | 184.463 | -41,17 | 1.435 | -27,93 | ||||
| 2025-11-14 | 13F | Wolverine Trading, Llc | 18.694 | 85,25 | 117 | 207,89 | ||||
| 2026-02-13 | 13F | K2 Principal Fund, L.p. | 69.760 | 543 | ||||||
| 2025-11-14 | 13F | Goldman Sachs Group Inc | 0 | -100,00 | 0 | |||||
| 2026-01-27 | 13F | Wealth Enhancement Trust Services, Inc. | 12.312 | 96 | ||||||
| 2026-01-28 | 13F | U S Global Investors Inc | 1.432.510 | 75,86 | 11.145 | 115,47 | ||||
| 2026-02-03 | 13F | Sequoia Financial Advisors, LLC | 13.805 | 0,00 | 107 | 22,99 | ||||
| 2025-11-14 | 13F | Oxford Asset Management Llp | 47.008 | 42,73 | 299 | 136,51 | ||||
| 2026-02-17 | 13F | Old Mission Capital Llc | 0 | -100,00 | 0 | |||||
| 2026-02-17 | 13F | Two Sigma Advisers, Lp | 415.400 | 26,18 | 3.232 | 54,59 | ||||
| 2026-02-12 | 13F | Arbiter Partners Capital Management LLC | 34.000 | 265 | ||||||
| 2026-02-09 | 13F | Fisher Asset Management, LLC | 0 | -100,00 | 0 | |||||
| 2025-11-12 | 13F | Legacy Wealth Managment, LLC/ID | 0 | -100,00 | 0 | |||||
| 2026-02-19 | 13F | Mcguire Capital Advisors Inc | 500 | 4 | ||||||
| 2026-02-13 | 13F | Extract Advisors LLC | 456.339 | 3.550 | ||||||
| 2026-02-12 | 13F | Federation des caisses Desjardins du Quebec | 12.783 | -12,70 | 94 | 9,30 | ||||
| 2026-01-14 | 13F | AA Financial Advisors, LLC | 10.000 | 78 | ||||||
| 2026-02-13 | 13F | National Bank Of Canada /fi/ | 3.066 | -4,31 | 23 | 15,79 | ||||
| 2026-01-21 | 13F/A | Euro Pacific Asset Management, LLC | 5.742.309 | 0,86 | 43 | 22,86 | ||||
| 2026-02-13 | 13F | Barclays Plc | 0 | -100,00 | 0 | |||||
| 2026-01-29 | 13F | IMC-Chicago, LLC | 0 | -100,00 | 0 | |||||
| 2026-02-17 | 13F | Fmr Llc | 2.363.655 | 50,96 | 18.389 | 84,96 | ||||
| 2026-02-13 | 13F | Kestra Advisory Services, LLC | 5.000 | 39 | ||||||
| 2026-02-17 | 13F | Bank Of America Corp /de/ | 146.507 | -8,39 | 1.140 | 12,22 | ||||
| 2026-02-17 | 13F | Citadel Advisors Llc | Call | 96.100 | 707,56 | 748 | 896,00 | |||
| 2026-02-17 | 13F | Citadel Advisors Llc | 80.620 | -82,08 | 627 | -78,05 | ||||
| 2026-02-17 | 13F | Citadel Advisors Llc | Put | 22.400 | 12,00 | 174 | 37,01 | |||
| 2026-02-11 | 13F | Tradition Wealth Management, LLC | 10.329 | 0,00 | 80 | 23,08 | ||||
| 2026-02-17 | 13F | Qube Research & Technologies Ltd | 16.703 | 4,95 | 130 | 27,72 | ||||
| 2025-10-27 | 13F | Kiker Wealth Management, LLC | 0 | -100,00 | 0 | |||||
| 2026-02-18 | 13F | Papamarkou Wellner Asset Management inc. | 29.618 | -2,16 | 230 | 19,79 | ||||
| 2026-02-13 | 13F | Wells Fargo & Company/mn | 12.681 | 0,00 | 99 | 22,50 | ||||
| 2026-02-13 | 13F | Van Eck Associates Corp | 2.432.344 | -8,67 | 19 | 12,50 | ||||
| 2026-01-28 | 13F | Eagle Global Advisors Llc | 50.300 | -19,90 | 391 | -1,76 | ||||
| 2026-02-11 | 13F | Group One Trading, L.p. | 40.689 | 96,33 | 317 | 141,22 | ||||
| 2026-02-20 | 13F | Sunbelt Securities, Inc. | 16.700 | 0,00 | 130 | 21,70 |