Grundlæggende statistik
| Institutionelle aktier (lange) | 3.703.163 - 20,90% (ex 13D/G) - change of -0,21MM shares -5,30% MRQ |
| Institutionel værdi (lang) | $ 24.536 USD ($1000) |
Institutionelt ejerskab og aktionærer
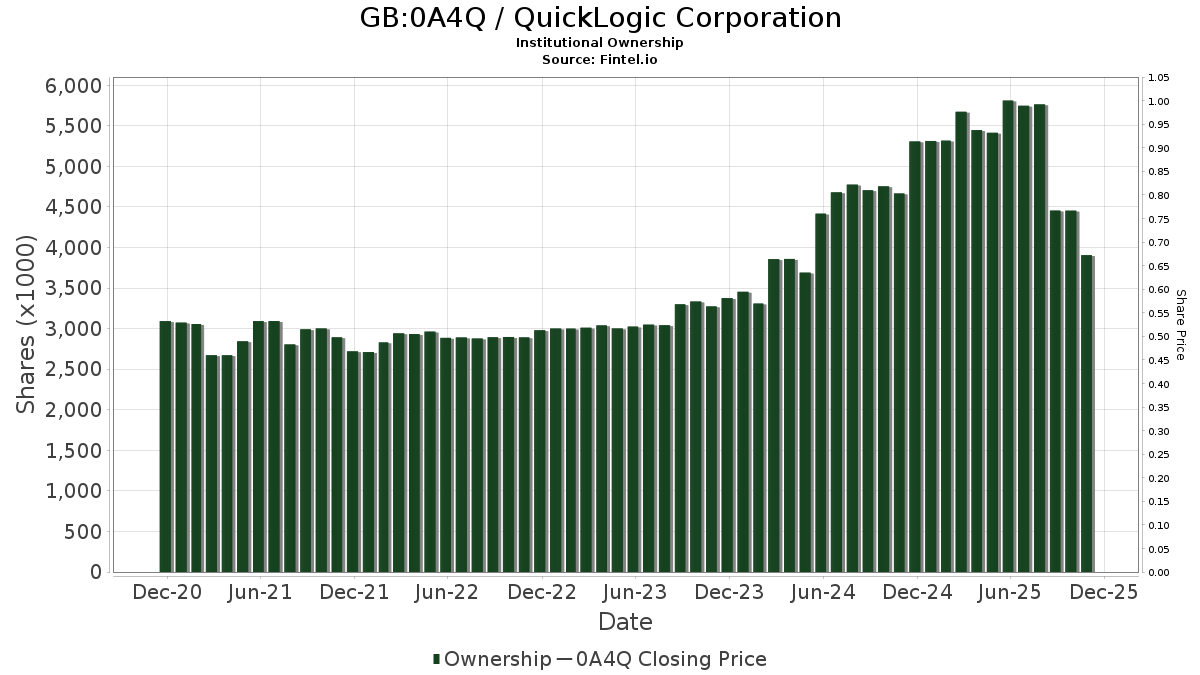
QuickLogic Corporation (GB:0A4Q) har 68 institutionelle ejere og aktionærer, der har indsendt 13D/G- eller 13F-formularer til Securities Exchange Commission (SEC). Disse institutioner har i alt 3,703,163 aktier. Største aktionærer omfatter Herald Investment Management Ltd, Vanguard Group Inc, Perkins Capital Management Inc, Taylor Frigon Capital Management LLC, Cadent Capital Advisors, LLC, Geode Capital Management, Llc, BlackRock, Inc., 1492 Capital Management LLC, Millennium Management Llc, and Raymond James Financial Inc .
QuickLogic Corporation (LSE:0A4Q) institutionel ejerskabsstruktur viser aktuelle positioner i virksomheden efter institutioner og fonde, samt seneste ændringer i positionsstørrelse. Større aktionærer kan omfatte individuelle investorer, investeringsforeninger, hedgefonde eller institutioner. Skema 13D angiver, at investoren besidder (eller besidder) mere end 5 % af virksomheden og har til hensigt (eller har til hensigt at) aktivt at forfølge en ændring i forretningsstrategi. Skema 13G indikerer en passiv investering på over 5%.
Fondens stemningsscore
Fund Sentiment Score (fka Ownership Accumulation Score) finder de aktier, der bliver mest købt af fonde. Det er resultatet af en sofistikeret, multi-faktor kvantitativ model, der identificerer virksomheder med de højeste niveauer af institutionel akkumulering. Scoringsmodellen bruger en kombination af den samlede stigning i oplyste ejere, ændringerne i porteføljeallokeringer i disse ejere og andre målinger. Tallet går fra 0 til 100, hvor højere tal indikerer et højere niveau af akkumulering for sine jævnaldrende, og 50 er gennemsnittet.
Opdateringsfrekvens: Dagligt
Se Ownership Explorer, som giver en liste over højest rangerende virksomheder.
AI+ Ask Fintel’s AI assistant about QuickLogic Corporation.
Select a question to share a public post with an AI-crafted answer.
Thinking of good questions…
13F og NPORT arkivering
Detaljer om 13F-arkivering er gratis. Detaljer om NP-ansøgninger kræver et premium-medlemskab. Grønne rækker angiver nye positioner. Røde rækker angiver lukkede positioner. Klik på linket ikon for at se den fulde transaktionshistorik.
Opgrader
for at låse premium-data op og eksportere til Excel ![]() .
.
| Fil dato | Kilde | Investor | Type | Gennemsnitlig pris (Øst) |
Aktier | Δ Aktier (%) |
Rapporteret Værdi ($1000) |
Δ Værdi (%) |
Port Alloc (%) |
|
|---|---|---|---|---|---|---|---|---|---|---|
| 2026-02-13 | 13F | Barclays Plc | 3 | 0,00 | 0 | -100,00 | ||||
| 2026-01-16 | 13F | FNY Investment Advisers, LLC | 0 | -100,00 | 0 | |||||
| 2026-02-17 | 13F | Bank Of America Corp /de/ | 5.959 | 74,09 | 36 | 75,00 | ||||
| 2026-02-13 | 13F | SRS Capital Advisors, Inc. | 3 | 0,00 | 0 | |||||
| 2026-02-12 | 13F | Dimensional Fund Advisors Lp | 16.895 | 102 | ||||||
| 2026-04-23 | 13F | Perkins Capital Management Inc | 306.706 | 11,24 | 2.877 | 73,67 | ||||
| 2026-02-13 | 13F | Wells Fargo & Company/mn | 1 | -99,50 | 0 | -100,00 | ||||
| 2026-02-17 | 13F | D. E. Shaw & Co., Inc. | 29.071 | 142,60 | 175 | 141,67 | ||||
| 2026-02-17 | 13F | Qube Research & Technologies Ltd | 53.984 | 47,84 | 324 | 46,61 | ||||
| 2026-02-17 | 13F | Gladstone Institutional Advisory LLC | 28.742 | 1,77 | 173 | 0,58 | ||||
| 2026-01-29 | 13F | Concord Wealth Partners | 35 | 0,00 | 0 | |||||
| 2026-02-11 | 13F | Group One Trading, L.p. | Call | 2.200 | -86,90 | 13 | -87,13 | |||
| 2026-02-12 | 13F | Jane Street Group, Llc | 47.906 | 245,22 | 288 | 241,67 | ||||
| 2026-02-11 | 13F | Group One Trading, L.p. | Put | 2.100 | -38,24 | 13 | -40,00 | |||
| 2026-02-12 | 13F | BlackRock, Inc. | 155.748 | -0,57 | 936 | -1,37 | ||||
| 2026-02-11 | 13F | Group One Trading, L.p. | 772 | 5 | ||||||
| 2026-02-17 | 13F | Two Sigma Advisers, Lp | 21.300 | 65,12 | 128 | 64,10 | ||||
| 2026-02-13 | 13F | Morgan Stanley | 25.526 | 3,52 | 153 | 2,68 | ||||
| 2026-02-17 | 13F | Fmr Llc | 2.312 | -15,40 | 14 | -18,75 | ||||
| 2026-02-11 | 13F | Simplex Trading, Llc | Call | 1.500 | -66,67 | 9 | ||||
| 2026-02-12 | 13F | Federation des caisses Desjardins du Quebec | 4.000 | 0,00 | 24 | 0,00 | ||||
| 2026-02-13 | 13F | National Bank Of Canada /fi/ | 0 | -100,00 | 0 | |||||
| 2026-02-13 | 13F | State Street Corp | 65.056 | 5,00 | 391 | 4,00 | ||||
| 2026-02-03 | 13F | SBI Securities Co., Ltd. | 218 | 0,00 | 1 | 0,00 | ||||
| 2026-04-08 | 13F | Cadent Capital Advisors, LLC | 172.427 | 0,00 | 1.617 | 56,08 | ||||
| 2026-04-21 | 13F | Maridea Wealth Management LLC | 17.125 | 161 | ||||||
| 2026-01-20 | 13F | Stratos Wealth Advisors, LLC | 18.235 | 55,52 | 110 | 53,52 | ||||
| 2026-02-17 | 13F | Citadel Advisors Llc | Put | 0 | -100,00 | 0 | ||||
| 2026-02-11 | 13F | Rise Advisors, LLC | 0 | -100,00 | 0 | |||||
| 2026-02-17 | 13F | Captrust Financial Advisors | 35.618 | 4,54 | 214 | 3,88 | ||||
| 2026-04-22 | 13F | 1492 Capital Management LLC | 153.772 | -0,10 | 1.442 | 55,89 | ||||
| 2025-11-14 | 13F | Hrt Financial Lp | 0 | -100,00 | 0 | |||||
| 2026-02-12 | 13F | Brown Brothers Harriman & Co | 311 | 0,00 | 2 | 0,00 | ||||
| 2026-02-09 | 13F | Harbour Investments, Inc. | 28 | 0,00 | 0 | |||||
| 2026-03-12 | 13F/A | Peak6 Llc | Call | 14.500 | 87 | |||||
| 2025-11-12 | 13F | Principal Securities, Inc. | 0 | -100,00 | 0 | -100,00 | ||||
| 2026-02-10 | 13F | Bnp Paribas Arbitrage, Sa | 173 | -46,77 | 1 | 0,00 | ||||
| 2026-02-05 | 13F | Allworth Financial LP | 2.023 | 0,00 | 12 | 0,00 | ||||
| 2026-02-17 | 13F | Two Sigma Investments, Lp | 91.540 | 36,59 | 550 | 35,47 | ||||
| 2025-11-12 | 13F | Simplex Trading, Llc | 0 | -100,00 | 0 | |||||
| 2025-11-14 | 13F | Jain Global LLC | 0 | -100,00 | 0 | |||||
| 2026-02-17 | 13F | Citadel Advisors Llc | 0 | -100,00 | 0 | |||||
| 2026-02-17 | 13F | Tower Research Capital LLC (TRC) | 4.794 | 252,50 | 29 | 250,00 | ||||
| 2025-11-14 | 13F | Skopos Labs, Inc. | 0 | -100,00 | 0 | |||||
| 2026-02-02 | 13F | Heritage Financial Services, LLC | 0 | -100,00 | 0 | -100,00 | ||||
| 2026-02-14 | 13F | Rockefeller Capital Management L.P. | 390 | 0,00 | 2 | 0,00 | ||||
| 2026-01-26 | 13F | Taylor Frigon Capital Management LLC | 253.350 | -1,38 | 1.523 | -2,19 | ||||
| 2026-02-13 | 13F | Ubs Asset Management Americas Inc | 428 | 3 | ||||||
| 2025-11-14 | 13F | Wolverine Trading, Llc | Call | 13.700 | 81 | |||||
| 2026-04-16 | 13F | Silverberg Bernstein Capital Management LLC | 12.303 | 0,00 | 115 | 57,53 | ||||
| 2025-11-14 | 13F | Wolverine Trading, Llc | Put | 13.300 | 79 | |||||
| 2026-01-29 | 13F | Vanguard Group Inc | 660.791 | 0,75 | 3.971 | -0,08 | ||||
| 2026-02-17 | 13F | Corsair Capital Management, L.p. | 43.930 | -31,27 | 264 | -31,78 | ||||
| 2026-02-11 | 13F | MCF Advisors LLC | 885 | 0,00 | 5 | 0,00 | ||||
| 2026-02-11 | 13F | Simplex Trading, Llc | Put | 0 | -100,00 | 0 | ||||
| 2026-02-17 | 13F | Millennium Management Llc | 117.188 | -30,03 | 704 | -30,57 | ||||
| 2025-11-10 | 13F | Citigroup Inc | 0 | -100,00 | 0 | |||||
| 2025-11-14 | 13F | Point72 Asia (Singapore) Pte. Ltd. | 0 | -100,00 | 0 | |||||
| 2026-02-05 | 13F | SFE Investment Counsel | 29.862 | -26,92 | 179 | -27,53 | ||||
| 2026-02-09 | 13F | Geode Capital Management, Llc | 169.902 | 7,29 | 1.021 | 6,47 | ||||
| 2026-02-13 | 13F | Squarepoint Ops LLC | 13.973 | 84 | ||||||
| 2026-02-17 | 13F | Susquehanna International Group, Llp | Put | 34.000 | -19,43 | 204 | -20,00 | |||
| 2026-02-17 | 13F | Susquehanna International Group, Llp | Call | 14.400 | -7,69 | 87 | -8,51 | |||
| 2026-02-12 | 13F | Skandinaviska Enskilda Banken AB (publ) | 16.790 | -3,76 | 101 | -4,76 | ||||
| 2026-02-17 | 13F | Susquehanna International Group, Llp | 92.804 | 49,31 | 558 | 48,14 | ||||
| 2026-02-13 | 13F | Herald Investment Management Ltd | 730.379 | 0,00 | 4.360 | -1,31 | ||||
| 2026-02-17 | 13F | Jones Financial Companies Lllp | 0 | -100,00 | 0 | |||||
| 2026-01-23 | 13F | Avion Wealth | 265 | 152,38 | 0 | |||||
| 2026-01-30 | 13F | Caldwell Securities, Inc | 200 | 0,00 | 1 | 0,00 | ||||
| 2026-02-17 | 13F | Optiver Holding B.V. | 16 | 0,00 | 0 | |||||
| 2025-11-14 | 13F | Cubist Systematic Strategies, LLC | 0 | -100,00 | 0 | -100,00 | ||||
| 2026-01-21 | 13F | Crews Bank & Trust | 2.500 | 0,00 | 15 | 0,00 | ||||
| 2025-10-31 | 13F | Y-Intercept (Hong Kong) Ltd | 0 | -100,00 | 0 | |||||
| 2026-04-06 | 13F | GAMMA Investing LLC | 456 | 0,00 | 4 | 100,00 | ||||
| 2026-02-12 | 13F | Connecticut Wealth Management, LLC | 0 | -100,00 | 0 | |||||
| 2026-02-17 | 13F | XTX Topco Ltd | 27.539 | 166 | ||||||
| 2026-02-17 | 13F | Russell Investments Group, Ltd. | 208 | 0,00 | 1 | 0,00 | ||||
| 2026-02-17 | 13F | Northern Trust Corp | 36.990 | 20,17 | 222 | 19,35 | ||||
| 2025-11-12 | 13F | Aster Capital Management (DIFC) Ltd | 0 | -100,00 | 0 | |||||
| 2026-02-17 | 13F | Advisor Group Holdings, Inc. | 3.559 | 5,80 | 21 | 16,67 | ||||
| 2026-01-29 | 13F | RMG Wealth Management LLC | 0 | -100,00 | 0 | |||||
| 2026-02-17 | 13F | Citadel Advisors Llc | Call | 31.500 | -69,94 | 189 | -70,24 | |||
| 2026-01-29 | 13F | UBS Group AG | 30.513 | 94,26 | 183 | 92,63 | ||||
| 2026-02-06 | 13F | IFP Advisors, Inc | 0 | -100,00 | 0 | -100,00 | ||||
| 2026-02-17 | 13F | Raymond James Financial Inc | 116.247 | -29,89 | 699 | -30,48 | ||||
| 2026-02-10 | 13F | Goldman Sachs Group Inc | 33.882 | 25,92 | 204 | 24,54 | ||||
| 2026-02-13 | 13F | JustInvest LLC | 10.480 | 1,42 | 63 | 0,00 | ||||
| 2025-11-12 | 13F | Sprott Inc. | 0 | -100,00 | 0 | |||||
| 2026-04-14 | 13F | Prospera Financial Services Inc | 30.900 | 13,60 | 290 | 77,30 | ||||
| 2026-02-09 | 13F | Hartland & Co., LLC | 80 | 0 | ||||||
| 2026-01-15 | 13F | Nisa Investment Advisors, Llc | 282 | 0,00 | 2 | 0,00 | ||||
| 2026-02-09 | 13F | Quest Partners LLC | 3.347 | 0,00 | 20 | 0,00 | ||||
| 2026-02-17 | 13F | Royal Bank Of Canada | 2.353 | -95,49 | 14 | -95,58 | ||||
| 2025-11-12 | 13F | Huntington National Bank | 0 | -100,00 | 0 | |||||
| 2026-02-13 | 13F | Pinnacle Wealth Planning Services, Inc. | 29 | 0 | ||||||
| 2026-02-11 | 13F | Jpmorgan Chase & Co | 59 | 0,00 | 0 |