Grundlæggende statistik
| Institutionelle aktier (lange) | 3.707.470 - 47,01% (ex 13D/G) - change of -1,07MM shares -22,46% MRQ |
| Institutionel værdi (lang) | $ 38.633 USD ($1000) |
Institutionelt ejerskab og aktionærer
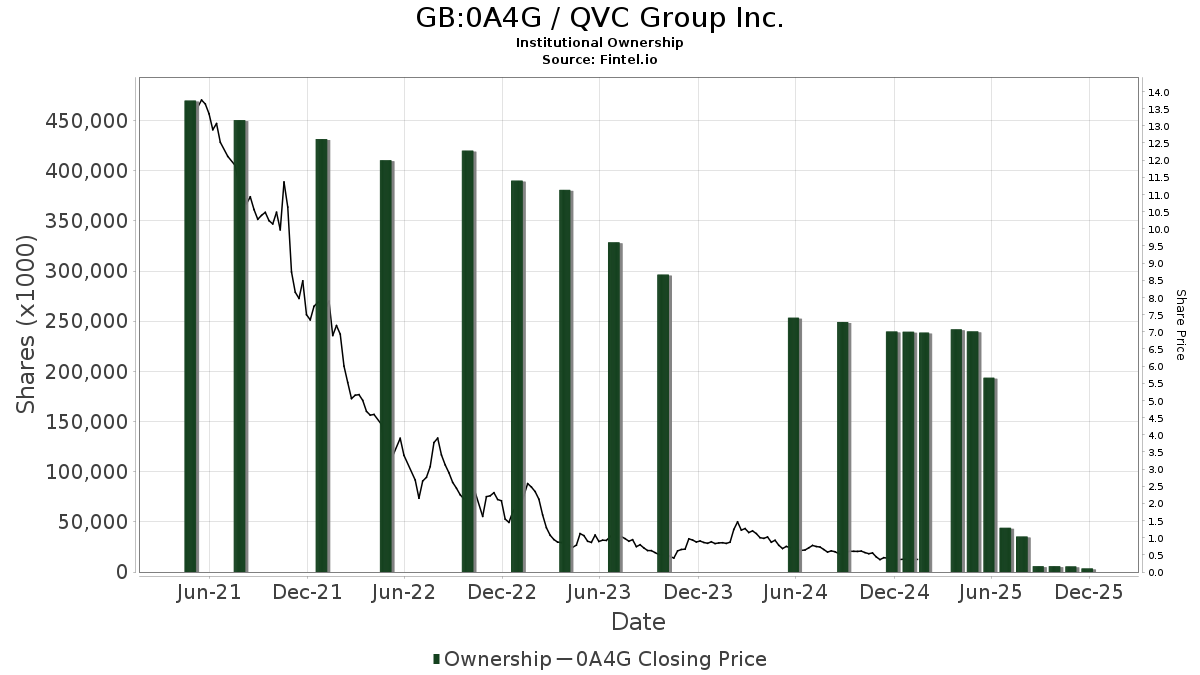
QVC Group Inc. (GB:0A4G) har 68 institutionelle ejere og aktionærer, der har indsendt 13D/G- eller 13F-formularer til Securities Exchange Commission (SEC). Disse institutioner har i alt 3,707,470 aktier. Største aktionærer omfatter Charles Schwab Investment Management Inc, Contrarius Group Holdings Ltd, Vanguard Group Inc, Permit Capital, LLC, Dakota Wealth Management, SFLNX - Schwab Fundamental US Large Company Index Fund Institutional Shares, BlackRock, Inc., Wittenberg Investment Management, Inc., Geode Capital Management, Llc, and UBS Group AG .
QVC Group Inc. (LSE:0A4G) institutionel ejerskabsstruktur viser aktuelle positioner i virksomheden efter institutioner og fonde, samt seneste ændringer i positionsstørrelse. Større aktionærer kan omfatte individuelle investorer, investeringsforeninger, hedgefonde eller institutioner. Skema 13D angiver, at investoren besidder (eller besidder) mere end 5 % af virksomheden og har til hensigt (eller har til hensigt at) aktivt at forfølge en ændring i forretningsstrategi. Skema 13G indikerer en passiv investering på over 5%.
Fondens stemningsscore
Fund Sentiment Score (fka Ownership Accumulation Score) finder de aktier, der bliver mest købt af fonde. Det er resultatet af en sofistikeret, multi-faktor kvantitativ model, der identificerer virksomheder med de højeste niveauer af institutionel akkumulering. Scoringsmodellen bruger en kombination af den samlede stigning i oplyste ejere, ændringerne i porteføljeallokeringer i disse ejere og andre målinger. Tallet går fra 0 til 100, hvor højere tal indikerer et højere niveau af akkumulering for sine jævnaldrende, og 50 er gennemsnittet.
Opdateringsfrekvens: Dagligt
Se Ownership Explorer, som giver en liste over højest rangerende virksomheder.
AI+ Ask Fintel’s AI assistant about QVC Group Inc..
Select a question to share a public post with an AI-crafted answer.
Thinking of good questions…
13F og NPORT arkivering
Detaljer om 13F-arkivering er gratis. Detaljer om NP-ansøgninger kræver et premium-medlemskab. Grønne rækker angiver nye positioner. Røde rækker angiver lukkede positioner. Klik på linket ikon for at se den fulde transaktionshistorik.
Opgrader
for at låse premium-data op og eksportere til Excel ![]() .
.
| Fil dato | Kilde | Investor | Type | Gennemsnitlig pris (Øst) |
Aktier | Δ Aktier (%) |
Rapporteret Værdi ($1000) |
Δ Værdi (%) |
Port Alloc (%) |
|
|---|---|---|---|---|---|---|---|---|---|---|
| 2025-09-29 | NP | KCXIX - Knights of Columbus U.S. All Cap Index Fund I Shares | 32 | -97,83 | 0 | |||||
| 2025-11-14 | 13F | Northwestern Mutual Wealth Management Co | 0 | -100,00 | 0 | |||||
| 2026-01-26 | 13F | Whittier Trust Co Of Nevada Inc | 2 | 0,00 | 0 | |||||
| 2026-02-17 | 13F | Qube Research & Technologies Ltd | 10.354 | -3,29 | 108 | -25,00 | ||||
| 2026-02-17 | 13F | Citadel Advisors Llc | Put | 0 | -100,00 | 0 | -100,00 | |||
| 2026-02-17 | 13F | Bank Of America Corp /de/ | 405 | -98,14 | 4 | -98,63 | ||||
| 2026-02-09 | 13F | Investors Portfolio Services LLC | 8 | 0 | ||||||
| 2026-01-15 | 13F | Fortitude Family Office, LLC | 88 | 1 | ||||||
| 2026-02-13 | 13F | Diametric Capital, LP | 43.659 | 149,67 | 457 | 94,04 | ||||
| 2026-02-13 | 13F | Wells Fargo & Company/mn | 79 | -1,25 | 1 | -100,00 | ||||
| 2026-02-13 | 13F | MAI Capital Management | 27 | 0,00 | 0 | |||||
| 2026-02-17 | 13F | Fmr Llc | 39 | -22,00 | 0 | |||||
| 2026-01-21 | 13F | Newbridge Financial Services Group, Inc. | 18 | 0,00 | 0 | |||||
| 2026-02-11 | 13F | Group One Trading, L.p. | 15.794 | 102,51 | 165 | 57,14 | ||||
| 2026-02-12 | 13F | BlackRock, Inc. | 137.984 | 2,26 | 1.443 | -20,71 | ||||
| 2026-01-30 | 13F | Us Bancorp \de\ | 0 | -100,00 | 0 | |||||
| 2026-01-21 | 13F | Future Financial Wealth Managment LLC | 0 | -100,00 | 0 | |||||
| 2026-02-06 | 13F | Covestor Ltd | 0 | 0 | ||||||
| 2026-02-11 | 13F | Townsquare Capital Llc | 0 | -100,00 | 0 | -100,00 | ||||
| 2026-02-11 | 13F | TCTC Holdings, LLC | 21 | 0,00 | 0 | |||||
| 2026-02-12 | 13F | Jane Street Group, Llc | Call | 18.800 | -31,89 | 197 | -47,31 | |||
| 2026-02-12 | 13F | Jane Street Group, Llc | Put | 26.500 | -37,20 | 277 | -51,32 | |||
| 2026-02-18 | 13F/A | Empowered Funds, LLC | 11.084 | 0,03 | 116 | -22,82 | ||||
| 2026-02-18 | 13F | GWM Advisors LLC | 5 | 0,00 | 0 | |||||
| 2025-11-14 | 13F | Saba Capital Management, L.P. | 0 | -100,00 | 0 | |||||
| 2025-10-21 | 13F | Optimum Investment Advisors | 7 | 0,00 | 0 | |||||
| 2026-02-09 | 13F | Simplify Asset Management Inc. | 16.696 | 39,13 | 175 | 8,07 | ||||
| 2026-02-13 | 13F | State Street Corp | 34.451 | 0,00 | 360 | -22,41 | ||||
| 2026-02-03 | 13F | SBI Securities Co., Ltd. | 5 | 0,00 | 0 | |||||
| 2026-01-29 | 13F | Vanguard Group Inc | 612.843 | -0,34 | 6.410 | -22,72 | ||||
| 2026-01-08 | 13F | Versant Capital Management, Inc | 3 | 0,00 | 0 | |||||
| 2026-01-23 | 13F | Avion Wealth | 0 | -100,00 | 0 | |||||
| 2026-02-11 | 13F | Permit Capital, LLC | 388.062 | 7,26 | 4.059 | -16,82 | ||||
| 2025-09-29 | NP | PRFZ - Invesco FTSE RAFI US 1500 Small-Mid ETF This fund is a listed as child fund of Invesco Ltd. and if that institution has disclosed ownership in this security, then these positions will not be double counted when calculating total shares and total value | 14.805 | -98,68 | 57 | -66,07 | ||||
| 2026-02-17 | 13F | CastleKnight Management LP | 0 | -100,00 | 0 | |||||
| 2026-02-10 | 13F | Rothschild Investment Llc | 0 | -100,00 | 0 | |||||
| 2026-02-17 | 13F | Jones Financial Companies Lllp | 26 | 0,00 | 0 | |||||
| 2026-02-11 | 13F | Contrarius Group Holdings Ltd | 702.768 | 0,00 | 7.351 | -22,47 | ||||
| 2025-09-24 | NP | SFLNX - Schwab Fundamental US Large Company Index Fund Institutional Shares | 147.903 | -92,95 | 574 | 82,48 | ||||
| 2025-09-26 | NP | PRF - Invesco FTSE RAFI US 1000 ETF This fund is a listed as child fund of Invesco Ltd. and if that institution has disclosed ownership in this security, then these positions will not be double counted when calculating total shares and total value | 1.915 | -94,77 | 7 | 40,00 | ||||
| 2026-02-17 | 13F | Voleon Capital Management Lp | 0 | -100,00 | 0 | -100,00 | ||||
| 2026-02-05 | 13F | Allworth Financial LP | 1 | -75,00 | 0 | |||||
| 2025-11-14 | 13F | D. E. Shaw & Co., Inc. | 0 | -100,00 | 0 | |||||
| 2026-02-17 | 13F | Jump Financial, LLC | 13.200 | 138 | ||||||
| 2026-02-13 | 13F | Brooklands Fund Management Ltd | Call | 0 | -100,00 | 0 | ||||
| 2026-02-24 | 13F | DGS Capital Management, LLC | 0 | -100,00 | 0 | |||||
| 2026-02-17 | 13F | Two Sigma Investments, Lp | 25.318 | -6,23 | 265 | -27,47 | ||||
| 2026-02-03 | 13F | Investment Management Associates Inc /adv | 21.369 | -56,03 | 224 | -65,95 | ||||
| 2026-02-19 | 13F | Invesco Ltd. | 0 | -100,00 | 0 | |||||
| 2025-11-06 | 13F | Fairscale Capital, LLC | 0 | -100,00 | 0 | |||||
| 2026-02-10 | 13F | Bnp Paribas Arbitrage, Sa | 27 | -15,62 | 0 | |||||
| 2026-02-02 | 13F | Danske Bank A/s | 1 | 0,00 | 0 | |||||
| 2025-11-13 | 13F | Parallel Advisors, LLC | 0 | -100,00 | 0 | |||||
| 2026-02-11 | 13F | Hall Kathryn A. | 0 | -100,00 | 0 | |||||
| 2025-11-12 | 13F | Huntington National Bank | 0 | -100,00 | 0 | |||||
| 2026-01-29 | 13F | Comerica Bank | 116 | 0,00 | 1 | 0,00 | ||||
| 2025-11-14 | 13F | Goldman Sachs Group Inc | 0 | -100,00 | 0 | |||||
| 2026-02-09 | 13F | Geode Capital Management, Llc | 90.206 | 2,20 | 944 | -20,82 | ||||
| 2026-02-13 | 13F | Wittenberg Investment Management, Inc. | 114.193 | 41,05 | 1.194 | 9,34 | ||||
| 2026-02-17 | 13F | Susquehanna International Group, Llp | 19.048 | -65,27 | 199 | -73,07 | ||||
| 2026-02-17 | 13F | Advisor Group Holdings, Inc. | 753 | 0,53 | 8 | 16,67 | ||||
| 2026-01-20 | 13F | Signaturefd, Llc | 28 | 0,00 | 0 | |||||
| 2026-02-17 | 13F | Susquehanna International Group, Llp | Put | 31.200 | -59,48 | 326 | -68,59 | |||
| 2026-02-17 | 13F | Susquehanna International Group, Llp | Call | 28.400 | -29,88 | 297 | -45,60 | |||
| 2026-02-13 | 13F | Brooklands Fund Management Ltd | 35.457 | 381 | ||||||
| 2026-02-12 | 13F | McMillan Office, Inc. | 8 | 0 | ||||||
| 2026-02-13 | 13F | Morgan Stanley | 19.135 | -3,45 | 200 | -25,09 | ||||
| 2025-11-04 | 13F | Guerra Advisors Inc | 16 | 0 | ||||||
| 2026-02-11 | 13F | Hilton Head Capital Partners, LLC | 76 | 1 | ||||||
| 2026-02-03 | 13F | Costello Asset Management, INC | 20 | 0,00 | 0 | |||||
| 2026-02-12 | 13F | Renaissance Technologies Llc | 54.831 | 8,94 | 574 | -15,49 | ||||
| 2026-02-12 | 13F | Wealthspire Advisors, LLC | 0 | -100,00 | 0 | |||||
| 2026-02-13 | 13F | Charles Schwab Investment Management Inc | 995.190 | 39,40 | 10.410 | 8,09 | ||||
| 2026-02-10 | 13F | Hazlett, Burt & Watson, Inc. | 1 | 0,00 | 0 | |||||
| 2026-02-12 | 13F | BRYN MAWR TRUST Co | 0 | -100,00 | 0 | -100,00 | ||||
| 2026-02-12 | 13F | CIBC Private Wealth Group, LLC | 8 | -75,76 | 0 | |||||
| 2026-02-10 | 13F | JTC Employer Solutions Trusteee Ltd | 492 | 0,00 | 0 | |||||
| 2026-02-10 | 13F | KERR FINANCIAL PLANNING Corp | 0 | -100,00 | 0 | |||||
| 2025-11-14 | 13F | Wolverine Trading, Llc | Call | 39.600 | 555 | |||||
| 2026-02-06 | 13F | Global Retirement Partners, LLC | 9 | 0,00 | 0 | |||||
| 2025-11-14 | 13F | Wolverine Trading, Llc | Put | 13.200 | 185 | |||||
| 2026-02-17 | 13F | Northern Trust Corp | 16.668 | 14,71 | 174 | -11,22 | ||||
| 2026-02-17 | 13F | Prelude Capital Management, Llc | 10.863 | 114 | ||||||
| 2026-02-17 | 13F | Russell Investments Group, Ltd. | 4.129 | 43 | ||||||
| 2026-02-17 | 13F | Bridgeway Capital Management Inc | 11.081 | 0,00 | 116 | -22,82 | ||||
| 2025-11-19 | 13F | Sunbelt Securities, Inc. | 0 | -100,00 | 0 | |||||
| 2026-02-17 | 13F | Citadel Advisors Llc | Call | 38.100 | -0,52 | 399 | -22,87 | |||
| 2026-01-13 | 13F | Dakota Wealth Management | 154.411 | -6,14 | 1.615 | -27,22 | ||||
| 2026-01-29 | 13F | UBS Group AG | 74.398 | 5,18 | 778 | -18,45 | ||||
| 2026-02-17 | 13F | Brevan Howard Capital Management LP | 0 | -100,00 | 0 | -100,00 | ||||
| 2026-02-11 | 13F | Deseret Mutual Benefit Administrators | 82 | 0,00 | 1 | -100,00 | ||||
| 2026-02-17 | 13F | Man Group plc | 59.212 | -15,49 | 619 | -34,50 | ||||
| 2025-11-14 | 13F | Two Sigma Advisers, Lp | 0 | -100,00 | 0 | -100,00 | ||||
| 2025-11-14 | 13F | Raymond James Financial Inc | 0 | -100,00 | 0 | |||||
| 2025-11-12 | 13F | Simplex Trading, Llc | 0 | -100,00 | 0 | |||||
| 2026-01-13 | 13F | Mather Group, Llc. | 0 | -100,00 | 0 | |||||
| 2026-02-14 | 13F | Rockefeller Capital Management L.P. | 6 | 0 | ||||||
| 2026-01-23 | 13F | Farther Finance Advisors, LLC | 1 | 0 | ||||||
| 2026-02-06 | 13F | Tortoise Investment Management, LLC | 0 | -100,00 | 0 | |||||
| 2026-02-17 | 13F | Aristeia Capital Llc | 0 | -100,00 | 0 | |||||
| 2026-02-17 | 13F | Price T Rowe Associates Inc /md/ | 12.629 | 0 | ||||||
| 2026-02-17 | 13F | Royal Bank Of Canada | 16 | -99,94 | 0 | -100,00 | ||||
| 2026-01-26 | 13F | Cwm, Llc | 11 | 0,00 | 0 | |||||
| 2025-11-14 | 13F | XTX Topco Ltd | 0 | -100,00 | 0 | -100,00 |