Grundlæggende statistik
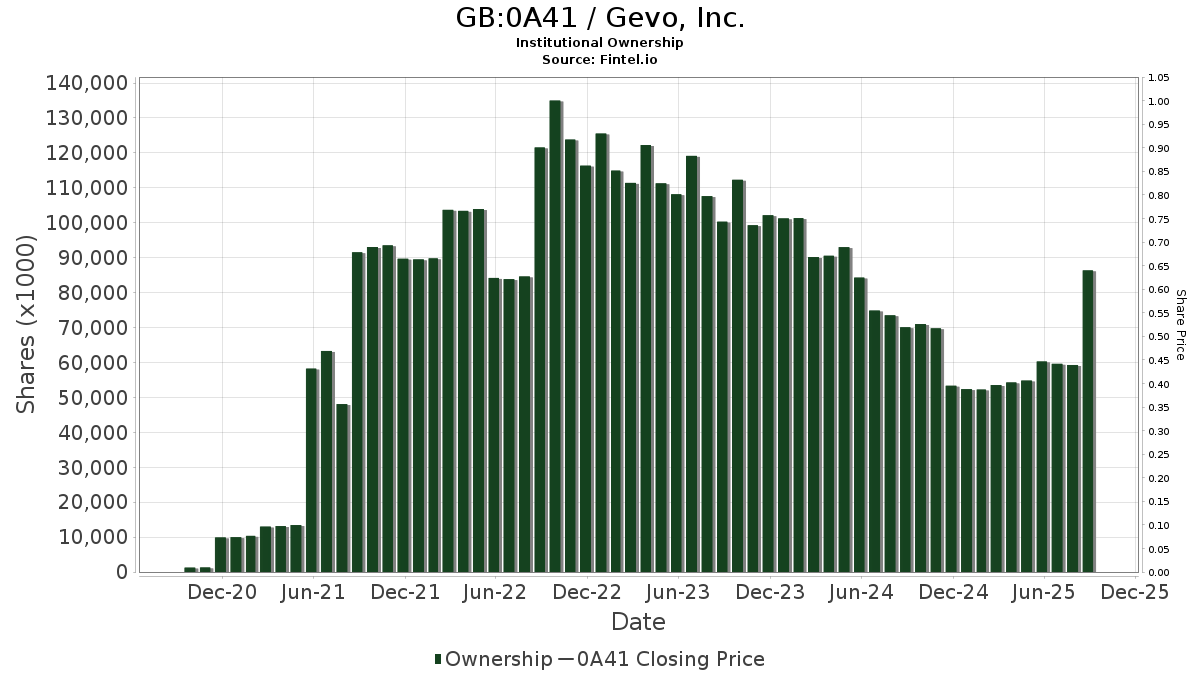
| Institutionelle aktier (lange) | 87.229.021 - 35,91% (ex 13D/G) - change of -9,31MM shares -9,64% MRQ |
| Institutionel værdi (lang) | $ 175.764 USD ($1000) |
Institutionelt ejerskab og aktionærer
Gevo, Inc. (GB:0A41) har 161 institutionelle ejere og aktionærer, der har indsendt 13D/G- eller 13F-formularer til Securities Exchange Commission (SEC). Disse institutioner har i alt 87,229,021 aktier. Største aktionærer omfatter BlackRock, Inc., Vanguard Group Inc, State Street Corp, UBS Group AG, Invesco Ltd., Geode Capital Management, Llc, Nuveen, LLC, First Bank & Trust, Goldman Sachs Group Inc, and Northern Trust Corp .
Gevo, Inc. (LSE:0A41) institutionel ejerskabsstruktur viser aktuelle positioner i virksomheden efter institutioner og fonde, samt seneste ændringer i positionsstørrelse. Større aktionærer kan omfatte individuelle investorer, investeringsforeninger, hedgefonde eller institutioner. Skema 13D angiver, at investoren besidder (eller besidder) mere end 5 % af virksomheden og har til hensigt (eller har til hensigt at) aktivt at forfølge en ændring i forretningsstrategi. Skema 13G indikerer en passiv investering på over 5%.
The share price as of April 22, 2026 is 1,87 / share. Previously, on December 2, 2025, the share price was 2,15 / share. This represents a decline of 13,02% over that period.
Fondens stemningsscore
Fund Sentiment Score (fka Ownership Accumulation Score) finder de aktier, der bliver mest købt af fonde. Det er resultatet af en sofistikeret, multi-faktor kvantitativ model, der identificerer virksomheder med de højeste niveauer af institutionel akkumulering. Scoringsmodellen bruger en kombination af den samlede stigning i oplyste ejere, ændringerne i porteføljeallokeringer i disse ejere og andre målinger. Tallet går fra 0 til 100, hvor højere tal indikerer et højere niveau af akkumulering for sine jævnaldrende, og 50 er gennemsnittet.
Opdateringsfrekvens: Dagligt
Se Ownership Explorer, som giver en liste over højest rangerende virksomheder.
AI+ Ask Fintel’s AI assistant about Gevo, Inc..
Select a question to share a public post with an AI-crafted answer.
Thinking of good questions…
13F og NPORT arkivering
Detaljer om 13F-arkivering er gratis. Detaljer om NP-ansøgninger kræver et premium-medlemskab. Grønne rækker angiver nye positioner. Røde rækker angiver lukkede positioner. Klik på linket ikon for at se den fulde transaktionshistorik.
Opgrader
for at låse premium-data op og eksportere til Excel ![]() .
.
| Fil dato | Kilde | Investor | Type | Gennemsnitlig pris (Øst) |
Aktier | Δ Aktier (%) |
Rapporteret Værdi ($1000) |
Δ Værdi (%) |
Port Alloc (%) |
|
|---|---|---|---|---|---|---|---|---|---|---|
| 2025-11-14 | 13F | WNY Asset Management, LLC | 50.000 | 0,00 | 98 | 48,48 | ||||
| 2026-02-17 | 13F | Jump Financial, LLC | 20.536 | 41 | ||||||
| 2025-11-14 | 13F | Wolverine Trading, Llc | Call | 0 | -100,00 | 0 | -100,00 | |||
| 2025-11-12 | 13F | Pinnacle Financial Group, LLC / IL | 0 | -100,00 | 0 | -100,00 | ||||
| 2026-02-13 | 13F | Citigroup Inc | 108.027 | 64,73 | 216 | 68,75 | ||||
| 2026-02-09 | 13F | Harbour Investments, Inc. | 4.850 | 0,00 | 10 | 0,00 | ||||
| 2026-02-17 | 13F | Amundi | 107.903 | -9,23 | 216 | -18,25 | ||||
| 2026-02-17 | 13F | California State Teachers Retirement System | 14.247 | -1,41 | 28 | 0,00 | ||||
| 2026-02-13 | 13F | Prudential Financial Inc | 12.885 | -52,22 | 26 | -51,92 | ||||
| 2026-02-13 | 13F | State Street Corp | 8.424.375 | 12,62 | 16.849 | 14,92 | ||||
| 2026-02-17 | 13F | Citadel Advisors Llc | Put | 0 | -100,00 | 0 | -100,00 | |||
| 2026-02-17 | 13F | Cetera Investment Advisers | 49.137 | 28,98 | 98 | 32,43 | ||||
| 2026-02-23 | 13F | Virtu Financial LLC | 101.565 | 0 | ||||||
| 2026-02-03 | 13F | Luken Investment Analytics, LLC | 450 | 0,00 | 1 | |||||
| 2026-01-15 | 13F | Nisa Investment Advisors, Llc | 339 | 0,00 | 1 | |||||
| 2026-02-17 | 13F | Royal Bank Of Canada | 11.623 | -98,95 | 23 | -98,94 | ||||
| 2026-02-17 | 13F | Creative Planning | 28.110 | -37,00 | 56 | -35,63 | ||||
| 2026-03-12 | 13F/A | Peak6 Llc | Call | 1.033.300 | 61,18 | 2.067 | 64,49 | |||
| 2026-02-13 | 13F | Victory Capital Management Inc | 26.568 | 0,25 | 53 | 3,92 | ||||
| 2026-02-10 | 13F | Intech Investment Management Llc | 131.185 | 17,61 | 262 | 20,18 | ||||
| 2026-03-23 | 13F | J. Derek Lewis & Associates Inc. | 435.000 | 870 | ||||||
| 2025-11-21 | 13F/A | Alpine Global Management, LLC | 0 | -100,00 | 0 | -100,00 | ||||
| 2026-01-30 | 13F | Us Bancorp \de\ | 7.059 | -22,33 | 14 | -17,65 | ||||
| 2026-02-12 | 13F | Quadrant Capital Group Llc | 5.656 | 0,00 | 11 | 0,00 | ||||
| 2026-02-11 | 13F | Ameritas Investment Partners, Inc. | 19.627 | -16,93 | 39 | -15,22 | ||||
| 2026-02-13 | 13F | Barclays Plc | 505.129 | 53,67 | 1.010 | 56,83 | ||||
| 2026-01-29 | 13F | Ashton Thomas Private Wealth, LLC | 11.275 | 23 | ||||||
| 2026-02-17 | 13F | Bayesian Capital Management, LP | 0 | -100,00 | 0 | -100,00 | ||||
| 2026-02-11 | 13F | LPL Financial LLC | 47.373 | 7,88 | 95 | 9,30 | ||||
| 2026-03-06 | 13F | Hsbc Holdings Plc | 16.841 | 11,11 | 34 | 13,79 | ||||
| 2026-02-13 | 13F | Squarepoint Ops LLC | 246.748 | 856,24 | 493 | 886,00 | ||||
| 2026-02-12 | 13F | Voya Investment Management Llc | 43.494 | 0,00 | 87 | 1,18 | ||||
| 2026-02-05 | 13F | Plante Moran Financial Advisors, LLC | 1.000 | 2 | ||||||
| 2026-02-06 | 13F | HighTower Advisors, LLC | 0 | -100,00 | 0 | -100,00 | ||||
| 2026-01-26 | 13F | Cwm, Llc | 164 | -92,22 | 0 | |||||
| 2026-02-17 | 13F | Fmr Llc | 39.386 | 64,16 | 79 | 65,96 | ||||
| 2026-02-17 | 13F | Advisor Group Holdings, Inc. | 35.602 | 6,54 | 71 | 10,94 | ||||
| 2026-01-27 | 13F | Berger Financial Group, Inc | 13.000 | 26 | ||||||
| 2026-04-17 | 13F | Hamilton Capital Partners, Llc | 0 | -100,00 | 0 | -100,00 | ||||
| 2026-01-29 | 13F | UBS Group AG | 6.055.352 | -36,43 | 12.111 | -35,13 | ||||
| 2026-02-10 | 13F | Goldman Sachs Group Inc | 2.859.441 | 118,09 | 5.719 | 122,58 | ||||
| 2026-04-13 | 13F | Creative Financial Designs Inc /adv | 0 | -100,00 | 0 | |||||
| 2026-04-07 | 13F | CoreCap Advisors, LLC | 200 | 0,00 | 1 | |||||
| 2026-02-17 | 13F | Maripau Wealth Management Llc | 12.710 | 22,68 | 25 | 25,00 | ||||
| 2026-02-17 | 13F | Grantham, Mayo, Van Otterloo & Co. LLC | 1.491.838 | -22,96 | 2.984 | -21,40 | ||||
| 2026-02-12 | 13F | BlackRock, Inc. | 17.370.794 | 0,57 | 34.742 | 2,63 | ||||
| 2026-02-05 | 13F | Amalgamated Bank | 7.271 | -8,01 | 0 | |||||
| 2025-11-20 | 13F | First Affirmative Financial Network | 10.295 | -18,36 | 20 | 25,00 | ||||
| 2026-01-27 | 13F | TD Waterhouse Canada Inc. | 20 | 0,00 | 0 | |||||
| 2026-04-16 | 13F | First Community Trust Na | 1.000 | 0,00 | 3 | 0,00 | ||||
| 2026-02-17 | 13F | Alliancebernstein L.p. | 21.000 | 42 | ||||||
| 2026-02-19 | 13F | Invesco Ltd. | 5.878.866 | 41,34 | 11.758 | 44,22 | ||||
| 2026-02-10 | 13F | Financially Speaking Inc | 0 | -100,00 | 0 | -100,00 | ||||
| 2026-01-14 | 13F | Jfs Wealth Advisors, Llc | 0 | -100,00 | 0 | |||||
| 2026-02-06 | 13F | EverSource Wealth Advisors, LLC | 714 | 0,00 | 1 | 0,00 | ||||
| 2026-02-11 | 13F | Jpmorgan Chase & Co | 357.307 | 234,74 | 715 | 241,63 | ||||
| 2026-02-17 | 13F | Bank Of America Corp /de/ | 821.780 | 147,38 | 1.644 | 152,38 | ||||
| 2026-02-11 | 13F | Franklin Resources Inc | 13.945 | 28 | ||||||
| 2026-02-18 | 13F | GWM Advisors LLC | 95.214 | -0,47 | 190 | 1,60 | ||||
| 2026-02-13 | 13F | Verition Fund Management LLC | 50.148 | 3,21 | 100 | 5,26 | ||||
| 2026-02-17 | 13F | Abel Hall, LLC | 18.116 | 36 | ||||||
| 2026-02-12 | 13F | Renaissance Technologies Llc | 872.794 | 1.746 | ||||||
| 2026-02-12 | 13F | Xponance, Inc. | 17.796 | -0,90 | 36 | 0,00 | ||||
| 2026-02-11 | 13F | Simplex Trading, Llc | Put | 39.800 | -29,43 | 80 | ||||
| 2026-01-12 | 13F | VisionPoint Advisory Group, LLC | 28.057 | 0,00 | 56 | 3,70 | ||||
| 2026-02-11 | 13F | Simplex Trading, Llc | Call | 685.100 | 1.566,91 | 1.370 | ||||
| 2026-02-13 | 13F | Motiv8 Investments LLC | 200 | 0 | ||||||
| 2025-11-14 | 13F | Wiley Bros.-aintree Capital, Llc | 0 | -100,00 | 0 | -100,00 | ||||
| 2026-02-10 | 13F | State of Wyoming | 28.502 | 57 | ||||||
| 2026-02-10 | 13F | Bnp Paribas Arbitrage, Sa | 377.106 | 777,56 | 754 | 797,62 | ||||
| 2026-02-06 | 13F | ProShare Advisors LLC | 42.292 | 6,87 | 85 | 9,09 | ||||
| 2026-02-13 | 13F | Charles Schwab Investment Management Inc | 665.294 | -2,52 | 1.331 | -0,52 | ||||
| 2026-02-13 | 13F | Wells Fargo & Company/mn | 418.334 | 17,75 | 837 | 20,11 | ||||
| 2026-02-24 | 13F | Alternative Investment Advisors, LLC. | 73.328 | 0,00 | 147 | 2,10 | ||||
| 2026-02-12 | 13F | Alps Advisors Inc | 332.159 | -5,39 | 664 | -3,49 | ||||
| 2026-04-09 | 13F | Key Client Fiduciary Advisors, LLC | 11.138 | -12,56 | 30 | 20,00 | ||||
| 2026-04-20 | 13F | Friedenthal Financial | 1.000 | 3 | ||||||
| 2026-02-11 | 13F | Los Angeles Capital Management Llc | 210.863 | 477 | ||||||
| 2026-02-17 | 13F | Cresset Asset Management, LLC | 10.915 | 0,00 | 22 | 0,00 | ||||
| 2026-02-17 | 13F | Two Sigma Advisers, Lp | 57.900 | -15,47 | 116 | -14,18 | ||||
| 2026-01-30 | 13F | AMG National Trust Bank | 101.339 | 0,00 | 203 | 2,02 | ||||
| 2026-02-09 | 13F | HBK Sorce Advisory LLC | 16.205 | 0,00 | 31 | -26,83 | ||||
| 2026-02-17 | 13F | Tower Research Capital LLC (TRC) | 15.437 | 118,01 | 31 | 130,77 | ||||
| 2026-02-12 | 13F | Dimensional Fund Advisors Lp | 63.336 | -48,22 | 127 | -47,28 | ||||
| 2026-02-13 | 13F | Caitong International Asset Management Co., Ltd | 36.961 | 69,12 | 74 | 73,81 | ||||
| 2026-02-12 | 13F | MetLife Investment Management, LLC | 96.761 | -19,48 | 194 | -17,87 | ||||
| 2026-04-23 | 13F | SJS Investment Consulting Inc. | 840 | 2 | ||||||
| 2026-02-12 | 13F | Cibc World Markets Corp | 15.310 | -46,31 | 31 | -18,92 | ||||
| 2026-02-13 | 13F | Kilter Group LLC | 750 | -25,00 | 2 | 0,00 | ||||
| 2026-02-13 | 13F | Gts Securities Llc | 0 | -100,00 | 0 | -100,00 | ||||
| 2026-02-17 | 13F | Millennium Management Llc | 87.864 | 20,06 | 176 | 22,38 | ||||
| 2026-02-17 | 13F | Aqr Capital Management Llc | 64.406 | 7,33 | 129 | 9,40 | ||||
| 2026-02-17 | 13F | Price T Rowe Associates Inc /md/ | 280.772 | -22,72 | 1 | |||||
| 2026-02-05 | 13F | Allworth Financial LP | 148 | 1.544,44 | 0 | |||||
| 2026-02-17 | 13F | Northern Trust Corp | 1.635.666 | -7,75 | 3.271 | -5,87 | ||||
| 2026-02-10 | 13F | Rothschild Investment Llc | 19 | 0 | ||||||
| 2026-02-09 | 13F | Geode Capital Management, Llc | 5.662.046 | -0,07 | 11.327 | 1,97 | ||||
| 2026-02-12 | 13F | New York State Common Retirement Fund | 58.400 | 0,00 | 117 | 1,75 | ||||
| 2026-02-17 | 13F | Quadrature Capital Ltd | 0 | -100,00 | 0 | -100,00 | ||||
| 2026-02-10 | 13F | Quantbot Technologies LP | 145.216 | 90,57 | 290 | 94,63 | ||||
| 2026-02-17 | 13F | Engineers Gate Manager LP | 42.417 | 1,55 | 85 | 3,70 | ||||
| 2026-02-17 | 13F | Russell Investments Group, Ltd. | 28.279 | -9,76 | 57 | -8,20 | ||||
| 2026-04-03 | 13F | Global Wealth Strategies & Associates | 40 | 0,00 | 0 | |||||
| 2026-02-11 | 13F | Simplex Trading, Llc | 0 | -100,00 | 0 | |||||
| 2026-02-12 | 13F | Federation des caisses Desjardins du Quebec | 13.654 | -2,85 | 27 | 0,00 | ||||
| 2026-02-17 | 13F | Cape Investment Advisory, Inc. | 2.570 | 0,00 | 5 | 0,00 | ||||
| 2026-02-13 | 13F | Arete Wealth Advisors, LLC | 19.046 | 0,00 | 0 | |||||
| 2026-01-29 | 13F | Vanguard Group Inc | 15.645.461 | 1,04 | 31.291 | 3,10 | ||||
| 2026-02-12 | 13F | Jane Street Group, Llc | Call | 76.300 | 373,91 | 153 | 390,32 | |||
| 2026-02-12 | 13F | Marex Group plc | 188.000 | 571,43 | 376 | 596,30 | ||||
| 2026-02-13 | 13F | Pinnacle Wealth Planning Services, Inc. | 290 | 1 | ||||||
| 2026-02-17 | 13F | Wellington Management Group Llp | 81.815 | -1,27 | 164 | 0,62 | ||||
| 2026-04-10 | 13F | First Bank & Trust | 3.064.948 | 0,00 | 8.367 | 36,51 | ||||
| 2026-01-13 | 13F | Stonehage Fleming Financial Services Holdings Ltd | 185.220 | 0,00 | 370 | 1,93 | ||||
| 2026-02-10 | 13F | Root Financial Partners, LLC | 0 | -100,00 | 0 | |||||
| 2026-02-12 | 13F | Jane Street Group, Llc | 279.371 | -60,43 | 559 | -59,65 | ||||
| 2026-04-06 | 13F | GAMMA Investing LLC | 3.160 | -27,56 | 9 | 0,00 | ||||
| 2026-02-12 | 13F | Jane Street Group, Llc | Put | 11.900 | 24 | |||||
| 2026-02-17 | 13F | XTX Topco Ltd | 82.023 | 164 | ||||||
| 2026-04-22 | 13F | Sterling Capital Management LLC | 7.753 | -43,25 | 21 | -22,22 | ||||
| 2026-02-13 | 13F | American Century Companies Inc | 169.918 | 291,05 | 340 | 298,82 | ||||
| 2026-02-17 | 13F | Raymond James Financial Inc | 12.665 | -20,92 | 25 | -19,35 | ||||
| 2026-02-12 | 13F | DRW Securities, LLC | 10.907 | 22 | ||||||
| 2026-02-12 | 13F | Rossby Financial, LCC | 116 | -92,82 | 0 | -100,00 | ||||
| 2025-11-21 | 13F/A | CIBC Bancorp USA Inc. | 24.669 | 48 | ||||||
| 2026-02-13 | 13F | Walleye Capital LLC | Put | 3.900 | 8 | |||||
| 2026-02-13 | 13F | Sei Investments Co | 16.696 | -80,20 | 33 | -80,00 | ||||
| 2026-02-17 | 13F | Credit Agricole S A | 414.000 | 828 | ||||||
| 2025-11-14 | 13F | Wolverine Trading, Llc | Put | 0 | -100,00 | 0 | -100,00 | |||
| 2026-02-03 | 13F | International Assets Investment Management, Llc | 7.000 | 14 | ||||||
| 2026-02-06 | 13F | Leonteq Securities AG | 8.047 | 16 | ||||||
| 2026-02-13 | 13F | Manufacturers Life Insurance Company, The | 0 | -100,00 | 0 | |||||
| 2026-02-13 | 13F | Rafferty Asset Management, LLC | 349.795 | 22,23 | 700 | 24,82 | ||||
| 2026-02-13 | 13F | Walleye Capital LLC | Call | 30.000 | 60 | |||||
| 2026-02-03 | 13F | SBI Securities Co., Ltd. | 56.429 | -76,64 | 113 | -76,32 | ||||
| 2026-02-12 | 13F | Nuveen, LLC | 4.138.251 | 107,72 | 8.277 | 111,99 | ||||
| 2026-02-05 | 13F | Cambridge Investment Research Advisors, Inc. | 16.353 | 0,00 | 0 | |||||
| 2026-02-17 | 13F | MIRAE ASSET GLOBAL ETFS HOLDINGS Ltd. | 107.464 | 1,21 | 215 | 2,88 | ||||
| 2026-02-13 | 13F | JustInvest LLC | 30.779 | 4,35 | 62 | 7,02 | ||||
| 2026-02-17 | 13F | IHT Wealth Management, LLC | 11.617 | 0,04 | 23 | 4,55 | ||||
| 2026-04-17 | 13F | CENTRAL TRUST Co | 15.935 | 0,00 | 44 | 38,71 | ||||
| 2026-02-06 | 13F | Pnc Financial Services Group, Inc. | 14.393 | -12,55 | 29 | -12,50 | ||||
| 2026-02-17 | 13F | Brevan Howard Capital Management LP | 25.600 | -60,52 | 51 | -59,84 | ||||
| 2026-02-13 | 13F | MAI Capital Management | 11.381 | 2.887,14 | 23 | |||||
| 2026-04-16 | 13F | SG Americas Securities, LLC | 88.556 | -22,52 | 0 | |||||
| 2026-02-13 | 13F | Headlands Technologies LLC | 32.437 | -82,17 | 65 | -82,02 | ||||
| 2026-02-13 | 13F | SRS Capital Advisors, Inc. | 1 | -99,93 | 0 | -100,00 | ||||
| 2026-02-18 | 13F | Mackenzie Financial Corp | 14.885 | 0,00 | 29 | 0,00 | ||||
| 2026-02-12 | 13F | Commonwealth Equity Services, Llc | 30.581 | -5,59 | 61 | |||||
| 2026-04-07 | 13F | Signaturefd, Llc | 5.916 | 0,00 | 16 | 45,45 | ||||
| 2026-02-13 | 13F | Morgan Stanley | 1.036.048 | 47,60 | 2.072 | 50,69 | ||||
| 2026-02-17 | 13F | Two Sigma Securities, Llc | 96.691 | 185,58 | 193 | 192,42 | ||||
| 2026-02-17 | 13F | Jones Financial Companies Lllp | 4.520 | 40,59 | 9 | 50,00 | ||||
| 2025-11-06 | 13F | Financial Advocates Investment Management | 0 | -100,00 | 0 | |||||
| 2026-02-13 | 13F | Rhumbline Advisers | 222.707 | -23,15 | 445 | -21,52 | ||||
| 2026-01-30 | 13F | R Squared Ltd | 16.031 | -26,16 | 32 | -23,81 | ||||
| 2026-02-03 | 13F | Ballentine Partners, LLC | 24.124 | -14,41 | 48 | -12,73 | ||||
| 2026-04-15 | 13F | Seacrest Wealth Management, Llc | 10.000 | 0,00 | 27 | 42,11 | ||||
| 2026-02-10 | 13F | Bank of New York Mellon Corp | 597.649 | 5,07 | 1.195 | 7,27 | ||||
| 2026-02-13 | 13F | First Trust Advisors Lp | 576.445 | 0,62 | 1.153 | 2,67 | ||||
| 2026-02-17 | 13F | Balyasny Asset Management Llc | 17.408 | 35 | ||||||
| 2026-02-20 | 13F | Sunbelt Securities, Inc. | 975 | 0,00 | 2 | 0,00 | ||||
| 2026-03-09 | 13F/A | CI Private Wealth, LLC | 11.450 | 0,00 | 23 | 0,00 | ||||
| 2026-02-13 | 13F | National Bank Of Canada /fi/ | 9.010 | 577,95 | 18 | 750,00 | ||||
| 2026-02-17 | 13F | Two Sigma Investments, Lp | 37.974 | -90,11 | 76 | -90,03 | ||||
| 2026-02-17 | 13F | Sabby Management, Llc | Put | 6.274 | 347,18 | 1.255 | 357,66 | |||
| 2026-01-20 | 13F | Savvy Advisors, Inc. | 11.628 | 23 | ||||||
| 2026-02-09 | 13F | Legal & General Group Plc | 21.073 | 0,00 | 42 | 2,44 | ||||
| 2026-04-23 | 13F | CWM Advisors, LLC | 190.226 | -19,74 | 519 | 9,49 | ||||
| 2026-02-03 | 13F | Centerpoint Advisory Group | 54.000 | 0,00 | 108 | 2,86 | ||||
| 2026-02-04 | 13F | Valeo Financial Advisors, LLC | 10.000 | 0,00 | 20 | 5,26 | ||||
| 2026-02-17 | 13F | Citadel Advisors Llc | 939.337 | -57,68 | 1.879 | -56,83 | ||||
| 2026-04-22 | 13F | Janney Montgomery Scott LLC | 35.200 | 0,00 | 0 | |||||
| 2026-02-17 | 13F | Citadel Advisors Llc | Call | 209.400 | 517,70 | 419 | 533,33 | |||
| 2026-02-12 | 13F | Steward Partners Investment Advisory, Llc | 30 | 0,00 | 0 | |||||
| 2026-02-17 | 13F | Susquehanna International Group, Llp | 619.668 | 12,90 | 1.239 | 15,26 | ||||
| 2026-02-05 | 13F | HighMark Wealth Management LLC | 2.500 | 0,00 | 5 | 25,00 | ||||
| 2026-02-11 | 13F | Group One Trading, L.p. | Put | 67.300 | -25,80 | 135 | -24,29 | |||
| 2026-02-09 | 13F | Huntington National Bank | 10 | 0,00 | 0 | |||||
| 2026-02-02 | 13F | Principal Financial Group Inc | 0 | -100,00 | 0 | -100,00 | ||||
| 2026-02-05 | 13F | Western Wealth Management, LLC | 45.000 | -43,75 | 90 | -42,31 | ||||
| 2026-02-11 | 13F | Group One Trading, L.p. | Call | 528.300 | -16,32 | 1.057 | -14,63 | |||
| 2026-02-13 | 13F | Baird Financial Group, Inc. | 51.500 | 106,00 | 103 | 110,20 | ||||
| 2026-02-11 | 13F | Deutsche Bank Ag\ | 251.535 | 0,23 | 503 | 2,44 | ||||
| 2026-02-17 | 13F | Susquehanna International Group, Llp | Put | 91.400 | -49,70 | 183 | -48,88 | |||
| 2026-02-17 | 13F | Susquehanna International Group, Llp | Call | 853.100 | 170,57 | 1.706 | 176,50 | |||
| 2026-02-13 | 13F | Police & Firemen's Retirement System of New Jersey | 63.313 | 0,00 | 127 | 1,61 | ||||
| 2026-04-07 | 13F | Farther Finance Advisors, LLC | 212 | 5,47 | 1 | |||||
| 2026-02-11 | 13F | Rise Advisors, LLC | 0 | -100,00 | 0 |