Grundlæggende statistik
| Institutionelle aktier (lange) | 22.013.947 - 255,64% (ex 13D/G) - change of -0,43MM shares -1,92% MRQ |
| Institutionel værdi (lang) | $ 12.905 USD ($1000) |
Institutionelt ejerskab og aktionærer
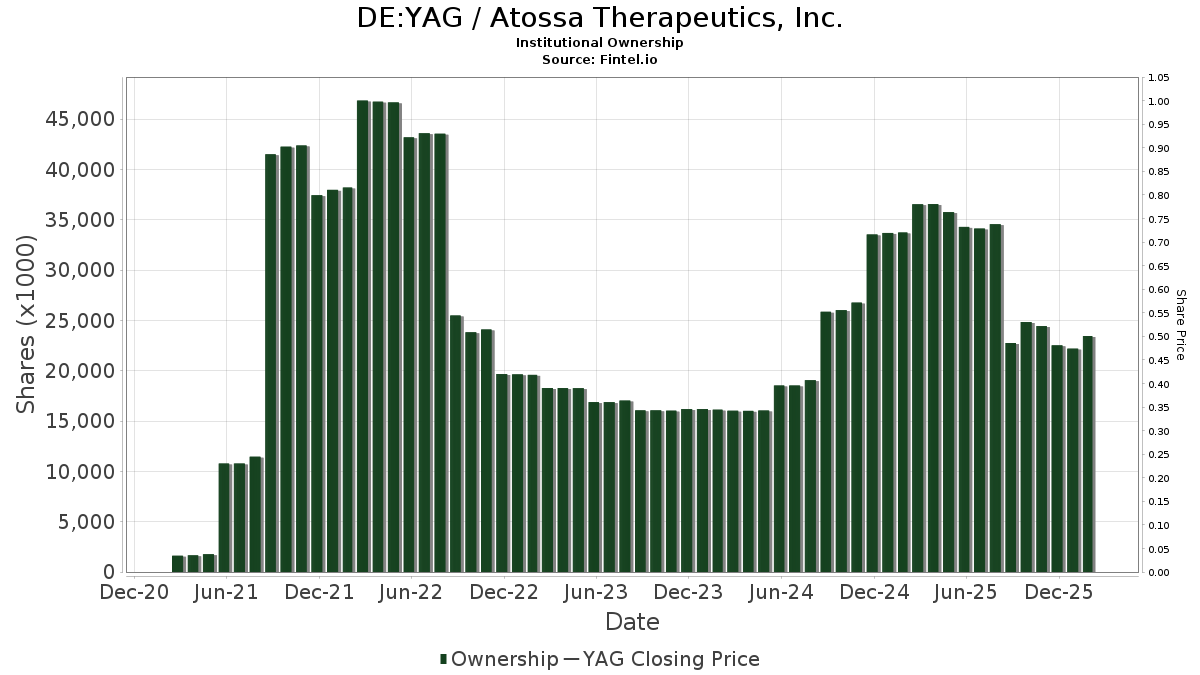
Atossa Therapeutics, Inc. (DE:YAG) har 69 institutionelle ejere og aktionærer, der har indsendt 13D/G- eller 13F-formularer til Securities Exchange Commission (SEC). Disse institutioner har i alt 22,013,947 aktier. Største aktionærer omfatter Vanguard Group Inc, Ameriprise Financial Inc, Renaissance Technologies Llc, BlackRock, Inc., Geode Capital Management, Llc, Millennium Management Llc, Jacobs Levy Equity Management, Inc, Citadel Advisors Llc, State Street Corp, and Susquehanna International Group, Llp .
Atossa Therapeutics, Inc. (DB:YAG) institutionel ejerskabsstruktur viser aktuelle positioner i virksomheden efter institutioner og fonde, samt seneste ændringer i positionsstørrelse. Større aktionærer kan omfatte individuelle investorer, investeringsforeninger, hedgefonde eller institutioner. Skema 13D angiver, at investoren besidder (eller besidder) mere end 5 % af virksomheden og har til hensigt (eller har til hensigt at) aktivt at forfølge en ændring i forretningsstrategi. Skema 13G indikerer en passiv investering på over 5%.
Fondens stemningsscore
Fund Sentiment Score (fka Ownership Accumulation Score) finder de aktier, der bliver mest købt af fonde. Det er resultatet af en sofistikeret, multi-faktor kvantitativ model, der identificerer virksomheder med de højeste niveauer af institutionel akkumulering. Scoringsmodellen bruger en kombination af den samlede stigning i oplyste ejere, ændringerne i porteføljeallokeringer i disse ejere og andre målinger. Tallet går fra 0 til 100, hvor højere tal indikerer et højere niveau af akkumulering for sine jævnaldrende, og 50 er gennemsnittet.
Opdateringsfrekvens: Dagligt
Se Ownership Explorer, som giver en liste over højest rangerende virksomheder.
AI+ Ask Fintel’s AI assistant about Atossa Therapeutics, Inc..
Select a question to share a public post with an AI-crafted answer.
Thinking of good questions…
13F og NPORT arkivering
Detaljer om 13F-arkivering er gratis. Detaljer om NP-ansøgninger kræver et premium-medlemskab. Grønne rækker angiver nye positioner. Røde rækker angiver lukkede positioner. Klik på linket ikon for at se den fulde transaktionshistorik.
Opgrader
for at låse premium-data op og eksportere til Excel ![]() .
.
| Fil dato | Kilde | Investor | Type | Gennemsnitlig pris (Øst) |
Aktier | Δ Aktier (%) |
Rapporteret Værdi ($1000) |
Δ Værdi (%) |
Port Alloc (%) |
|
|---|---|---|---|---|---|---|---|---|---|---|
| 2026-02-17 | 13F | Jones Financial Companies Lllp | 700 | 0,00 | 0 | |||||
| 2025-11-14 | 13F | Virtu Financial LLC | 0 | -100,00 | 0 | |||||
| 2026-02-17 | 13F | Fmr Llc | 7.365 | 0,00 | 4 | -33,33 | ||||
| 2026-02-13 | 13F | SRS Capital Advisors, Inc. | 42 | 0,00 | 0 | |||||
| 2026-02-17 | 13F | Two Sigma Advisers, Lp | 18.300 | 11 | ||||||
| 2026-02-17 | 13F | NorthRock Partners, LLC | 0 | -100,00 | 0 | |||||
| 2026-02-13 | 13F | Barclays Plc | 0 | -100,00 | 0 | |||||
| 2026-02-17 | 13F | Citadel Advisors Llc | Call | 85.800 | 240,48 | 51 | 138,10 | |||
| 2026-02-17 | 13F | XTX Topco Ltd | 169.261 | 581,16 | 100 | 371,43 | ||||
| 2026-02-17 | 13F | Citadel Advisors Llc | Put | 31.800 | -5,64 | 19 | -37,93 | |||
| 2026-02-09 | 13F | Hantz Financial Services, Inc. | 82 | 0,00 | 0 | |||||
| 2026-02-12 | 13F | BlackRock, Inc. | 1.997.627 | 0,00 | 1.179 | -31,95 | ||||
| 2026-02-17 | 13F | Citadel Advisors Llc | 648.115 | 146,09 | 382 | 67,54 | ||||
| 2026-02-03 | 13F | SBI Securities Co., Ltd. | 1.565 | -0,06 | 1 | -100,00 | ||||
| 2025-11-14 | 13F | ExodusPoint Capital Management, LP | 0 | -100,00 | 0 | |||||
| 2026-01-26 | 13F | Cwm, Llc | 50 | -77,78 | 0 | |||||
| 2026-02-17 | 13F | Susquehanna International Group, Llp | Call | 0 | -100,00 | 0 | -100,00 | |||
| 2025-11-14 | 13F | Point72 (DIFC) Ltd | 82 | -99,02 | 0 | -100,00 | ||||
| 2025-11-13 | 13F | Hudson Bay Capital Management LP | 0 | -100,00 | 0 | |||||
| 2025-11-14 | 13F | Goldman Sachs Group Inc | 0 | -100,00 | 0 | |||||
| 2026-01-30 | 13F | R Squared Ltd | 28.099 | 17 | ||||||
| 2026-02-17 | 13F | Point72 Asset Management, L.P. | 48.092 | 28 | ||||||
| 2026-02-17 | 13F | Qube Research & Technologies Ltd | 72.802 | -47,49 | 43 | -65,00 | ||||
| 2026-02-11 | 13F | Simplex Trading, Llc | Call | 87.300 | 1.285,71 | 52 | ||||
| 2026-02-10 | 13F | Connor, Clark & Lunn Investment Management Ltd. | 266.010 | 7,00 | 157 | -27,44 | ||||
| 2025-11-04 | 13F | Guerra Advisors Inc | 0 | -100,00 | 0 | |||||
| 2025-11-21 | 13F/A | Alpine Global Management, LLC | 0 | -100,00 | 0 | -100,00 | ||||
| 2025-11-12 | 13F | Catalyst Funds Management Pty Ltd | 0 | -100,00 | 0 | |||||
| 2026-02-17 | 13F | Royal Bank Of Canada | 943 | 26,58 | 1 | 0,00 | ||||
| 2026-02-05 | 13F | Allworth Financial LP | 702 | 0,00 | 0 | |||||
| 2026-02-11 | 13F | Group One Trading, L.p. | Put | 33.600 | 0,30 | 20 | -34,48 | |||
| 2025-11-13 | 13F | Hsbc Holdings Plc | 0 | -100,00 | 0 | -100,00 | ||||
| 2026-02-11 | 13F | Group One Trading, L.p. | Call | 67.300 | -60,13 | 40 | -73,29 | |||
| 2026-02-11 | 13F | Group One Trading, L.p. | 6.662 | 4 | ||||||
| 2025-10-31 | 13F | Y-Intercept (Hong Kong) Ltd | 0 | -100,00 | 0 | -100,00 | ||||
| 2025-11-14 | 13F | Point72 Asia (Singapore) Pte. Ltd. | 44.106 | -50,00 | 38 | -47,95 | ||||
| 2026-02-13 | 13F | Morgan Stanley | 61.500 | -45,26 | 36 | -62,89 | ||||
| 2025-11-14 | 13F/A | Skopos Labs, Inc. | 0 | -100,00 | 0 | |||||
| 2025-11-06 | 13F | Ground Swell Capital, LLC | 0 | -100,00 | 0 | -100,00 | ||||
| 2026-02-17 | 13F | Northern Trust Corp | 288.399 | 9,50 | 170 | -25,44 | ||||
| 2026-02-06 | 13F | EverSource Wealth Advisors, LLC | 0 | -100,00 | 0 | |||||
| 2026-02-17 | 13F | Jain Global LLC | 0 | -100,00 | 0 | |||||
| 2026-02-17 | 13F | Tower Research Capital LLC (TRC) | 3.999 | 58,94 | 2 | 0,00 | ||||
| 2026-01-22 | 13F | Greenberg Financial Group | 18.216 | 11 | ||||||
| 2026-01-29 | 13F | Vanguard Group Inc | 6.147.838 | 1,13 | 3.627 | -31,18 | ||||
| 2026-02-09 | 13F | Harbour Investments, Inc. | 1.656 | -3,21 | 1 | -100,00 | ||||
| 2026-02-06 | 13F | Gsa Capital Partners Llp | 0 | -100,00 | 0 | |||||
| 2026-02-05 | 13F | DnB Asset Management AS | 15.600 | 0,00 | 9 | -30,77 | ||||
| 2026-02-17 | 13F | Raymond James Financial Inc | 11.323 | 4,70 | 7 | -33,33 | ||||
| 2025-11-14 | 13F | Wolverine Trading, Llc | 18.342 | -2,23 | 16 | 0,00 | ||||
| 2025-11-14 | 13F | Wolverine Trading, Llc | Call | 27.300 | 24 | |||||
| 2025-11-14 | 13F | Wolverine Trading, Llc | Put | 28.000 | -4,76 | 24 | -4,00 | |||
| 2025-11-12 | 13F | Neuberger Berman Group LLC | 0 | -100,00 | 0 | |||||
| 2026-02-13 | 13F | Marshall Wace, Llp | 0 | -100,00 | 0 | |||||
| 2026-02-12 | 13F | Hrt Financial Lp | 0 | -100,00 | 0 | |||||
| 2025-11-12 | 13F | Aster Capital Management (DIFC) Ltd | 0 | -100,00 | 0 | |||||
| 2026-02-17 | 13F | Bank Of America Corp /de/ | 67.654 | -56,40 | 40 | -70,90 | ||||
| 2026-01-14 | 13F | J. L. Bainbridge & Co., Inc. | 11.121 | 0,00 | 7 | -33,33 | ||||
| 2026-02-09 | 13F | Huntington National Bank | 3.000 | 0,00 | 2 | -50,00 | ||||
| 2026-01-12 | 13F | Lvm Capital Management Ltd/mi | 21.000 | 0,00 | 0 | |||||
| 2026-02-11 | 13F | Simplex Trading, Llc | 0 | -100,00 | 0 | |||||
| 2025-11-13 | 13F | Jump Financial, LLC | 0 | -100,00 | 0 | |||||
| 2026-02-13 | 13F | Charles Schwab Investment Management Inc | 80.000 | 0,00 | 47 | -31,88 | ||||
| 2026-02-05 | 13F | Baader Bank INC | 21.364 | 8 | ||||||
| 2026-02-12 | 13F | StoneX Group Inc. | 19.871 | 12 | ||||||
| 2026-02-11 | 13F | LPL Financial LLC | 29.469 | 3,20 | 17 | -29,17 | ||||
| 2025-10-08 | 13F/A | New York State Common Retirement Fund | 0 | -100,00 | 0 | -100,00 | ||||
| 2026-02-17 | 13F | Millennium Management Llc | 1.242.868 | -25,52 | 733 | -49,31 | ||||
| 2026-01-27 | 13F | Regions Financial Corp | 30.000 | 0,00 | 18 | -34,62 | ||||
| 2026-02-17 | 13F | Advisor Group Holdings, Inc. | 8.847 | 0,00 | 5 | -28,57 | ||||
| 2025-11-12 | 13F | Simplex Trading, Llc | Put | 0 | -100,00 | 0 | ||||
| 2026-01-08 | 13F | True Wealth Design, LLC | 0 | -100,00 | 0 | |||||
| 2026-02-09 | 13F | Hartland & Co., LLC | 70 | 0,00 | 0 | |||||
| 2026-02-13 | 13F | Squarepoint Ops LLC | 0 | -100,00 | 0 | -100,00 | ||||
| 2026-02-17 | 13F | Graham Capital Management, L.P. | 211.369 | 27,76 | 125 | -13,29 | ||||
| 2026-02-17 | 13F | Optiver Holding B.V. | 838 | 0 | ||||||
| 2025-11-14 | 13F | Aqr Capital Management Llc | 0 | -100,00 | 0 | |||||
| 2026-01-30 | 13F | Sigma Planning Corp | 24.000 | 0,00 | 14 | -30,00 | ||||
| 2026-01-27 | 13F | TD Waterhouse Canada Inc. | 1.555 | 0,00 | 1 | -100,00 | ||||
| 2025-11-14 | 13F | Mount Yale Investment Advisors, LLC | 0 | -100,00 | 0 | |||||
| 2026-02-17 | 13F | Susquehanna International Group, Llp | 582.587 | 165,29 | 344 | 80,53 | ||||
| 2026-02-17 | 13F | Two Sigma Investments, Lp | 23.452 | 14 | ||||||
| 2026-02-14 | 13F | Rockefeller Capital Management L.P. | 5.000 | 0,00 | 3 | -50,00 | ||||
| 2026-02-17 | 13F | Susquehanna International Group, Llp | Put | 38.500 | 3,77 | 23 | -31,25 | |||
| 2026-02-10 | 13F | Bank of New York Mellon Corp | 11.147 | 0,00 | 7 | -33,33 | ||||
| 2025-11-14 | 13F | Schonfeld Strategic Advisors LLC | 0 | -100,00 | 0 | |||||
| 2026-01-26 | 13F | PFG Investments, LLC | 21.750 | 2,35 | 13 | -33,33 | ||||
| 2026-02-13 | 13F | Wells Fargo & Company/mn | 83 | 0,00 | 0 | |||||
| 2026-01-29 | 13F | Nbc Securities, Inc. | 150 | 0,00 | 0 | |||||
| 2026-01-12 | 13F | Focus Financial Network, Inc. | 10.350 | 1,97 | 6 | -25,00 | ||||
| 2025-10-14 | 13F | Evanson Asset Management, LLC | 0 | -100,00 | 0 | -100,00 | ||||
| 2026-02-12 | 13F | Commonwealth Equity Services, Llc | 0 | -100,00 | 0 | |||||
| 2026-02-10 | 13F | Acadian Asset Management Llc | 79.414 | -18,37 | 0 | |||||
| 2026-02-10 | 13F/A | Northwestern Mutual Wealth Management Co | 500 | 0 | ||||||
| 2026-02-18 | 13F | GWM Advisors LLC | 5.000 | 0,00 | 3 | -50,00 | ||||
| 2025-11-14 | 13F | Cubist Systematic Strategies, LLC | 0 | -100,00 | 0 | |||||
| 2026-02-17 | 13F | Ameriprise Financial Inc | 3.791.061 | 28,45 | 2.237 | -12,59 | ||||
| 2026-01-15 | 13F | Nisa Investment Advisors, Llc | 350 | 0,00 | 0 | |||||
| 2026-02-09 | 13F | Geode Capital Management, Llc | 1.371.909 | 0,71 | 810 | -31,50 | ||||
| 2026-02-12 | 13F | Gallagher Capital Advisors, LLC | 0 | -100,00 | 0 | |||||
| 2026-02-13 | 13F | State Street Corp | 596.485 | 31,24 | 352 | -10,91 | ||||
| 2026-02-13 | 13F | Victory Capital Management Inc | 0 | -100,00 | 0 | -100,00 | ||||
| 2026-01-29 | 13F | UBS Group AG | 390.008 | 49,59 | 230 | 1,77 | ||||
| 2026-02-12 | 13F | Jane Street Group, Llc | Call | 40.500 | 24 | |||||
| 2026-02-11 | 13F | Janney Montgomery Scott LLC | 10.000 | 0,00 | 0 | |||||
| 2026-02-12 | 13F | Jane Street Group, Llc | 245.998 | 51,45 | 145 | 3,57 | ||||
| 2025-10-30 | 13F | Twin Peaks Wealth Advisors, LLC | 0 | -100,00 | 0 | |||||
| 2026-02-12 | 13F | Renaissance Technologies Llc | 2.062.838 | 33,20 | 1.217 | -9,31 | ||||
| 2026-02-17 | 13F | Two Sigma Securities, Llc | 24.508 | 14 | ||||||
| 2026-02-10 | 13F | Bnp Paribas Arbitrage, Sa | 1.497 | 0,47 | 1 | -100,00 | ||||
| 2026-02-17 | 13F | Wiley Bros.-aintree Capital, Llc | 43.000 | 25 | ||||||
| 2026-02-13 | 13F | Jacobs Levy Equity Management, Inc | 1.048.289 | 618 | ||||||
| 2026-02-11 | 13F | Jpmorgan Chase & Co | 38.067 | -0,39 | 22 | -33,33 |