Grundlæggende statistik
| Institutionelle aktier (lange) | 49.019.584 - 96,64% (ex 13D/G) - change of -5,67MM shares -10,37% MRQ |
| Institutionel værdi (lang) | $ 442.230 USD ($1000) |
Institutionelt ejerskab og aktionærer
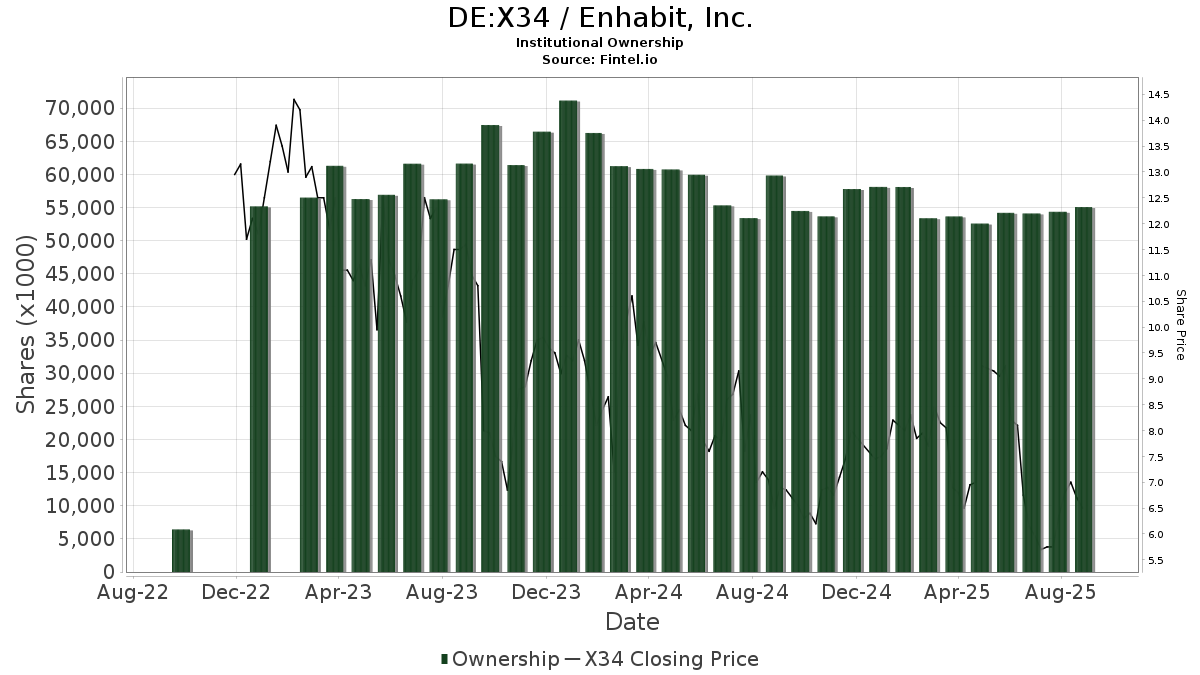
Enhabit, Inc. (DE:X34) har 168 institutionelle ejere og aktionærer, der har indsendt 13D/G- eller 13F-formularer til Securities Exchange Commission (SEC). Disse institutioner har i alt 49,019,584 aktier. Største aktionærer omfatter 8 Knots Management, Llc, Deerfield Management Company, L.p. (series C), BlackRock, Inc., Vanguard Group Inc, AREX Capital Management, LP, JANA Partners Management, LP, UBS Group AG, Systematic Financial Management Lp, Dimensional Fund Advisors Lp, and Paradice Investment Management LLC .
Enhabit, Inc. (DB:X34) institutionel ejerskabsstruktur viser aktuelle positioner i virksomheden efter institutioner og fonde, samt seneste ændringer i positionsstørrelse. Større aktionærer kan omfatte individuelle investorer, investeringsforeninger, hedgefonde eller institutioner. Skema 13D angiver, at investoren besidder (eller besidder) mere end 5 % af virksomheden og har til hensigt (eller har til hensigt at) aktivt at forfølge en ændring i forretningsstrategi. Skema 13G indikerer en passiv investering på over 5%.
The share price as of April 24, 2026 is 11,60 / share. Previously, on April 28, 2025, the share price was 6,80 / share. This represents an increase of 70,59% over that period.
Fondens stemningsscore
Fund Sentiment Score (fka Ownership Accumulation Score) finder de aktier, der bliver mest købt af fonde. Det er resultatet af en sofistikeret, multi-faktor kvantitativ model, der identificerer virksomheder med de højeste niveauer af institutionel akkumulering. Scoringsmodellen bruger en kombination af den samlede stigning i oplyste ejere, ændringerne i porteføljeallokeringer i disse ejere og andre målinger. Tallet går fra 0 til 100, hvor højere tal indikerer et højere niveau af akkumulering for sine jævnaldrende, og 50 er gennemsnittet.
Opdateringsfrekvens: Dagligt
Se Ownership Explorer, som giver en liste over højest rangerende virksomheder.
AI+ Ask Fintel’s AI assistant about Enhabit, Inc..
Select a question to share a public post with an AI-crafted answer.
Thinking of good questions…
13F og NPORT arkivering
Detaljer om 13F-arkivering er gratis. Detaljer om NP-ansøgninger kræver et premium-medlemskab. Grønne rækker angiver nye positioner. Røde rækker angiver lukkede positioner. Klik på linket ikon for at se den fulde transaktionshistorik.
Opgrader
for at låse premium-data op og eksportere til Excel ![]() .
.
| Fil dato | Kilde | Investor | Type | Gennemsnitlig pris (Øst) |
Aktier | Δ Aktier (%) |
Rapporteret Værdi ($1000) |
Δ Værdi (%) |
Port Alloc (%) |
|
|---|---|---|---|---|---|---|---|---|---|---|
| 2026-04-13 | 13F | IFP Advisors, Inc | 13 | 8,33 | 0 | |||||
| 2026-02-11 | 13F | Jpmorgan Chase & Co | 309.870 | 6,18 | 2.857 | 22,25 | ||||
| 2025-11-14 | 13F | Cubist Systematic Strategies, LLC | 0 | -100,00 | 0 | |||||
| 2026-02-17 | 13F | Ancora Advisors, LLC | 104.350 | 962 | ||||||
| 2026-01-14 | 13F | Hennion & Walsh Asset Management, Inc. | 15.428 | 142 | ||||||
| 2026-01-15 | 13F | Nisa Investment Advisors, Llc | 8.347 | 10,08 | 77 | 26,67 | ||||
| 2025-11-14 | 13F | Raymond James Financial Inc | 0 | -100,00 | 0 | |||||
| 2026-02-17 | 13F | Russell Investments Group, Ltd. | 238.205 | 83,48 | 2.196 | 111,36 | ||||
| 2025-11-14 | 13F | Point72 Asia (Singapore) Pte. Ltd. | 0 | -100,00 | 0 | -100,00 | ||||
| 2026-01-28 | 13F | DekaBank Deutsche Girozentrale | 423.412 | 0,00 | 5 | 33,33 | ||||
| 2026-02-13 | 13F | Barclays Plc | 88.810 | 11,54 | 819 | 28,41 | ||||
| 2026-02-17 | 13F | Man Group plc | 0 | -100,00 | 0 | |||||
| 2026-02-06 | 13F | Lsv Asset Management | 14.874 | 0 | ||||||
| 2026-02-17 | 13F | Advisor Group Holdings, Inc. | 2.658 | 15,21 | 25 | 33,33 | ||||
| 2026-02-17 | 13F | Susquehanna International Group, Llp | 38.641 | 28,60 | 356 | 48,33 | ||||
| 2026-02-18 | 13F | Mackenzie Financial Corp | 14.468 | 0,00 | 134 | 16,52 | ||||
| 2026-02-17 | 13F | Qube Research & Technologies Ltd | 191.130 | -43,81 | 1.762 | -35,32 | ||||
| 2026-02-17 | 13F | Alliancebernstein L.p. | 46.593 | -10,38 | 430 | 3,13 | ||||
| 2026-02-12 | 13F | Hrt Financial Lp | 231.665 | -8,71 | 2 | 0,00 | ||||
| 2026-02-17 | 13F | Citadel Advisors Llc | Call | 31.500 | 290 | |||||
| 2026-02-17 | 13F | Citadel Advisors Llc | 418.118 | 27,09 | 3.855 | 46,30 | ||||
| 2026-02-17 | 13F | Two Sigma Advisers, Lp | 93.400 | 235,97 | 861 | 287,84 | ||||
| 2026-02-14 | 13F | Rockefeller Capital Management L.P. | 491 | 58,39 | 5 | 100,00 | ||||
| 2025-11-04 | 13F | Delta Asset Management Llc/tn | 0 | -100,00 | 0 | |||||
| 2026-02-13 | 13F | Manufacturers Life Insurance Company, The | 0 | -100,00 | 0 | |||||
| 2026-02-09 | 13F | Geode Capital Management, Llc | 1.187.434 | 0,99 | 10.951 | 16,24 | ||||
| 2026-02-13 | 13F | Sei Investments Co | 83.038 | 766 | ||||||
| 2025-11-14 | 13F | National Bank Of Canada /fi/ | 0 | -100,00 | 0 | |||||
| 2026-01-21 | 13F | Phocas Financial Corp. | 0 | -100,00 | 0 | |||||
| 2026-02-10 | 13F | Bank of New York Mellon Corp | 250.621 | 33,42 | 2.311 | 53,59 | ||||
| 2026-02-17 | 13F | Price T Rowe Associates Inc /md/ | 58.556 | 6,15 | 1 | |||||
| 2026-02-13 | 13F | Verition Fund Management LLC | 18.552 | -34,88 | 171 | -25,00 | ||||
| 2026-02-12 | 13F | Integrated Quantitative Investments LLC | 47.324 | 436 | ||||||
| 2026-02-12 | 13F | Renaissance Technologies Llc | 365.800 | 2,67 | 3.373 | 18,19 | ||||
| 2025-11-14 | 13F | Atom Investors LP | 0 | -100,00 | 0 | |||||
| 2026-02-12 | 13F | Campbell & CO Investment Adviser LLC | 73.102 | 11,71 | 674 | 28,63 | ||||
| 2026-02-13 | 13F | Charles Schwab Investment Management Inc | 866.539 | 30,25 | 7.989 | 49,94 | ||||
| 2026-04-16 | 13F | SG Americas Securities, LLC | 26.429 | 35,42 | 0 | |||||
| 2026-02-13 | 13F | Wells Fargo & Company/mn | 59.034 | 42,50 | 544 | 64,35 | ||||
| 2025-11-06 | 13F | ProShare Advisors LLC | 0 | -100,00 | 0 | |||||
| 2025-11-14 | 13F | Iron Triangle Partners LP | 0 | -100,00 | 0 | -100,00 | ||||
| 2026-02-17 | 13F | Royal Bank Of Canada | 15.781 | -12,23 | 145 | 0,69 | ||||
| 2026-02-12 | 13F | Advisors Asset Management, Inc. | 158 | 1,94 | 1 | 0,00 | ||||
| 2026-04-20 | 13F | Trust Co Of Oklahoma | 15.832 | 223 | ||||||
| 2026-02-06 | 13F | Larson Financial Group LLC | 47 | 0 | ||||||
| 2025-11-13 | 13F | Winton Capital Group Ltd | 0 | -100,00 | 0 | |||||
| 2025-11-12 | 13F | Catalyst Funds Management Pty Ltd | 0 | -100,00 | 0 | |||||
| 2026-02-17 | 13F | Creative Planning | 25.076 | 32,44 | 231 | 52,98 | ||||
| 2026-02-17 | 13F | Abel Hall, LLC | 15.524 | 143 | ||||||
| 2026-02-17 | 13F | Tudor Investment Corp Et Al | 61.086 | -73,35 | 563 | -69,32 | ||||
| 2026-02-13 | 13F | State Street Corp | 1.096.556 | -1,29 | 10.110 | 13,63 | ||||
| 2026-01-26 | 13F | Cwm, Llc | 22.344 | -2,49 | 0 | |||||
| 2026-02-12 | 13F | Dimensional Fund Advisors Lp | 1.671.091 | -15,60 | 15.408 | -2,86 | ||||
| 2026-02-06 | 13F | Prescott Group Capital Management, L.l.c. | 208.412 | 0,00 | 1.922 | 15,10 | ||||
| 2026-02-13 | 13F | Squarepoint Ops LLC | 125.776 | -40,37 | 1.160 | -31,38 | ||||
| 2026-02-13 | 13F | Brown Advisory Inc | 29.776 | -21,02 | 275 | -8,97 | ||||
| 2025-11-06 | 13F | Ameritas Advisory Services, LLC | 0 | -100,00 | 0 | |||||
| 2025-11-17 | 13F | Pin Oak Investment Advisors Inc | 0 | -100,00 | 0 | |||||
| 2026-02-04 | 13F | West Tower Group, LLC | 375.142 | 0,00 | 3.459 | 15,11 | ||||
| 2026-02-12 | 13F | Nuveen, LLC | 247.183 | 0,00 | 2.279 | 15,16 | ||||
| 2026-02-17 | 13F | Eversept Partners, LP | 218.510 | 2.015 | ||||||
| 2026-02-17 | 13F | Quantinno Capital Management LP | 26.234 | 20,99 | 242 | 39,31 | ||||
| 2026-02-12 | 13F | Principal Securities, Inc. | 0 | -100,00 | 0 | -100,00 | ||||
| 2026-02-13 | 13F | Public Employees Retirement Association Of Colorado | 5.337 | 0,00 | 0 | |||||
| 2025-11-14 | 13F | Walleye Capital LLC | 0 | -100,00 | 0 | |||||
| 2026-02-12 | 13F | New York State Common Retirement Fund | 10.425 | -81,23 | 96 | -78,38 | ||||
| 2026-02-06 | 13F | Legato Capital Management LLC | 47.324 | 436 | ||||||
| 2026-01-30 | 13F | Jackson Hole Capital Partners, LLC | 103.765 | 0,00 | 957 | 15,04 | ||||
| 2026-04-06 | 13F | Versant Capital Management, Inc | 192 | 6.300,00 | 3 | |||||
| 2026-02-12 | 13F | Steward Partners Investment Advisory, Llc | 107 | -69,16 | 1 | -100,00 | ||||
| 2026-04-23 | 13F | North Star Investment Management Corp. | 55 | 0,00 | 1 | |||||
| 2026-02-13 | 13F | Prudential Financial Inc | 29.607 | -72,33 | 273 | -68,26 | ||||
| 2026-01-23 | 13F | Assetmark, Inc | 11 | 0,00 | 0 | |||||
| 2026-02-11 | 13F | Empowered Funds, LLC | 262.221 | 11,14 | 2.418 | 27,95 | ||||
| 2026-02-17 | 13F | MIRAE ASSET GLOBAL ETFS HOLDINGS Ltd. | 22.972 | -1,17 | 212 | 13,44 | ||||
| 2026-02-12 | 13F | Brown Brothers Harriman & Co | 255 | 2 | ||||||
| 2026-02-11 | 13F | Gwn Securities Inc. | 35.027 | 323 | ||||||
| 2026-02-11 | 13F | Ameritas Investment Partners, Inc. | 4.023 | 37 | ||||||
| 2026-02-17 | 13F | Mirabella Financial Services Llp | 15.759 | 145 | ||||||
| 2025-11-13 | 13F | C M Bidwell & Associates Ltd | 0 | -100,00 | 0 | |||||
| 2026-02-13 | 13F | 8 Knots Management, Llc | 5.084.714 | 20,52 | 46.881 | 38,73 | ||||
| 2026-02-13 | 13F | Mariner, LLC | 13.121 | 2,62 | 121 | 18,63 | ||||
| 2026-04-20 | 13F | Ronald Blue Trust, Inc. | 3 | 0,00 | 0 | |||||
| 2025-11-14 | 13F | Kent Lake PR LLC | 1.079.607 | -10,03 | 8.648 | -25,25 | ||||
| 2026-02-11 | 13F | Deutsche Bank Ag\ | 237.901 | 1,01 | 2.193 | 16,28 | ||||
| 2026-02-17 | 13F | Prelude Capital Management, Llc | 14.355 | -10,59 | 132 | 3,13 | ||||
| 2026-01-29 | 13F | UBS Group AG | 1.960.568 | -37,42 | 18.076 | -27,97 | ||||
| 2026-02-17 | 13F | Aqr Capital Management Llc | 418.293 | -5,87 | 3.857 | 8,35 | ||||
| 2026-02-12 | 13F | CIBC Private Wealth Group, LLC | 5 | 0,00 | 0 | |||||
| 2025-10-30 | 13F | Parkside Financial Bank & Trust | 0 | -100,00 | 0 | |||||
| 2026-04-07 | 13F | Signaturefd, Llc | 1 | 0,00 | 0 | |||||
| 2026-02-10 | 13F | Hillsdale Investment Management Inc. | 820.670 | 7.567 | ||||||
| 2026-02-13 | 13F | Needham Investment Management Llc | 50.000 | 0,00 | 461 | 15,25 | ||||
| 2026-04-06 | 13F | GAMMA Investing LLC | 119 | 41,67 | 2 | |||||
| 2026-03-06 | 13F | Hsbc Holdings Plc | 37.735 | 56,56 | 350 | 80,83 | ||||
| 2026-02-13 | 13F | Ieq Capital, Llc | 54.375 | -3,59 | 501 | 11,09 | ||||
| 2026-02-17 | 13F | Engineers Gate Manager LP | 0 | -100,00 | 0 | |||||
| 2026-04-13 | 13F | True Wealth Design, LLC | 352 | 0,00 | 5 | 33,33 | ||||
| 2026-04-24 | 13F | Strs Ohio | 41.700 | 172,55 | 588 | 316,31 | ||||
| 2026-04-20 | 13F | State of Alaska, Department of Revenue | 3.384 | 0,00 | 0 | |||||
| 2025-11-13 | 13F | Magnetar Financial LLC | 0 | -100,00 | 0 | |||||
| 2026-02-17 | 13F | Northern Trust Corp | 406.808 | -6,36 | 3.751 | 7,79 | ||||
| 2026-02-17 | 13F | State Of Wisconsin Investment Board | 0 | -100,00 | 0 | |||||
| 2026-02-13 | 13F | Y-Intercept (Hong Kong) Ltd | 0 | -100,00 | 0 | |||||
| 2025-11-14 | 13F | Balyasny Asset Management Llc | 0 | -100,00 | 0 | |||||
| 2026-02-06 | 13F | EverSource Wealth Advisors, LLC | 1.169 | -4,65 | 11 | 11,11 | ||||
| 2026-01-26 | 13F | Whittier Trust Co | 202 | 0,00 | 2 | 0,00 | ||||
| 2026-02-03 | 13F | Ballentine Partners, LLC | 16.842 | -1,16 | 155 | 13,97 | ||||
| 2026-02-13 | 13F | Ubs Asset Management Americas Inc | 721 | 7 | ||||||
| 2026-04-24 | 13F | Root Financial Partners, LLC | 24 | 0 | ||||||
| 2026-02-13 | 13F | Rhumbline Advisers | 65.306 | -11,35 | 602 | 2,03 | ||||
| 2026-02-09 | 13F | Systematic Financial Management Lp | 1.902.539 | -1,83 | 17.541 | 13,00 | ||||
| 2026-02-11 | 13F | Simplex Trading, Llc | 8.115 | 69,81 | 75 | |||||
| 2026-02-17 | 13F | Millennium Management Llc | 0 | -100,00 | 0 | |||||
| 2026-02-10 | 13F | Bnp Paribas Arbitrage, Sa | 79.111 | 7,32 | 729 | 23,56 | ||||
| 2026-01-21 | 13F | Newbridge Financial Services Group, Inc. | 100 | 0,00 | 1 | |||||
| 2026-02-17 | 13F | Lazard Asset Management Llc | 355.570 | 19,35 | 3.278 | 37,38 | ||||
| 2025-11-14 | 13F | Oxford Asset Management Llp | 0 | -100,00 | 0 | -100,00 | ||||
| 2026-02-10 | 13F | State of Wyoming | 65.402 | -12,92 | 603 | 0,33 | ||||
| 2026-02-10 | 13F | Goldman Sachs Group Inc | 1.036.051 | -18,85 | 9.552 | -6,59 | ||||
| 2026-01-28 | 13F | Paradice Investment Management LLC | 1.643.889 | -5,36 | 15.157 | 8,93 | ||||
| 2026-02-13 | 13F | Segall Bryant & Hamill, Llc | 240.415 | 0,00 | 2.217 | 15,12 | ||||
| 2026-02-12 | 13F | Brinker Capital Investments, LLC | 143.251 | -0,53 | 1.321 | 14,48 | ||||
| 2026-02-17 | 13F | Jones Financial Companies Lllp | 115 | 0,00 | 1 | |||||
| 2026-02-13 | 13F | Morgan Stanley | 707.965 | -5,93 | 6.527 | 8,28 | ||||
| 2026-02-12 | 13F | State Board Of Administration Of Florida Retirement System | 14.377 | 0,00 | 133 | 14,78 | ||||
| 2026-04-07 | 13F | Farther Finance Advisors, LLC | 1.062 | -26,25 | 15 | 7,69 | ||||
| 2026-02-17 | 13F | Brevan Howard Capital Management LP | 14.707 | 136 | ||||||
| 2026-02-05 | 13F | Bessemer Group Inc | 1.500 | 0,00 | 0 | |||||
| 2026-02-13 | 13F | MAI Capital Management | 3 | 0 | ||||||
| 2026-02-17 | 13F | Two Sigma Investments, Lp | 140.216 | 1.293 | ||||||
| 2026-02-03 | 13F | SBI Securities Co., Ltd. | 0 | -100,00 | 0 | |||||
| 2026-02-09 | 13F | Legal & General Group Plc | 9.309 | 0,00 | 86 | 14,86 | ||||
| 2026-01-30 | 13F | Citizens National Bank Trust Department | 82 | -18,00 | 1 | |||||
| 2026-02-17 | 13F | Zacks Investment Management | 10.810 | 0,01 | 100 | 15,12 | ||||
| 2026-02-17 | 13F | Polymer Capital Management (US) LLC | 18.313 | 169 | ||||||
| 2026-02-13 | 13F | Hurley Capital, LLC | 50 | 0 | ||||||
| 2026-02-06 | 13F | Gsa Capital Partners Llp | 81.943 | -49,43 | 1 | -100,00 | ||||
| 2025-11-13 | 13F | Parallel Advisors, LLC | 0 | -100,00 | 0 | |||||
| 2026-02-17 | 13F | AREX Capital Management, LP | 2.493.872 | 0,19 | 22.994 | 15,33 | ||||
| 2026-02-19 | 13F | Birchwood Financial Partners, Inc. | 20 | 0 | ||||||
| 2026-03-11 | 13F | Leonteq Securities AG | 0 | -100,00 | 0 | |||||
| 2025-11-14 | 13F | Point72 Asset Management, L.P. | 0 | -100,00 | 0 | |||||
| 2026-02-19 | 13F | Invesco Ltd. | 129.900 | -28,28 | 1.198 | -17,45 | ||||
| 2026-02-12 | 13F | MetLife Investment Management, LLC | 28.778 | -1,76 | 265 | 13,25 | ||||
| 2026-02-17 | 13F | Aquatic Capital Management LLC | 0 | -100,00 | 0 | |||||
| 2026-02-20 | 13F | Sunbelt Securities, Inc. | 11 | 450,00 | 0 | |||||
| 2025-11-14 | 13F | Point72 (DIFC) Ltd | 0 | -100,00 | 0 | |||||
| 2026-02-17 | 13F | Fmr Llc | 45.422 | 50,21 | 419 | 72,73 | ||||
| 2026-04-21 | 13F | Alpine Associates Management Inc. | 450.000 | 6.340 | ||||||
| 2026-02-17 | 13F | Deerfield Management Company, L.p. (series C) | 4.747.746 | 0,00 | 43.774 | 15,11 | ||||
| 2026-02-03 | 13F | Strengthening Families & Communities, LLC | 256 | 0,00 | 2 | 0,00 | ||||
| 2026-02-11 | 13F | Franklin Resources Inc | 35.095 | 0,44 | 324 | 15,77 | ||||
| 2026-02-17 | 13F | Ameriprise Financial Inc | 863.850 | 1,01 | 7.965 | 16,26 | ||||
| 2026-02-13 | 13F/A | Texas Permanent School Fund | 0 | -100,00 | 0 | |||||
| 2026-02-02 | 13F | New England Capital Financial Advisors LLC | 53 | 0,00 | 0 | |||||
| 2026-02-17 | 13F | Mercer Global Advisors Inc /adv | 11.568 | -2,36 | 107 | 12,77 | ||||
| 2025-11-14 | 13F | Petrus Trust Company, LTA | 0 | -100,00 | 0 | |||||
| 2026-01-29 | 13F | Quest 10 Wealth Builders, Inc. | 25 | 0,00 | 0 | |||||
| 2026-02-20 | 13F/A | Prestige Wealth Management Group LLC | 0 | -100,00 | 0 | |||||
| 2026-02-10 | 13F | Acadian Asset Management Llc | 291.075 | 105,97 | 3 | 100,00 | ||||
| 2026-02-10 | 13F | Savant Capital, LLC | 0 | -100,00 | 0 | |||||
| 2026-02-17 | 13F | Algert Global Llc | 0 | -100,00 | 0 | |||||
| 2026-02-13 | 13F | Caitong International Asset Management Co., Ltd | 0 | -100,00 | 0 | |||||
| 2026-02-17 | 13F | D. E. Shaw & Co., Inc. | 941.297 | -0,32 | 8.679 | 14,73 | ||||
| 2026-02-17 | 13F | Advisory Services Network, LLC | 15.962 | 0,63 | 147 | 15,75 | ||||
| 2026-02-17 | 13F | Canada Pension Plan Investment Board | 14.500 | 134 | ||||||
| 2026-02-10 | 13F | Globeflex Capital L P | 14.629 | -86,68 | 135 | -84,76 | ||||
| 2026-02-10 | 13F | Connor, Clark & Lunn Investment Management Ltd. | 119.329 | -39,53 | 1.100 | -30,38 | ||||
| 2026-02-11 | 13F | Cerity Partners LLC | 23.425 | -0,44 | 216 | 14,36 | ||||
| 2026-01-16 | 13F | Trust Co Of Vermont | 13 | 0,00 | 0 | |||||
| 2026-01-22 | 13F | Massachusetts Financial Services Co /ma/ | 86.498 | -3,20 | 798 | 11,47 | ||||
| 2026-02-06 | 13F | Global Retirement Partners, LLC | 9 | 0 | ||||||
| 2026-02-13 | 13F | SRS Capital Advisors, Inc. | 6.103 | -69,32 | 56 | -64,78 | ||||
| 2026-02-17 | 13F | JANA Partners Management, LP | 2.090.412 | -2,19 | 19.274 | 12,59 | ||||
| 2026-02-13 | 13F | Dynamic Technology Lab Private Ltd | 0 | -100,00 | 0 | |||||
| 2026-01-20 | 13F | Harbor Capital Advisors, Inc. | 274 | -1,79 | 0 | |||||
| 2026-04-22 | 13F | Sterling Capital Management LLC | 1.652 | -95,83 | 23 | -93,70 | ||||
| 2026-02-05 | 13F | Amalgamated Bank | 1.557 | -9,79 | 0 | |||||
| 2026-02-09 | 13F | Quest Partners LLC | 62.793 | 17,65 | 579 | 35,36 | ||||
| 2026-01-30 | 13F | Us Bancorp \de\ | 0 | -100,00 | 0 | |||||
| 2026-02-17 | 13F | Graham Capital Management, L.P. | 0 | -100,00 | 0 | |||||
| 2026-02-17 | 13F | Optiver Holding B.V. | 374 | 0,00 | 3 | 50,00 | ||||
| 2026-02-11 | 13F | Fox Run Management, L.l.c. | 46.059 | 63,64 | 425 | 88,44 | ||||
| 2026-02-17 | 13F | California State Teachers Retirement System | 3.053 | -15,45 | 28 | 0,00 | ||||
| 2026-02-05 | 13F | Allworth Financial LP | 380 | -71,49 | 4 | -70,00 | ||||
| 2026-02-17 | 13F | Public Employees Retirement System Of Ohio | 2.883 | -15,38 | 27 | -3,70 | ||||
| 2026-02-06 | 13F | Pnc Financial Services Group, Inc. | 12.381 | 0,11 | 114 | 15,15 | ||||
| 2026-02-12 | 13F | BlackRock, Inc. | 4.002.787 | 0,70 | 36.906 | 15,91 | ||||
| 2025-11-14 | 13F | ExodusPoint Capital Management, LP | 0 | -100,00 | 0 | |||||
| 2026-02-17 | 13F | Persistent Asset Partners Ltd | 227.806 | 22,74 | 2.100 | 41,32 | ||||
| 2026-02-11 | 13F | Los Angeles Capital Management Llc | 201.963 | -12,95 | 1.652 | -11,09 | ||||
| 2026-02-17 | 13F | Bank Of America Corp /de/ | 514.106 | -25,27 | 4.740 | -13,97 | ||||
| 2025-11-14 | 13F | Quarry LP | 0 | -100,00 | 0 | |||||
| 2026-02-17 | 13F | Bridgeway Capital Management Inc | 406.686 | -4,56 | 3.750 | 9,84 | ||||
| 2026-02-13 | 13F | Marshall Wace, Llp | 487.408 | 4.494 | ||||||
| 2026-02-17 | 13F | Tower Research Capital LLC (TRC) | 2.556 | -1,99 | 24 | 15,00 | ||||
| 2026-01-29 | 13F | Vanguard Group Inc | 3.371.072 | -0,65 | 31.081 | 14,36 | ||||
| 2026-02-09 | 13F | Hantz Financial Services, Inc. | 0 | -100,00 | 0 | |||||
| 2026-02-09 | 13F | Hartland & Co., LLC | 8 | -95,15 | 0 | -100,00 | ||||
| 2026-02-19 | 13F | CI Private Wealth, LLC | 14.942 | 48,91 | 138 | 71,25 | ||||
| 2026-02-10 | 13F | Intech Investment Management Llc | 21.872 | 3,99 | 202 | 19,64 | ||||
| 2026-02-17 | 13F/A | RBF Capital, LLC | 18.291 | 0,00 | 169 | 15,07 | ||||
| 2026-02-12 | 13F | Jane Street Group, Llc | 0 | -100,00 | 0 | |||||
| 2026-02-13 | 13F | Arrowstreet Capital, Limited Partnership | 291.414 | -48,50 | 2.687 | -40,73 | ||||
| 2026-02-17 | 13F | Trexquant Investment LP | 75.518 | 696 | ||||||
| 2026-04-08 | 13F | Wealth Enhancement Advisory Services, Llc | 17.148 | 17,39 | 240 | 75,18 | ||||
| 2026-02-10 | 13F | Rothschild Investment Llc | 26 | 30,00 | 0 | |||||
| 2026-04-24 | 13F | Oakworth Capital, Inc. | 82 | 1 | ||||||
| 2026-02-04 | 13F | Bailard, Inc. | 55.200 | 0,00 | 509 | 14,93 | ||||
| 2025-11-13 | 13F | O'shaughnessy Asset Management, Llc | 0 | -100,00 | 0 | |||||
| 2026-02-13 | 13F | Police & Firemen's Retirement System of New Jersey | 14.994 | 0,00 | 138 | 15,00 | ||||
| 2026-02-06 | 13F | Covestor Ltd | 1.049 | -1,22 | 0 | |||||
| 2026-01-29 | 13F | Comerica Bank | 315 | 0,00 | 3 | 0,00 | ||||
| 2025-11-14 | 13F | Skopos Labs, Inc. | 0 | -100,00 | 0 | |||||
| 2026-02-13 | 13F | Citigroup Inc | 1.707 | 3,14 | 16 | 15,38 |
Other Listings
| US:EHAB | 13,74 $ |