Grundlæggende statistik
| Institutionelle ejere | 75 total, 72 long only, 0 short only, 3 long/short - change of 19,05% MRQ |
| Del pris | 30,20 |
| Gennemsnitlig porteføljeallokering | 0.4049 % - change of 6,46% MRQ |
| Institutionelle aktier (lange) | 9.863.999 (ex 13D/G) - change of -2,32MM shares -19,03% MRQ |
| Institutionel værdi (lang) | $ 292.301 USD ($1000) |
Institutionelt ejerskab og aktionærer
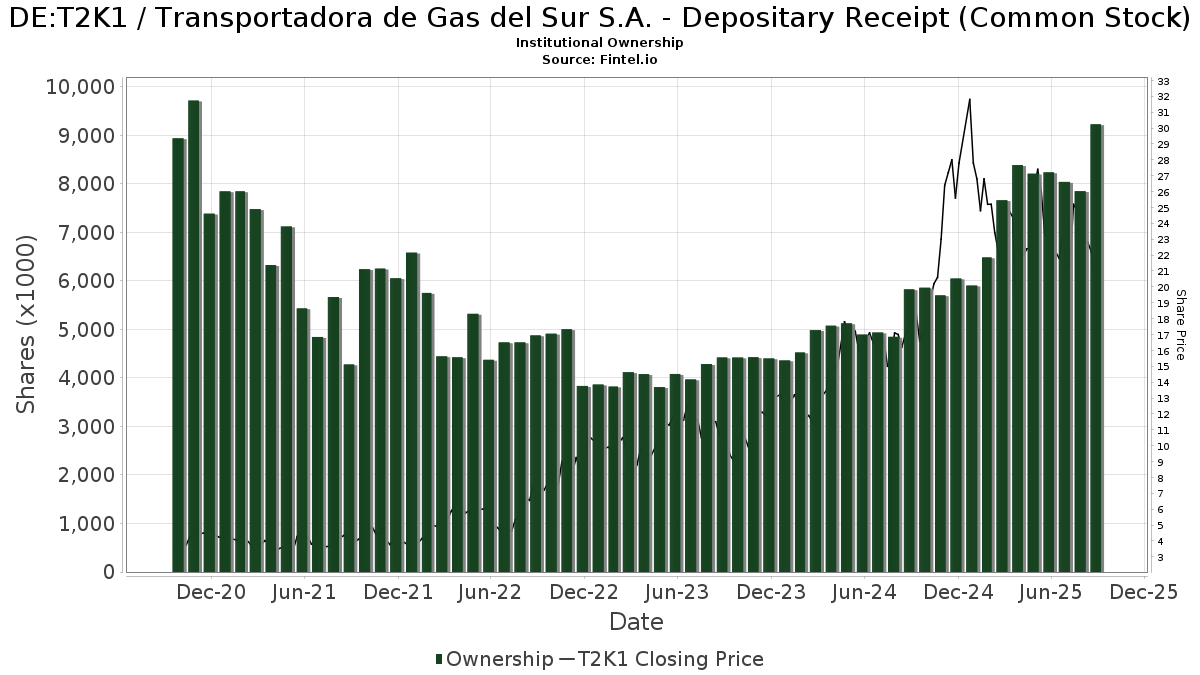
Transportadora de Gas del Sur S.A. - Depositary Receipt (Common Stock) (DE:T2K1) har 75 institutionelle ejere og aktionærer, der har indsendt 13D/G- eller 13F-formularer til Securities Exchange Commission (SEC). Disse institutioner har i alt 9,863,999 aktier. Største aktionærer omfatter Helikon Investments Ltd, SPX Equities Gestao de Recursos Ltda, MIRAE ASSET GLOBAL ETFS HOLDINGS Ltd., Fundamenta Capital S.A., Morgan Stanley, TT International Asset Management LTD, Voloridge Investment Management, Llc, VR Advisory Services Ltd, Fourth Sail Capital LP, and Citadel Advisors Llc .
Transportadora de Gas del Sur S.A. - Depositary Receipt (Common Stock) (BST:T2K1) institutionel ejerskabsstruktur viser aktuelle positioner i virksomheden efter institutioner og fonde, samt seneste ændringer i positionsstørrelse. Større aktionærer kan omfatte individuelle investorer, investeringsforeninger, hedgefonde eller institutioner. Skema 13D angiver, at investoren besidder (eller besidder) mere end 5 % af virksomheden og har til hensigt (eller har til hensigt at) aktivt at forfølge en ændring i forretningsstrategi. Skema 13G indikerer en passiv investering på over 5%.
The share price as of March 30, 2026 is 30,20 / share. Previously, on April 1, 2025, the share price was 23,00 / share. This represents an increase of 31,30% over that period.
Fondens stemningsscore
Fund Sentiment Score (fka Ownership Accumulation Score) finder de aktier, der bliver mest købt af fonde. Det er resultatet af en sofistikeret, multi-faktor kvantitativ model, der identificerer virksomheder med de højeste niveauer af institutionel akkumulering. Scoringsmodellen bruger en kombination af den samlede stigning i oplyste ejere, ændringerne i porteføljeallokeringer i disse ejere og andre målinger. Tallet går fra 0 til 100, hvor højere tal indikerer et højere niveau af akkumulering for sine jævnaldrende, og 50 er gennemsnittet.
Opdateringsfrekvens: Dagligt
Se Ownership Explorer, som giver en liste over højest rangerende virksomheder.
AI+ Ask Fintel’s AI assistant about Transportadora de Gas del Sur S.A. - Depositary Receipt (Common Stock).
Select a question to share a public post with an AI-crafted answer.
Thinking of good questions…
13F og NPORT arkivering
Detaljer om 13F-arkivering er gratis. Detaljer om NP-ansøgninger kræver et premium-medlemskab. Grønne rækker angiver nye positioner. Røde rækker angiver lukkede positioner. Klik på linket ikon for at se den fulde transaktionshistorik.
Opgrader
for at låse premium-data op og eksportere til Excel ![]() .
.
| Fil dato | Kilde | Investor | Type | Gennemsnitlig pris (Øst) |
Aktier | Δ Aktier (%) |
Rapporteret Værdi ($1000) |
Δ Værdi (%) |
Port Alloc (%) |
|
|---|---|---|---|---|---|---|---|---|---|---|
| 2026-02-03 | 13F | SBI Securities Co., Ltd. | 33 | -85,84 | 1 | -75,00 | ||||
| 2026-02-12 | 13F | Banco BTG Pactual S.A. | 106.060 | -47,24 | 3.297 | -22,00 | ||||
| 2025-11-14 | 13F | Verition Fund Management LLC | 0 | -100,00 | 0 | |||||
| 2026-02-17 | 13F | Citadel Advisors Llc | Put | 181.800 | 9,32 | 5.652 | 61,62 | |||
| 2026-02-17 | 13F | Citadel Advisors Llc | Call | 9.000 | -18,18 | 280 | 20,78 | |||
| 2026-01-21 | 13F | Steadtrust LLC | 24.700 | 0,00 | 768 | 47,78 | ||||
| 2026-02-17 | 13F | Citadel Advisors Llc | 110.396 | 87,42 | 3.432 | 177,22 | ||||
| 2025-10-23 | 13F | SG Americas Securities, LLC | 0 | -100,00 | 0 | |||||
| 2026-02-18 | 13F | Vident Advisory, LLC | 7.515 | 234 | ||||||
| 2026-02-18 | 13F | Mackenzie Financial Corp | 126.400 | -0,78 | 3.901 | 45,58 | ||||
| 2025-11-17 | 13F | GWM Advisors LLC | 0 | -100,00 | 0 | |||||
| 2026-02-13 | 13F | Rhumbline Advisers | 2 | 0,00 | 0 | |||||
| 2026-02-13 | 13F | Itau Unibanco Holding S.A. | 49.035 | 1.516 | ||||||
| 2025-11-14 | 13F | National Bank Of Canada /fi/ | 0 | -100,00 | 0 | |||||
| 2026-02-05 | 13F | Bessemer Group Inc | 4 | 0,00 | 0 | |||||
| 2026-02-02 | 13F | Ping Capital Management, Inc. | 102.700 | 0,00 | 3.193 | 47,85 | ||||
| 2026-02-10 | 13F | Goldman Sachs Group Inc | 180.256 | 174,50 | 5.604 | 306,09 | ||||
| 2025-10-27 | 13F | Janney Montgomery Scott LLC | 0 | -100,00 | 0 | |||||
| 2026-01-12 | 13F | Systrade AG | 25.000 | 777 | ||||||
| 2026-02-10 | 13F/A | Northwestern Mutual Wealth Management Co | 3.967 | 0,00 | 123 | 48,19 | ||||
| 2026-02-17 | 13F | Aquatic Capital Management LLC | 2.727 | 85 | ||||||
| 2026-02-17 | 13F | VR Advisory Services Ltd | 195.115 | 0,00 | 6.066 | 47,84 | ||||
| 2026-02-13 | 13F | Fourth Sail Capital LP | 191.630 | -68,84 | 5.958 | -53,93 | ||||
| 2026-02-05 | 13F | Helikon Investments Ltd | 3.283.265 | 13,32 | 102.077 | 67,53 | ||||
| 2025-10-31 | 13F | Y-Intercept (Hong Kong) Ltd | 0 | -100,00 | 0 | -100,00 | ||||
| 2026-01-28 | 13F | Old National Bancorp /in/ | 8.900 | 277 | ||||||
| 2026-01-29 | 13F | IMC-Chicago, LLC | Call | 12.700 | 395 | |||||
| 2026-02-17 | 13F | Advisor Group Holdings, Inc. | 409 | -0,49 | 13 | 50,00 | ||||
| 2026-01-29 | 13F | Pictet Asset Management Holding SA | 49.346 | 0,00 | 1.534 | 47,93 | ||||
| 2026-01-14 | 13F | ORG Partners LLC | 70 | 0,00 | 2 | 100,00 | ||||
| 2026-02-17 | 13F | Jump Financial, LLC | 19.287 | 600 | ||||||
| 2025-11-14 | 13F | Cubist Systematic Strategies, LLC | 9.936 | -90,17 | 209 | -92,06 | ||||
| 2026-02-17 | 13F | State Of Wisconsin Investment Board | 32.337 | 1.005 | ||||||
| 2026-01-09 | 13F | Crocodile Capital Partners GmbH | 25.000 | 777 | ||||||
| 2026-02-17 | 13F | Two Sigma Advisers, Lp | 0 | -100,00 | 0 | |||||
| 2026-01-16 | 13F | Ronald Blue Trust, Inc. | 29 | 52,63 | 1 | |||||
| 2026-02-13 | 13F | Caitong International Asset Management Co., Ltd | 0 | -100,00 | 0 | |||||
| 2026-02-12 | 13F | Jane Street Group, Llc | 6.718 | -93,36 | 209 | -90,22 | ||||
| 2026-02-13 | 13F | Van Eck Associates Corp | 4.348 | 536,60 | 0 | |||||
| 2026-02-12 | 13F | Jane Street Group, Llc | Call | 10.700 | 333 | |||||
| 2025-11-04 | 13F | IMC-Chicago, LLC | Put | 0 | -100,00 | 0 | -100,00 | |||
| 2026-02-17 | 13F | Mirabella Financial Services Llp | 23.120 | 719 | ||||||
| 2026-02-17 | 13F | Russell Investments Group, Ltd. | 11.479 | 357 | ||||||
| 2026-02-17 | 13F | Susquehanna International Group, Llp | Call | 73.400 | -11,25 | 2.282 | 31,22 | |||
| 2026-02-17 | 13F | Susquehanna International Group, Llp | Put | 85.100 | -22,07 | 2.646 | 15,20 | |||
| 2026-02-17 | 13F | Engineers Gate Manager LP | 8.358 | -77,39 | 260 | -66,67 | ||||
| 2026-02-12 | 13F | Hm Payson & Co | 3.262 | 0,00 | 101 | 48,53 | ||||
| 2026-02-13 | 13F | Kempen Capital Management N.v. | 101.016 | -10,37 | 3.141 | 32,49 | ||||
| 2026-02-12 | 13F | Campbell & CO Investment Adviser LLC | 0 | -100,00 | 0 | |||||
| 2025-11-14 | 13F | Credit Agricole S A | 0 | -100,00 | 0 | |||||
| 2026-02-19 | 13F | Invesco Ltd. | 8.206 | 255 | ||||||
| 2026-01-21 | 13F | Ameliora Wealth Management Ltd. | 714 | 0,00 | 22 | 46,67 | ||||
| 2025-11-14 | 13F | Turim 21 Investimentos Ltda. | 0 | -100,00 | 0 | |||||
| 2026-02-10 | 13F | Envestnet Asset Management Inc | 6.732 | 209 | ||||||
| 2026-01-27 | 13F | Fundamenta Capital S.A. | 597.147 | 18.565 | ||||||
| 2026-02-17 | 13F | Encompass Capital Advisors LLC | 0 | -100,00 | 0 | |||||
| 2025-11-21 | 13F/A | Royal Bank Of Canada | 0 | -100,00 | 0 | -100,00 | ||||
| 2026-02-13 | 13F | Wexford Capital Lp | 89.805 | 2.792 | ||||||
| 2026-03-06 | 13F | Hsbc Holdings Plc | 11.633 | -58,84 | 358 | -40,50 | ||||
| 2026-02-10 | 13F | Bnp Paribas Arbitrage, Sa | 75.597 | 801,04 | 2.350 | 1.235,23 | ||||
| 2026-02-11 | 13F | Simplex Trading, Llc | Put | 28.700 | 24,78 | 892 | ||||
| 2026-02-13 | 13F | SPX Equities Gestao de Recursos Ltda | 1.206.803 | 108,66 | 37.520 | 208,47 | ||||
| 2026-02-11 | 13F | Simplex Trading, Llc | 3.955 | 564,71 | 123 | |||||
| 2025-11-14 | 13F | Centiva Capital, LP | 0 | -100,00 | 0 | -100,00 | ||||
| 2026-02-17 | 13F | Voloridge Investment Management, Llc | 271.174 | -9,68 | 8.431 | 33,51 | ||||
| 2026-02-17 | 13F | MIRAE ASSET GLOBAL ETFS HOLDINGS Ltd. | 1.103.816 | -8,38 | 34.318 | 35,45 | ||||
| 2026-02-06 | 13F | EverSource Wealth Advisors, LLC | 86 | 0,00 | 3 | 100,00 | ||||
| 2026-02-11 | 13F | Jpmorgan Chase & Co | 9.258 | -85,44 | 288 | -78,52 | ||||
| 2026-01-05 | 13F | GAMMA Investing LLC | 2.219 | -24,73 | 69 | 11,48 | ||||
| 2026-01-23 | 13F | TT International Asset Management LTD | 387.255 | -58,48 | 12 | -99,94 | ||||
| 2026-02-13 | 13F | Morgan Stanley | 487.494 | 18,56 | 15.156 | 75,27 | ||||
| 2026-01-29 | 13F | UBS Group AG | 80.969 | -40,30 | 2.517 | -11,75 | ||||
| 2026-02-13 | 13F | Citigroup Inc | 82.178 | 2.555 | ||||||
| 2025-11-14 | 13F | Point72 Asset Management, L.P. | 0 | -100,00 | 0 | |||||
| 2026-02-17 | 13F | Susquehanna International Group, Llp | 0 | -100,00 | 0 | |||||
| 2026-01-30 | 13F | Glenorchy Capital Ltd | 38.275 | -10,41 | 1.190 | 32,41 | ||||
| 2026-01-28 | 13F | Aquamarine Financial (Cayman) Ltd | 29.696 | 0,00 | 923 | 47,92 | ||||
| 2026-02-13 | 13F | Barclays Plc | 60 | 2 | ||||||
| 2026-02-12 | 13F | Ci Investments Inc. | 163.504 | 5.083 | ||||||
| 2025-11-05 | 13F | Anthracite Investment Company, Inc. | 0 | -100,00 | 0 | -100,00 | ||||
| 2025-11-14 | 13F | Qube Research & Technologies Ltd | 0 | -100,00 | 0 | -100,00 | ||||
| 2026-02-11 | 13F | Group One Trading, L.p. | Call | 10.700 | 333 | |||||
| 2026-02-17 | 13F | Oaktree Capital Management Lp | 0 | -100,00 | 0 | |||||
| 2025-11-14 | 13F | Jane Street Group, Llc | Put | 0 | -100,00 | 0 | -100,00 | |||
| 2026-02-02 | 13F | Fifth Third Bancorp | 767 | 24 | ||||||
| 2026-02-12 | 13F | Insigneo Advisory Services, Llc | 0 | -100,00 | 0 | |||||
| 2026-02-17 | 13F | Blackstone Group Inc | 24.946 | 776 | ||||||
| 2026-02-17 | 13F | Bank Of America Corp /de/ | 17.692 | -40,87 | 550 | -12,56 | ||||
| 2026-02-17 | 13F/A | Uniplan Investment Counsel, Inc. | 28.023 | 871 | ||||||
| 2026-02-17 | 13F | Millennium Management Llc | 11.233 | -70,56 | 349 | -56,48 | ||||
| 2026-02-17 | 13F | Tower Research Capital LLC (TRC) | 0 | -100,00 | 0 | |||||
| 2026-02-05 | 13F | Td Private Client Wealth Llc | 17 | 1 | ||||||
| 2026-02-17 | 13F | Balyasny Asset Management Llc | 104.369 | -56,98 | 3.245 | -36,42 | ||||
| 2026-02-17 | 13F | Moneda S.A. Administradora General de Fondos | 134.568 | -17,21 | 4.184 | -17,33 | ||||
| 2025-11-13 | 13F | Marshall Wace, Llp | 0 | -100,00 | 0 | |||||
| 2026-02-05 | 13F/A | Truxt Investmentos Ltda. | 0 | -100,00 | 0 | -100,00 | ||||
| 2026-02-13 | 13F | Smartleaf Asset Management LLC | 3 | 0 | ||||||
| 2026-02-17 | 13F | Schonfeld Strategic Advisors LLC | 10.082 | 313 | ||||||
| 2026-02-17 | 13F | XTX Topco Ltd | 23.418 | 728 | ||||||
| 2026-02-13 | 13F | Wells Fargo & Company/mn | 834 | -45,60 | 26 | -21,87 | ||||
| 2025-11-04 | 13F | Allianz Asset Management GmbH | 0 | -100,00 | 0 | -100,00 | ||||
| 2026-01-30 | 13F | ABS Direct Equity Fund LLC | 52.093 | 1.620 | ||||||
| 2026-02-17 | 13F | Graham Capital Management, L.P. | 11.190 | -28,53 | 348 | 5,47 | ||||
| 2025-10-27 | 13F | North of South Capital LLP | 0 | -100,00 | 0 | |||||
| 2026-01-23 | 13F | Lester Murray Antman dba SimplyRich | 65.396 | 1,40 | 2 | 100,00 | ||||
| 2026-02-11 | 13F | Simplex Trading, Llc | Call | 0 | -100,00 | 0 | ||||
| 2026-02-13 | 13F | Arrowstreet Capital, Limited Partnership | 0 | -100,00 | 0 | |||||
| 2026-01-23 | 13F | Farther Finance Advisors, LLC | 72 | 0,00 | 2 | 100,00 | ||||
| 2026-01-23 | 13F | Yorktown Management & Research Co Inc | 10.300 | 0,00 | 320 | 48,15 |
Other Listings
| US:TGS | 34,61 $ |