Grundlæggende statistik
| Institutionelle aktier (lange) | 18.264.944 - 9,37% (ex 13D/G) - change of -0,39MM shares -2,07% MRQ |
| Institutionel værdi (lang) | $ 5.266 USD ($1000) |
Institutionelt ejerskab og aktionærer
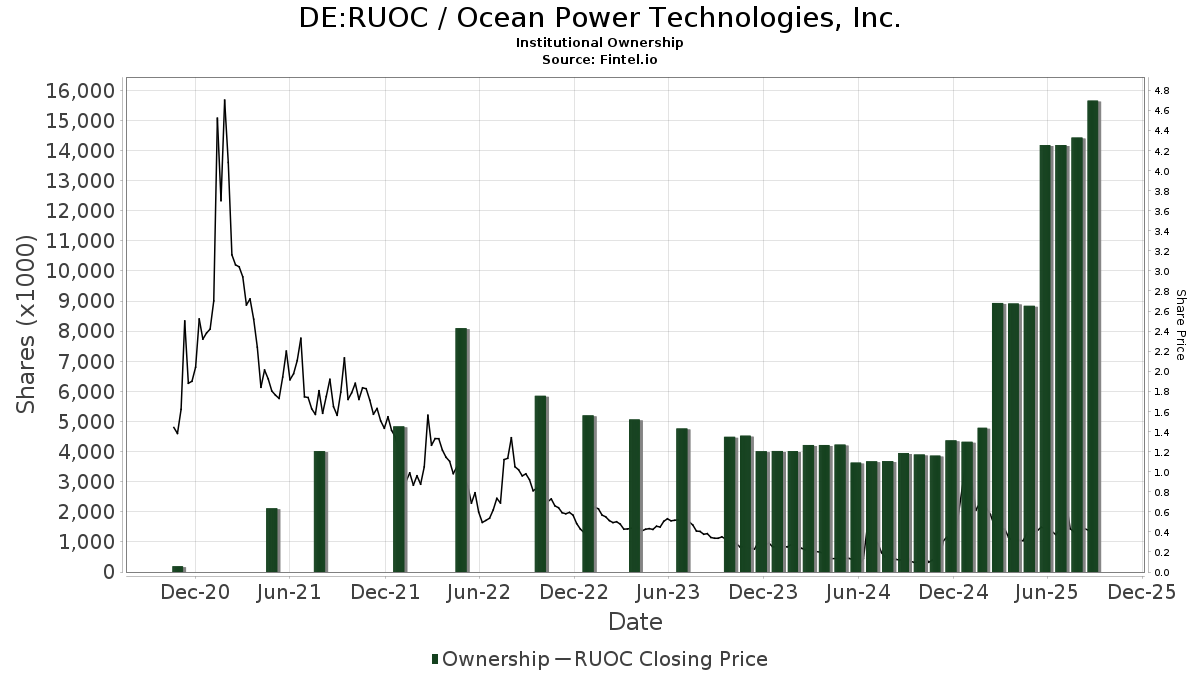
Ocean Power Technologies, Inc. (DE:RUOC) har 61 institutionelle ejere og aktionærer, der har indsendt 13D/G- eller 13F-formularer til Securities Exchange Commission (SEC). Disse institutioner har i alt 18,264,944 aktier. Største aktionærer omfatter Vanguard Group Inc, BlackRock, Inc., Geode Capital Management, Llc, UBS Group AG, State Street Corp, Jane Street Group, Llc, Susquehanna International Group, Llp, Cambridge Investment Research Advisors, Inc., Group One Trading, L.p., and Northern Trust Corp .
Ocean Power Technologies, Inc. (DB:RUOC) institutionel ejerskabsstruktur viser aktuelle positioner i virksomheden efter institutioner og fonde, samt seneste ændringer i positionsstørrelse. Større aktionærer kan omfatte individuelle investorer, investeringsforeninger, hedgefonde eller institutioner. Skema 13D angiver, at investoren besidder (eller besidder) mere end 5 % af virksomheden og har til hensigt (eller har til hensigt at) aktivt at forfølge en ændring i forretningsstrategi. Skema 13G indikerer en passiv investering på over 5%.
The share price as of February 23, 2026 is 0,32 / share. Previously, on March 3, 2025, the share price was 0,47 / share. This represents a decline of 32,02% over that period.
Fondens stemningsscore
Fund Sentiment Score (fka Ownership Accumulation Score) finder de aktier, der bliver mest købt af fonde. Det er resultatet af en sofistikeret, multi-faktor kvantitativ model, der identificerer virksomheder med de højeste niveauer af institutionel akkumulering. Scoringsmodellen bruger en kombination af den samlede stigning i oplyste ejere, ændringerne i porteføljeallokeringer i disse ejere og andre målinger. Tallet går fra 0 til 100, hvor højere tal indikerer et højere niveau af akkumulering for sine jævnaldrende, og 50 er gennemsnittet.
Opdateringsfrekvens: Dagligt
Se Ownership Explorer, som giver en liste over højest rangerende virksomheder.
AI+ Ask Fintel’s AI assistant about Ocean Power Technologies, Inc..
Select a question to share a public post with an AI-crafted answer.
Thinking of good questions…
13F og NPORT arkivering
Detaljer om 13F-arkivering er gratis. Detaljer om NP-ansøgninger kræver et premium-medlemskab. Grønne rækker angiver nye positioner. Røde rækker angiver lukkede positioner. Klik på linket ikon for at se den fulde transaktionshistorik.
Opgrader
for at låse premium-data op og eksportere til Excel ![]() .
.
| Fil dato | Kilde | Investor | Type | Gennemsnitlig pris (Øst) |
Aktier | Δ Aktier (%) |
Rapporteret Værdi ($1000) |
Δ Værdi (%) |
Port Alloc (%) |
|
|---|---|---|---|---|---|---|---|---|---|---|
| 2026-02-13 | 13F | Squarepoint Ops LLC | 0 | -100,00 | 0 | |||||
| 2026-02-13 | 13F | Charles Schwab Investment Management Inc | 50.000 | 0,00 | 15 | -40,00 | ||||
| 2026-02-06 | 13F | IFP Advisors, Inc | 10.000 | 0,00 | 3 | -40,00 | ||||
| 2026-01-13 | 13F | CoreCap Advisors, LLC | 250 | 0,00 | 0 | |||||
| 2026-02-17 | 13F | Advisor Group Holdings, Inc. | 70.150 | 128,69 | 21 | 40,00 | ||||
| 2026-01-29 | 13F | UBS Group AG | 1.700.538 | 1.085,56 | 510 | 608,33 | ||||
| 2026-02-23 | 13F | Virtu Financial LLC | 245.368 | 68,26 | 0 | |||||
| 2026-02-17 | 13F | Citadel Advisors Llc | Put | 56.400 | -67,04 | 17 | -81,40 | |||
| 2026-02-05 | 13F | Baader Bank INC | 34.185 | 6 | ||||||
| 2026-02-19 | 13F | Connective Capital Management, LLC | 0 | -100,00 | 0 | -100,00 | ||||
| 2026-01-27 | 13F | Hamilton Capital Partners, Llc | 301.878 | 91 | ||||||
| 2026-02-10 | 13F | Bank of New York Mellon Corp | 11.217 | 0,00 | 3 | -40,00 | ||||
| 2026-02-12 | 13F | Federation des caisses Desjardins du Quebec | 5.900 | 0,00 | 2 | -50,00 | ||||
| 2026-02-13 | 13F | OpenArc Corporate Advisory, LLC | 20.000 | 6 | ||||||
| 2026-02-17 | 13F | Susquehanna International Group, Llp | 518.438 | -31,41 | 156 | -59,21 | ||||
| 2026-01-29 | 13F | Sanctuary Advisors, LLC | 0 | -100,00 | 0 | -100,00 | ||||
| 2026-02-17 | 13F | Susquehanna International Group, Llp | Put | 190.000 | 19,87 | 57 | -27,85 | |||
| 2026-02-17 | 13F | Northern Trust Corp | 349.358 | 26,18 | 105 | -25,18 | ||||
| 2026-02-17 | 13F | Citadel Advisors Llc | Call | 189.300 | 54,28 | 57 | -8,20 | |||
| 2026-01-23 | 13F | Assetmark, Inc | 200 | 0,00 | 0 | |||||
| 2026-02-06 | 13F | Larson Financial Group LLC | 4.612 | 0,00 | 1 | -50,00 | ||||
| 2026-02-17 | 13F | Captrust Financial Advisors | 18.964 | 6 | ||||||
| 2025-11-14 | 13F | Wolverine Trading, Llc | 11.913 | 6 | ||||||
| 2025-11-14 | 13F | Wolverine Trading, Llc | Call | 31.900 | -44,33 | 16 | -42,86 | |||
| 2025-11-14 | 13F | Wolverine Trading, Llc | Put | 34.200 | -46,31 | 17 | -45,16 | |||
| 2026-02-09 | 13F | Geode Capital Management, Llc | 1.868.138 | 0,86 | 561 | -39,98 | ||||
| 2026-02-12 | 13F | BlackRock, Inc. | 2.818.104 | 0,00 | 845 | -40,45 | ||||
| 2026-02-13 | 13F | Evelyn Partners Investment Management Services Ltd | 2 | 0 | ||||||
| 2026-02-17 | 13F | Pinnacle Financial Partners, Inc. | 50.500 | 15 | ||||||
| 2026-02-06 | 13F | Legato Capital Management LLC | 48.257 | 0,00 | 14 | -41,67 | ||||
| 2026-02-13 | 13F | State Street Corp | 786.384 | 0,00 | 236 | -40,66 | ||||
| 2026-01-29 | 13F | Vanguard Group Inc | 6.935.047 | 0,00 | 2.081 | -40,49 | ||||
| 2026-02-03 | 13F | SBI Securities Co., Ltd. | 16.795 | -21,12 | 5 | -50,00 | ||||
| 2026-01-06 | 13F | Penbrook Management LLC | 0 | -100,00 | 0 | -100,00 | ||||
| 2026-01-23 | 13F | Kelsey Financial, LLC | 12.000 | 4 | ||||||
| 2026-02-12 | 13F | Steward Partners Investment Advisory, Llc | 603 | 0,00 | 0 | |||||
| 2026-02-17 | 13F | SageView Advisory Group, LLC | 45 | 0 | ||||||
| 2025-11-14 | 13F | Millennium Management Llc | 0 | -100,00 | 0 | -100,00 | ||||
| 2026-02-17 | 13F | XTX Topco Ltd | 0 | -100,00 | 0 | |||||
| 2026-01-23 | 13F | Farther Finance Advisors, LLC | 0 | -100,00 | 0 | |||||
| 2026-02-12 | 13F | Hrt Financial Lp | 0 | -100,00 | 0 | |||||
| 2026-02-13 | 13F | Evelyn Partners Asset Management Ltd | 0 | -100,00 | 0 | |||||
| 2026-01-26 | 13F | Cwm, Llc | 575 | 0 | ||||||
| 2026-02-11 | 13F | Jpmorgan Chase & Co | 0 | -100,00 | 0 | |||||
| 2026-02-13 | 13F | Morgan Stanley | 8.000 | -77,48 | 2 | -88,24 | ||||
| 2026-02-12 | 13F | Renaissance Technologies Llc | 0 | -100,00 | 0 | -100,00 | ||||
| 2026-02-17 | 13F | Jones Financial Companies Lllp | 100 | 0,00 | 0 | |||||
| 2026-02-05 | 13F | Western Wealth Management, LLC | 20.000 | 17,67 | 6 | -25,00 | ||||
| 2026-02-13 | 13F | Mariner, LLC | 13.053 | 0,00 | 4 | -50,00 | ||||
| 2026-01-27 | 13F | TD Waterhouse Canada Inc. | 43 | 0,00 | 0 | |||||
| 2026-02-17 | 13F | Bank Of America Corp /de/ | 2.462 | -60,90 | 1 | -100,00 | ||||
| 2025-11-06 | 13F | Abich Financial Wealth Management LLC | 49.000 | 25 | ||||||
| 2026-02-03 | 13F | Washington Trust Advisors, Inc. | 0 | -100,00 | 0 | |||||
| 2026-02-05 | 13F | Cambridge Investment Research Advisors, Inc. | 462.200 | 128,59 | 0 | |||||
| 2026-02-11 | 13F | Simplex Trading, Llc | Put | 13.600 | -51,77 | 4 | ||||
| 2026-02-11 | 13F | Simplex Trading, Llc | 181.016 | 3,49 | 54 | |||||
| 2026-02-13 | 13F | Sargent Investment Group, LLC | 44.800 | 1,82 | 13 | -40,91 | ||||
| 2026-02-13 | 13F | JustInvest LLC | 17.444 | 0,00 | 5 | -37,50 | ||||
| 2025-09-24 | NP | SWTSX - Schwab Total Stock Market Index Fund This fund is a listed as child fund of Charles Schwab Investment Management Inc and if that institution has disclosed ownership in this security, then these positions will not be double counted when calculating total shares and total value | 50.000 | 0,00 | 27 | 30,00 | ||||
| 2026-02-13 | 13F | Essex Investment Management Co Llc | 174.614 | -14,87 | 52 | -49,51 | ||||
| 2026-02-13 | 13F | Citigroup Inc | 1.566 | 0 | ||||||
| 2026-01-30 | 13F | R Squared Ltd | 0 | -100,00 | 0 | -100,00 | ||||
| 2026-02-11 | 13F | Simplex Trading, Llc | Call | 64.700 | 5,89 | 19 | ||||
| 2026-02-17 | 13F | Advisory Services Network, LLC | 65.000 | 20 | ||||||
| 2026-02-17 | 13F | Cape Investment Advisory, Inc. | 500 | 0,00 | 0 | |||||
| 2026-02-12 | 13F | Jane Street Group, Llc | 706.284 | -45,46 | 212 | -67,64 | ||||
| 2026-02-11 | 13F | LPL Financial LLC | 0 | -100,00 | 0 | |||||
| 2026-02-12 | 13F | Jane Street Group, Llc | Put | 19.100 | 52,80 | 6 | -16,67 | |||
| 2026-02-11 | 13F | Group One Trading, L.p. | Put | 13.400 | -73,47 | 4 | -84,00 | |||
| 2026-02-27 | 13F/A | Barclays Plc | 0 | -100,00 | 0 | |||||
| 2026-02-11 | 13F | Group One Trading, L.p. | Call | 311.100 | -49,96 | 93 | -70,29 | |||
| 2026-02-17 | 13F | Two Sigma Securities, Llc | 53.217 | 381,21 | 16 | 200,00 | ||||
| 2026-02-11 | 13F | Group One Trading, L.p. | 369.365 | 202,56 | 111 | 80,33 | ||||
| 2026-02-17 | 13F | Fmr Llc | 3 | -99,77 | 0 | |||||
| 2026-01-07 | 13F | Sovereign Financial Group, Inc. | 17.000 | 0,00 | 5 | -37,50 | ||||
| 2026-02-05 | 13F | Allworth Financial LP | 586 | 0,00 | 0 | |||||
| 2026-02-17 | 13F | Tower Research Capital LLC (TRC) | 10.820 | 100,30 | 3 | 50,00 | ||||
| 2026-02-17 | 13F | Citadel Advisors Llc | 0 | -100,00 | 0 | |||||
| 2025-11-07 | 13F | Synovus Financial Corp | 50.500 | 0,00 | 25 | 8,70 | ||||
| 2026-02-17 | 13F | Susquehanna International Group, Llp | Call | 156.100 | -76,36 | 47 | -86,06 | |||
| 2025-11-14 | 13F | Raymond James Financial Inc | 0 | -100,00 | 0 | |||||
| 2026-02-12 | 13F | Richmond Brothers, Inc. | 18.358 | 31,40 | 6 | -28,57 | ||||
| 2026-02-17 | 13F | Creative Planning | 11.866 | -32,85 | 4 | -62,50 | ||||
| 2026-02-10 | 13F/A | Northwestern Mutual Wealth Management Co | 200 | 0 | ||||||
| 2026-01-28 | 13F | Morton Brown Family Wealth, LLC | 14.285 | 4 | ||||||
| 2026-02-17 | 13F | Royal Bank Of Canada | 51 | -79,68 | 0 | |||||
| 2026-02-12 | 13F | Jane Street Group, Llc | Call | 0 | -100,00 | 0 | -100,00 | |||
| 2026-02-12 | 13F | Promethium Advisors,llc | 10.000 | 0,00 | 3 | -40,00 | ||||
| 2026-02-11 | 13F | J.w. Cole Advisors, Inc. | 73.190 | -2,66 | 22 | -43,24 |
Other Listings
| US:OPTT | 0,39 $ |