Grundlæggende statistik
| Institutionelle aktier (lange) | 23.579.576 - 25,90% (ex 13D/G) - change of 11,45MM shares 94,41% MRQ |
| Institutionel værdi (lang) | $ 551.405 USD ($1000) |
Institutionelt ejerskab og aktionærer
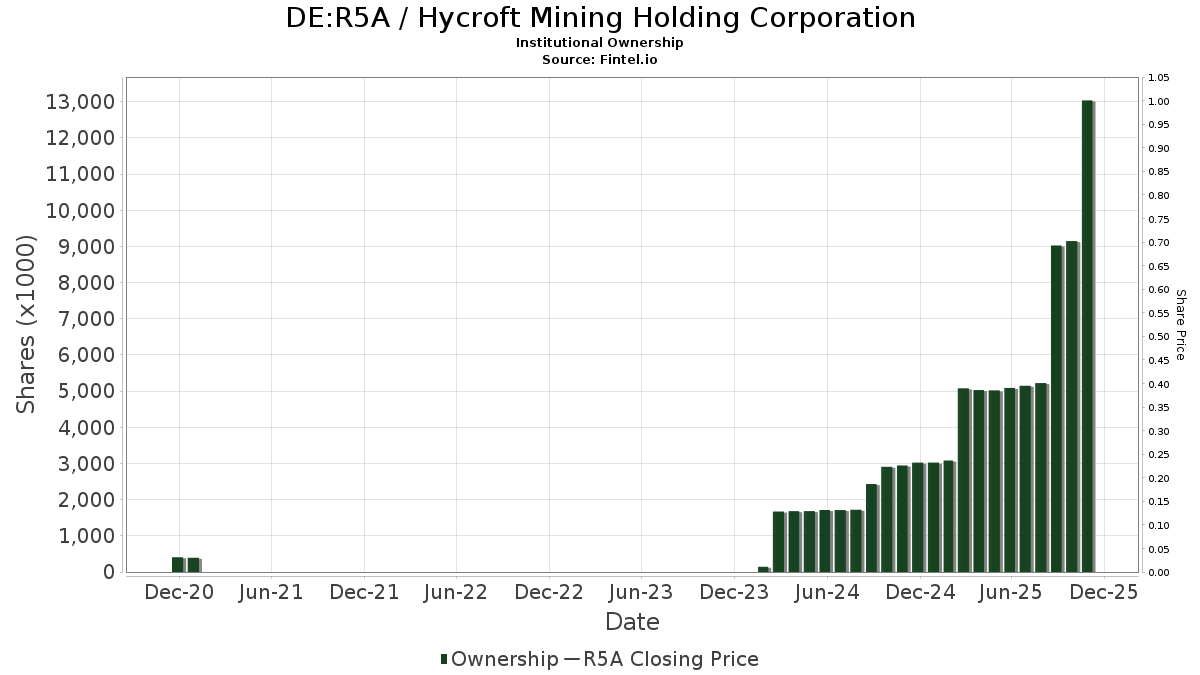
Hycroft Mining Holding Corporation (DE:R5A) har 127 institutionelle ejere og aktionærer, der har indsendt 13D/G- eller 13F-formularer til Securities Exchange Commission (SEC). Disse institutioner har i alt 23,579,576 aktier. Største aktionærer omfatter BlackRock, Inc., Toroso Investments, LLC, Vanguard Group Inc, Franklin Resources Inc, MIRAE ASSET GLOBAL ETFS HOLDINGS Ltd., Schroder Investment Management Group, Susquehanna International Group, Llp, UBS Group AG, Extract Advisors LLC, and Geode Capital Management, Llc .
Hycroft Mining Holding Corporation (DB:R5A) institutionel ejerskabsstruktur viser aktuelle positioner i virksomheden efter institutioner og fonde, samt seneste ændringer i positionsstørrelse. Større aktionærer kan omfatte individuelle investorer, investeringsforeninger, hedgefonde eller institutioner. Skema 13D angiver, at investoren besidder (eller besidder) mere end 5 % af virksomheden og har til hensigt (eller har til hensigt at) aktivt at forfølge en ændring i forretningsstrategi. Skema 13G indikerer en passiv investering på over 5%.
Fondens stemningsscore
Fund Sentiment Score (fka Ownership Accumulation Score) finder de aktier, der bliver mest købt af fonde. Det er resultatet af en sofistikeret, multi-faktor kvantitativ model, der identificerer virksomheder med de højeste niveauer af institutionel akkumulering. Scoringsmodellen bruger en kombination af den samlede stigning i oplyste ejere, ændringerne i porteføljeallokeringer i disse ejere og andre målinger. Tallet går fra 0 til 100, hvor højere tal indikerer et højere niveau af akkumulering for sine jævnaldrende, og 50 er gennemsnittet.
Opdateringsfrekvens: Dagligt
Se Ownership Explorer, som giver en liste over højest rangerende virksomheder.
AI+ Ask Fintel’s AI assistant about Hycroft Mining Holding Corporation.
Select a question to share a public post with an AI-crafted answer.
Thinking of good questions…
13F og NPORT arkivering
Detaljer om 13F-arkivering er gratis. Detaljer om NP-ansøgninger kræver et premium-medlemskab. Grønne rækker angiver nye positioner. Røde rækker angiver lukkede positioner. Klik på linket ikon for at se den fulde transaktionshistorik.
Opgrader
for at låse premium-data op og eksportere til Excel ![]() .
.
| Fil dato | Kilde | Investor | Type | Gennemsnitlig pris (Øst) |
Aktier | Δ Aktier (%) |
Rapporteret Værdi ($1000) |
Δ Værdi (%) |
Port Alloc (%) |
|
|---|---|---|---|---|---|---|---|---|---|---|
| 2026-04-15 | 13F | Exchange Traded Concepts, Llc | 0 | -100,00 | 0 | -100,00 | ||||
| 2026-02-13 | 13F | Pinnacle Wealth Planning Services, Inc. | 253 | 6 | ||||||
| 2026-02-17 | 13F | XTX Topco Ltd | 17.164 | -25,65 | 408 | 184,62 | ||||
| 2026-02-13 | 13F | LM Asset (IM) Inc. | 0 | -100,00 | 0 | -100,00 | ||||
| 2026-04-28 | 13F | Bogart Wealth, LLC | 8.890 | 313 | ||||||
| 2026-01-07 | 13F | Aventura Private Wealth, LLC | 0 | -100,00 | 0 | |||||
| 2026-04-21 | 13F | October Effect Ltd | 68.856 | 2.424 | ||||||
| 2026-02-17 | 13F | Cetera Investment Advisers | 216.080 | 347,05 | 5.136 | 1.617,73 | ||||
| 2026-04-17 | 13F | AdvisorNet Financial, Inc | 125 | 4 | ||||||
| 2026-04-28 | 13F | Integrated Advisors Network LLC | 20.529 | 102,68 | 723 | 200,83 | ||||
| 2026-02-17 | 13F | Engineers Gate Manager LP | 12.741 | 303 | ||||||
| 2026-02-13 | 13F | Wells Fargo & Company/mn | 3.000 | 71 | ||||||
| 2026-02-13 | 13F | Citigroup Inc | 9.255 | 220 | ||||||
| 2026-02-17 | 13F | Jones Financial Companies Lllp | 230 | 0,00 | 5 | 400,00 | ||||
| 2026-02-09 | 13F | Frazier Financial Advisors, LLC | 0 | -100,00 | 0 | |||||
| 2026-02-13 | 13F | OMERS ADMINISTRATION Corp | 26.800 | 28,23 | 637 | 393,80 | ||||
| 2026-02-17 | 13F | Susquehanna International Group, Llp | Put | 305.300 | 769,80 | 7.257 | 3.243,78 | |||
| 2025-11-14 | 13F | Wolverine Trading, Llc | Put | 28.700 | 22,65 | 182 | 151,39 | |||
| 2026-02-17 | 13F | Susquehanna International Group, Llp | Call | 1.070.500 | 55,21 | 25.446 | 495,07 | |||
| 2026-04-24 | 13F | Tcfg Wealth Management, Llc | 55.405 | 79,39 | 1.950 | 165,67 | ||||
| 2026-02-17 | 13F | Susquehanna International Group, Llp | 186.679 | -46,65 | 4.437 | 104,56 | ||||
| 2026-02-10 | 13F | Bank of New York Mellon Corp | 13.926 | 331 | ||||||
| 2025-11-13 | 13F | Timelo Investment Management Inc. | 0 | -100,00 | 0 | -100,00 | ||||
| 2026-04-13 | 13F | Hm Payson & Co | 5.000 | -50,00 | 176 | -25,74 | ||||
| 2026-02-13 | 13F | National Bank Of Canada /fi/ | 4.143 | 98 | ||||||
| 2026-04-24 | 13F | UMA Financial Services, Inc. | 393 | -3,20 | 14 | 44,44 | ||||
| 2026-02-13 | 13F | Toroso Investments, LLC | 2.838.448 | 81,22 | 67.470 | 594,84 | ||||
| 2026-02-12 | 13F | Jane Street Group, Llc | Put | 176.800 | 4.203 | |||||
| 2026-02-13 | 13F | Centiva Capital, LP | 0 | -100,00 | 0 | |||||
| 2026-01-26 | 13F | Main Street Group, LTD | 0 | -100,00 | 0 | |||||
| 2026-02-12 | 13F | Jane Street Group, Llc | Call | 53.900 | 338,21 | 1.281 | 1.585,53 | |||
| 2026-02-13 | 13F | Marshall Wace, Llp | 11.425 | -87,07 | 272 | -50,46 | ||||
| 2026-04-13 | 13F | IFP Advisors, Inc | 103 | 4 | ||||||
| 2026-01-29 | 13F | Vanguard Group Inc | 2.835.578 | 150,21 | 67.402 | 859,31 | ||||
| 2026-02-13 | 13F | Morgan Stanley | 231.275 | 350,00 | 5.497 | 1.628,62 | ||||
| 2025-11-14 | 13F | Wolverine Trading, Llc | 22.206 | 82,03 | 141 | 278,38 | ||||
| 2026-02-12 | 13F | Jane Street Group, Llc | 227.195 | -14,56 | 5.400 | 227,67 | ||||
| 2025-11-14 | 13F | Wolverine Trading, Llc | Call | 56.600 | 204,30 | 358 | 528,07 | |||
| 2026-02-12 | 13F | Federation des caisses Desjardins du Quebec | 37.810 | 7.462,00 | 899 | 29.833,33 | ||||
| 2026-01-27 | 13F | TD Waterhouse Canada Inc. | 681 | 16 | ||||||
| 2026-02-13 | 13F | Barclays Plc | 43.638 | 705,58 | 1.037 | 3.042,42 | ||||
| 2026-04-27 | 13F | Leonteq Securities AG | 1.800 | 63 | ||||||
| 2026-02-17 | 13F | Scientech Research LLC | 28.076 | 667 | ||||||
| 2026-04-24 | 13F | Private Advisor Group, LLC | 6.800 | 239 | ||||||
| 2026-02-13 | 13F | State Street Corp | 297.818 | 197,68 | 7.079 | 1.041,77 | ||||
| 2026-02-17 | 13F | Balyasny Asset Management Llc | 24.543 | 583 | ||||||
| 2026-02-17 | 13F | Qube Research & Technologies Ltd | 146.188 | 137,65 | 3.475 | 811,81 | ||||
| 2026-02-17 | 13F | Two Sigma Advisers, Lp | 0 | -100,00 | 0 | -100,00 | ||||
| 2026-02-17 | 13F | Advisor Group Holdings, Inc. | 3.491 | 17,11 | 83 | 446,67 | ||||
| 2026-02-17 | 13F | Millennium Management Llc | 571.526 | 61,60 | 13.585 | 519,75 | ||||
| 2026-02-13 | 13F | Squarepoint Ops LLC | 27.202 | -90,06 | 647 | -61,93 | ||||
| 2026-04-16 | 13F | SG Americas Securities, LLC | 57.329 | 326,36 | 2 | |||||
| 2026-02-12 | 13F | Sprott Inc. | 198.724 | -75,65 | 4.724 | -6,66 | ||||
| 2026-01-26 | 13F | Cwm, Llc | 230 | 0 | ||||||
| 2026-02-06 | 13F | Global Retirement Partners, LLC | 42.075 | 1,14 | 1.000 | 289,11 | ||||
| 2026-04-14 | 13F | Tradewinds Capital Management, LLC | 100 | 4 | ||||||
| 2026-02-11 | 13F | Simplex Trading, Llc | 5.720 | 136 | ||||||
| 2026-02-13 | 13F | First Trust Advisors Lp | 15.730 | 374 | ||||||
| 2026-02-17 | 13F | Quadrature Capital Ltd | 0 | -100,00 | 0 | -100,00 | ||||
| 2026-02-18 | 13F | VGI Partners Ltd | 314.677 | 7.480 | ||||||
| 2026-02-17 | 13F | Bank Of America Corp /de/ | 1.596 | -60,69 | 38 | 48,00 | ||||
| 2026-02-13 | 13F | Verition Fund Management LLC | 13.059 | 310 | ||||||
| 2026-02-12 | 13F | Hohimer Wealth Management, Llc | 83.625 | 1.988 | ||||||
| 2026-03-12 | 13F/A | Peak6 Llc | Call | 17.000 | 404 | |||||
| 2026-04-15 | 13F | FNY Investment Advisers, LLC | 1.000 | -5,66 | 0 | |||||
| 2026-02-10 | 13F | CIBC World Markets Inc. | 31.000 | 737 | ||||||
| 2026-02-17 | 13F | Occudo Quantitative Strategies Lp | 0 | -100,00 | 0 | |||||
| 2026-04-10 | 13F | Waldron Private Wealth LLC | 17.293 | -47,80 | 609 | -22,74 | ||||
| 2026-02-12 | 13F | Keel Point, LLC | 17.521 | 45,40 | 416 | 462,16 | ||||
| 2026-02-10 | 13F | Acadian Asset Management Llc | 171.611 | 1.407,08 | 4 | |||||
| 2026-02-10 | 13F | Bnp Paribas Arbitrage, Sa | 413 | -98,73 | 10 | -95,50 | ||||
| 2026-02-10 | 13F | Quantbot Technologies LP | 0 | -100,00 | 0 | |||||
| 2026-02-17 | 13F | Schonfeld Strategic Advisors LLC | 37.109 | 882 | ||||||
| 2025-11-14 | 13F | Oxford Asset Management Llp | 29.297 | 182 | ||||||
| 2026-04-22 | 13F | Pictet Asset Management Holding SA | 7.522 | 265 | ||||||
| 2025-11-14 | 13F | Cubist Systematic Strategies, LLC | 15.275 | 42,24 | 95 | 184,85 | ||||
| 2025-11-14 | 13F | Northwestern Mutual Wealth Management Co | 0 | -100,00 | 0 | |||||
| 2025-11-14 | 13F/A | Clear Harbor Asset Management, LLC | 0 | -100,00 | 0 | -100,00 | ||||
| 2026-03-03 | 13F/A | Caitong International Asset Management Co., Ltd | 139.988 | 3.328 | ||||||
| 2026-01-28 | 13F | Mountain Capital Investment Advisors, Inc | 6.564 | 332 | ||||||
| 2026-04-16 | 13F | Lincoln Capital Corp | 53.910 | 34,57 | 1.898 | 99,26 | ||||
| 2026-02-13 | 13F | FORA Capital, LLC | 11.690 | 278 | ||||||
| 2025-11-14 | 13F | Nbc Securities, Inc. | 0 | -100,00 | 0 | |||||
| 2026-02-17 | 13F | Tower Research Capital LLC (TRC) | 9.254 | 88,70 | 220 | 630,00 | ||||
| 2026-04-06 | 13F | GAMMA Investing LLC | 721 | 25 | ||||||
| 2026-03-04 | 13F | SHP Wealth Management | 25 | 1 | ||||||
| 2026-04-23 | 13F | Harbor Investment Advisory, Llc | 1.400 | 49 | ||||||
| 2026-04-27 | 13F | Sound Income Strategies, LLC | 182 | 6 | ||||||
| 2026-02-17 | 13F | Advisory Services Network, LLC | 19.000 | 850,00 | 452 | 3.658,33 | ||||
| 2026-02-13 | 13F | Bank Of Nova Scotia | 18.300 | 435 | ||||||
| 2026-02-13 | 13F | Centaurus Financial, Inc. | 6.819 | 0 | ||||||
| 2026-04-28 | 13F | SBI Securities Co., Ltd. | 1.020 | 58,88 | 36 | 133,33 | ||||
| 2026-02-10 | 13F | Goldman Sachs Group Inc | 237.141 | 66,24 | 5.637 | 537,56 | ||||
| 2026-02-17 | 13F | Ghisallo Capital Management LLC | 200.000 | 4.754 | ||||||
| 2026-02-17 | 13F | Shay Capital LLC | 129.895 | -24,57 | 3.088 | 189,32 | ||||
| 2026-02-09 | 13F | Geode Capital Management, Llc | 800.532 | 158,59 | 19.038 | 892,08 | ||||
| 2026-02-12 | 13F | Renaissance Technologies Llc | 287.064 | -71,35 | 6.824 | 9,85 | ||||
| 2026-02-13 | 13F | Walleye Capital LLC | 0 | -100,00 | 0 | -100,00 | ||||
| 2026-02-12 | 13F | Alps Advisors Inc | 32.950 | 783 | ||||||
| 2026-02-17 | 13F | Royal Bank Of Canada | 12.122 | 11.784,31 | 288 | 28.700,00 | ||||
| 2026-04-22 | 13F | Traphagen Investment Advisors Llc | 6.010 | 212 | ||||||
| 2026-01-28 | 13F | U S Global Investors Inc | 10.000 | 238 | ||||||
| 2025-11-10 | 13F | Hartland & Co., LLC | 0 | -100,00 | 0 | -100,00 | ||||
| 2026-04-20 | 13F | Contravisory Investment Management, Inc. | 977 | 34 | ||||||
| 2026-04-24 | 13F | Key FInancial Inc | 241 | 8 | ||||||
| 2026-02-13 | 13F | Landscape Capital Management, L.l.c. | 46.354 | 1.102 | ||||||
| 2026-02-13 | 13F | Charles Schwab Investment Management Inc | 30.213 | 718 | ||||||
| 2026-02-18 | 13F | Garton & Associates Financial Advisors LLC | 2.183 | 52 | ||||||
| 2026-02-05 | 13F | Allworth Financial LP | 200 | 0,00 | 5 | 300,00 | ||||
| 2026-02-17 | 13F | Point72 Asset Management, L.P. | 128.519 | 3.055 | ||||||
| 2025-11-17 | 13F | Alyeska Investment Group, L.P. | 0 | -100,00 | 0 | -100,00 | ||||
| 2026-02-17 | 13F | Northern Trust Corp | 143.032 | 147,03 | 3.400 | 849,44 | ||||
| 2026-04-07 | 13F | Farther Finance Advisors, LLC | 920 | 32 | ||||||
| 2026-02-04 | 13F | Meridian Wealth Management, LLC | 0 | -100,00 | 0 | -100,00 | ||||
| 2026-04-23 | 13F | Kohmann Bosshard Financial Services, LLC | 362 | 13 | ||||||
| 2026-02-12 | 13F | Bank Of Montreal /can/ | 66.045 | 136,52 | 1.570 | 806,94 | ||||
| 2026-01-29 | 13F | IMC-Chicago, LLC | 185.535 | 4.410 | ||||||
| 2026-02-12 | 13F | Federated Hermes, Inc. | 711 | -36,29 | 17 | 166,67 | ||||
| 2026-02-17 | 13F | 683 Capital Management, LLC | 50.000 | 1.188 | ||||||
| 2026-02-17 | 13F | Lighthouse Investment Partners, LLC | 9.030 | 215 | ||||||
| 2026-02-13 | 13F | Extract Advisors LLC | Put | 870.000 | 20.680 | |||||
| 2026-02-13 | 13F | Kestra Advisory Services, LLC | 3.410 | 81 | ||||||
| 2026-04-23 | 13F | North Star Investment Management Corp. | 330 | 12 | ||||||
| 2026-02-05 | 13F | Cambridge Investment Research Advisors, Inc. | 45.420 | -45,30 | 1 | |||||
| 2026-02-13 | 13F | Van Eck Associates Corp | 62.968 | 1 | ||||||
| 2026-02-23 | 13F | Virtu Financial LLC | 47.208 | 194,63 | 1 | |||||
| 2026-02-13 | 13F | Schroder Investment Management Group | 1.548.790 | 36.366 | ||||||
| 2026-02-17 | 13F | ExodusPoint Capital Management, LP | 0 | -100,00 | 0 | -100,00 | ||||
| 2026-02-03 | 13F | International Assets Investment Management, Llc | 1.000 | 24 | ||||||
| 2026-01-28 | 13F | N.E.W. Advisory Services LLC | 269 | 6 | ||||||
| 2026-02-11 | 13F | Jpmorgan Chase & Co | 1.324 | 4.313,33 | 31 | |||||
| 2026-02-12 | 13F | BlackRock, Inc. | 4.497.401 | 1.508,55 | 106.903 | 6.068,67 | ||||
| 2026-02-12 | 13F | Steward Partners Investment Advisory, Llc | 700 | 17 | ||||||
| 2026-02-13 | 13F | Hudson Bay Capital Management LP | 65.676 | 1.561 | ||||||
| 2025-11-14 | 13F | Point72 Asia (Singapore) Pte. Ltd. | 5.326 | 33 | ||||||
| 2026-04-15 | 13F | Fortitude Family Office, LLC | 522 | 0,00 | 18 | 50,00 | ||||
| 2026-01-13 | 13F | CoreCap Advisors, LLC | 0 | -100,00 | 0 | -100,00 | ||||
| 2026-02-09 | 13F | Kingsview Wealth Management, LLC | 9.782 | 233 | ||||||
| 2026-02-13 | 13F | L1 Global Manager Pty Ltd | 5.400 | 128 | ||||||
| 2026-02-17 | 13F | Citadel Advisors Llc | 75.223 | -58,39 | 1.788 | 59,64 | ||||
| 2026-04-23 | 13F | SJS Investment Consulting Inc. | 30 | 0,00 | 1 | |||||
| 2026-02-17 | 13F | Citadel Advisors Llc | Call | 200.800 | 118,50 | 4.773 | 738,84 | |||
| 2026-02-17 | 13F | Two Sigma Investments, Lp | 40.012 | -89,67 | 951 | -60,39 | ||||
| 2026-02-17 | 13F | Citadel Advisors Llc | Put | 361.400 | 251,56 | 8.590 | 1.248,51 | |||
| 2026-02-17 | 13F | Ninepoint Partners LP | 757.100 | 17.996 | ||||||
| 2026-02-10 | 13F | Foundations Investment Advisors, LLC | 108.285 | 2.574 | ||||||
| 2026-02-11 | 13F | Group One Trading, L.p. | 209.357 | 77,99 | 4.976 | 582,58 | ||||
| 2025-11-14 | 13F | Anson Funds Management LP | 0 | -100,00 | 0 | -100,00 | ||||
| 2026-02-11 | 13F | LPL Financial LLC | 8.840 | 210 | ||||||
| 2026-04-07 | 13F | Signaturefd, Llc | 1 | 0 | ||||||
| 2026-01-29 | 13F | UBS Group AG | 996.148 | 5,41 | 23.678 | 304,13 | ||||
| 2026-02-11 | 13F | Franklin Resources Inc | 1.675.000 | 39.815 | ||||||
| 2026-02-17 | 13F | Gotham Asset Management, LLC | 9.969 | 237 | ||||||
| 2026-02-17 | 13F | Algert Global Llc | 47.856 | 1 | ||||||
| 2026-02-17 | 13F | MIRAE ASSET GLOBAL ETFS HOLDINGS Ltd. | 1.641.106 | 85,93 | 39.009 | 612,88 | ||||
| 2026-02-17 | 13F | Fmr Llc | 36 | 0,00 | 1 |
Other Listings
| US:HYMC | 35,66 $ |