Grundlæggende statistik
| Institutionelle aktier (lange) | 7.161.756 - 55,32% (ex 13D/G) - change of 0,65MM shares 9,96% MRQ |
| Institutionel værdi (lang) | $ 549.025 USD ($1000) |
Institutionelt ejerskab og aktionærer
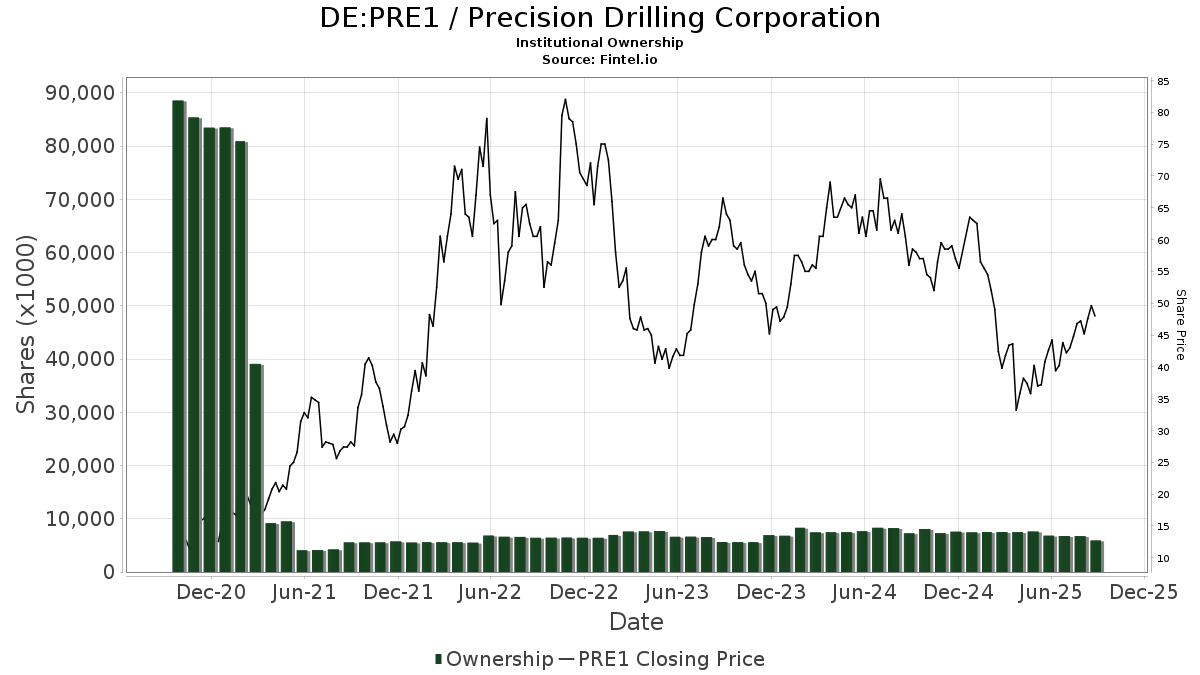
Precision Drilling Corporation (DE:PRE1) har 121 institutionelle ejere og aktionærer, der har indsendt 13D/G- eller 13F-formularer til Securities Exchange Commission (SEC). Disse institutioner har i alt 7,161,756 aktier. Største aktionærer omfatter FIL Ltd, National Bank Of Canada /fi/, Encompass Capital Advisors LLC, Aegis Financial Corp, Bank Of Montreal /can/, Goldman Sachs Group Inc, Pine Valley Investments Ltd Liability Co, Arrowstreet Capital, Limited Partnership, Hillsdale Investment Management Inc., and Picton Mahoney Asset Management .
Precision Drilling Corporation (DB:PRE1) institutionel ejerskabsstruktur viser aktuelle positioner i virksomheden efter institutioner og fonde, samt seneste ændringer i positionsstørrelse. Større aktionærer kan omfatte individuelle investorer, investeringsforeninger, hedgefonde eller institutioner. Skema 13D angiver, at investoren besidder (eller besidder) mere end 5 % af virksomheden og har til hensigt (eller har til hensigt at) aktivt at forfølge en ændring i forretningsstrategi. Skema 13G indikerer en passiv investering på over 5%.
The share price as of April 1, 2026 is 84,50 / share. Previously, on April 2, 2025, the share price was 43,60 / share. This represents an increase of 93,81% over that period.
Fondens stemningsscore
Fund Sentiment Score (fka Ownership Accumulation Score) finder de aktier, der bliver mest købt af fonde. Det er resultatet af en sofistikeret, multi-faktor kvantitativ model, der identificerer virksomheder med de højeste niveauer af institutionel akkumulering. Scoringsmodellen bruger en kombination af den samlede stigning i oplyste ejere, ændringerne i porteføljeallokeringer i disse ejere og andre målinger. Tallet går fra 0 til 100, hvor højere tal indikerer et højere niveau af akkumulering for sine jævnaldrende, og 50 er gennemsnittet.
Opdateringsfrekvens: Dagligt
Se Ownership Explorer, som giver en liste over højest rangerende virksomheder.
AI+ Ask Fintel’s AI assistant about Precision Drilling Corporation.
Select a question to share a public post with an AI-crafted answer.
Thinking of good questions…
13F og NPORT arkivering
Detaljer om 13F-arkivering er gratis. Detaljer om NP-ansøgninger kræver et premium-medlemskab. Grønne rækker angiver nye positioner. Røde rækker angiver lukkede positioner. Klik på linket ikon for at se den fulde transaktionshistorik.
Opgrader
for at låse premium-data op og eksportere til Excel ![]() .
.
| Fil dato | Kilde | Investor | Type | Gennemsnitlig pris (Øst) |
Aktier | Δ Aktier (%) |
Rapporteret Værdi ($1000) |
Δ Værdi (%) |
Port Alloc (%) |
|
|---|---|---|---|---|---|---|---|---|---|---|
| 2026-02-17 | 13F | Aquatic Capital Management LLC | 860 | -66,81 | 62 | -58,22 | ||||
| 2026-02-02 | 13F | Wolverine Asset Management Llc | Put | 0 | -100,00 | 0 | -100,00 | |||
| 2026-02-13 | 13F | Caitong International Asset Management Co., Ltd | 0 | -100,00 | 0 | |||||
| 2026-02-17 | 13F | Millennium Management Llc | 191.707 | 61,25 | 13.773 | 105,63 | ||||
| 2025-11-14 | 13F | Susquehanna Advisors Group, Inc. | 0 | -100,00 | 0 | |||||
| 2026-02-11 | 13F | Spark Investment Management LLC | 4.000 | 287 | ||||||
| 2026-02-13 | 13F | American Century Companies Inc | 133.017 | 1,88 | 9.545 | 29,80 | ||||
| 2026-02-17 | 13F | Creative Planning | 9.867 | 16,04 | 709 | 48,02 | ||||
| 2026-01-23 | 13F | Sumitomo Mitsui Trust Holdings, Inc. | 6.043 | 0,00 | 434 | 27,65 | ||||
| 2026-02-17 | 13F | Two Sigma Investments, Lp | 10.012 | -44,72 | 720 | -29,51 | ||||
| 2025-11-14 | 13F | Mountain Lake Investment Management LLC | 0 | -100,00 | 0 | |||||
| 2026-02-13 | 13F | Arrowstreet Capital, Limited Partnership | 300.852 | -37,83 | 21.602 | -20,76 | ||||
| 2026-02-13 | 13F | Causeway Capital Management Llc | 3.291 | 236 | ||||||
| 2026-02-13 | 13F | SIR Capital Management, L.P. | 56.178 | 0,36 | 4.031 | 27,85 | ||||
| 2026-01-13 | 13F | CoreCap Advisors, LLC | 250 | 0,00 | 18 | 21,43 | ||||
| 2026-02-14 | 13F | Rockefeller Capital Management L.P. | 9 | 1 | ||||||
| 2026-02-10 | 13F | Quantbot Technologies LP | 13.925 | 139,92 | 1.001 | 205,81 | ||||
| 2026-01-29 | 13F | Vanguard Group Inc | 12.475 | 0,00 | 895 | 27,49 | ||||
| 2026-02-17 | 13F | FIL Ltd | 850.331 | 27.294,68 | 61.017 | 34.967,24 | ||||
| 2026-02-17 | 13F | Susquehanna International Group, Llp | 0 | -100,00 | 0 | |||||
| 2026-02-10 | 13F | Acadian Asset Management Llc | 116.082 | -38,74 | 8 | -20,00 | ||||
| 2026-02-17 | 13F | SIG North Trading, ULC | Put | 35.600 | -48,41 | 2.559 | -34,21 | |||
| 2026-02-17 | 13F | SIG North Trading, ULC | Call | 48.300 | -40,74 | 3.472 | -24,43 | |||
| 2026-02-17 | 13F | SIG North Trading, ULC | 9.948 | 715 | ||||||
| 2026-02-17 | 13F | Citadel Advisors Llc | Put | 3.400 | 244 | |||||
| 2026-02-09 | 13F | Geode Capital Management, Llc | 8.853 | 5,29 | 632 | 33,62 | ||||
| 2026-02-17 | 13F | Citadel Advisors Llc | 91.109 | 724,44 | 6.549 | 952,73 | ||||
| 2026-01-29 | 13F | UBS Group AG | 116.155 | -25,87 | 8.349 | -5,46 | ||||
| 2026-02-17 | 13F | Susquehanna International Group, Llp | Call | 0 | -100,00 | 0 | ||||
| 2025-11-13 | 13F | Riggs Asset Managment Co. Inc. | 0 | -100,00 | 0 | |||||
| 2026-02-11 | 13F | Nikko Asset Management Americas, Inc. | 6.043 | 434 | ||||||
| 2026-02-13 | 13F | Police & Firemen's Retirement System of New Jersey | 4.786 | 0,00 | 344 | 27,51 | ||||
| 2026-02-13 | 13F | Quarry LP | 92 | -90,41 | 7 | -88,89 | ||||
| 2026-01-29 | 13F | Beirne Wealth Consulting Services, LLC | 3.270 | -43,33 | 235 | -27,69 | ||||
| 2026-02-18 | 13F | Vident Advisory, LLC | 3.088 | 222 | ||||||
| 2026-02-13 | 13F | Smartleaf Asset Management LLC | 74 | 5 | ||||||
| 2026-02-12 | 13F | Quadrant Capital Group Llc | 5.139 | 13,02 | 369 | 44,14 | ||||
| 2026-02-17 | 13F | Balyasny Asset Management Llc | 0 | -100,00 | 0 | |||||
| 2025-11-07 | 13F | Shell Asset Management Co | 200 | -75,00 | 0 | |||||
| 2026-02-17 | 13F | Alliancebernstein L.p. | 3.314 | 0,00 | 238 | -8,11 | ||||
| 2026-02-17 | 13F | Schonfeld Strategic Advisors LLC | 12.715 | 914 | ||||||
| 2026-02-17 | 13F | D. E. Shaw & Co., Inc. | 115.455 | 17,10 | 8.293 | 49,27 | ||||
| 2026-01-09 | 13F | Pacifica Partners Inc. | 265 | 0,00 | 19 | 35,71 | ||||
| 2026-02-12 | 13F | BlackRock, Inc. | 67.624 | 8,97 | 4.861 | 38,98 | ||||
| 2026-02-17 | 13F | Graham Capital Management, L.P. | 0 | -100,00 | 0 | |||||
| 2025-11-24 | 13F | CIBC Private Wealth Group, LLC | 0 | -100,00 | 0 | |||||
| 2026-02-09 | 13F | Nicola Wealth Management Ltd. | 28.000 | 0,00 | 2.009 | 27,39 | ||||
| 2026-02-12 | 13F | Dimensional Fund Advisors Lp | 210.238 | 8,76 | 15.112 | 38,71 | ||||
| 2026-02-05 | 13F | Abacus Wealth Partners, LLC | 5.177 | 372 | ||||||
| 2026-02-12 | 13F | Federation des caisses Desjardins du Quebec | 39.339 | 49,97 | 2.756 | 89,29 | ||||
| 2026-02-17 | 13F | Public Employees Retirement System Of Ohio | 15.412 | -22,19 | 1.107 | -0,72 | ||||
| 2026-01-27 | 13F | Zurcher Kantonalbank (Zurich Cantonalbank) | 5.112 | 19,72 | 367 | 52,92 | ||||
| 2026-02-10 | 13F | Goldman Sachs Group Inc | 312.655 | -0,68 | 22.474 | 26,67 | ||||
| 2025-12-01 | 13F/A | Polar Asset Management Partners Inc. | 0 | -100,00 | 0 | -100,00 | ||||
| 2026-02-13 | 13F | Morgan Stanley | 102.852 | 149,83 | 7.393 | 218,66 | ||||
| 2026-02-17 | 13F | Grantham, Mayo, Van Otterloo & Co. LLC | 71.200 | 2,74 | 5.116 | 31,05 | ||||
| 2026-01-27 | 13F | Greatmark Investment Partners, Inc. | 122.494 | 1,25 | 8.803 | 29,10 | ||||
| 2026-02-11 | 13F | Jpmorgan Chase & Co | 58.722 | 56,26 | 4.221 | 99,34 | ||||
| 2026-02-13 | 13F | Entropy Technologies, LP | 2.900 | 208 | ||||||
| 2026-02-12 | 13F | Jane Street Group, Llc | 43.378 | -1,70 | 3.118 | 25,42 | ||||
| 2026-02-13 | 13F | National Bank Of Canada /fi/ | 769.634 | 4,65 | 54.666 | 32,48 | ||||
| 2026-02-12 | 13F | Northwest & Ethical Investments L.P. | 18.342 | 28,15 | 1.318 | 61,79 | ||||
| 2026-02-17 | 13F | Brevan Howard Capital Management LP | 3.885 | 279 | ||||||
| 2026-02-11 | 13F | Franklin Resources Inc | 28.525 | -4,38 | 2.050 | 21,95 | ||||
| 2026-02-18 | 13F | GWM Advisors LLC | 4.482 | 322 | ||||||
| 2026-02-12 | 13F | Bank Of Montreal /can/ | 453.245 | -6,96 | 32.524 | 18,58 | ||||
| 2026-02-13 | 13F | Barclays Plc | 1.813 | -46,01 | 130 | -37,20 | ||||
| 2026-02-18 | 13F | Mackenzie Financial Corp | 21.784 | 45,91 | 1.566 | 86,43 | ||||
| 2026-02-17 | 13F | Pine Valley Investments Ltd Liability Co | Call | 23 | 22,22 | |||||
| 2026-02-17 | 13F | Citadel Advisors Llc | Call | 0 | -100,00 | 0 | ||||
| 2026-02-17 | 13F | Oberweis Asset Management Inc/ | 99.500 | 2,47 | 7.152 | 30,70 | ||||
| 2026-02-17 | 13F | Advisor Group Holdings, Inc. | 261 | -86,57 | 19 | -83,93 | ||||
| 2025-11-14 | 13F | Brooklands Fund Management Ltd | Call | 0 | -100,00 | 0 | ||||
| 2026-02-10 | 13F | Connor, Clark & Lunn Investment Management Ltd. | 9.651 | -37,37 | 693 | -20,18 | ||||
| 2026-02-12 | 13F | Swiss National Bank | 26.100 | -2,25 | 1.877 | 24,73 | ||||
| 2026-01-23 | 13F | Farther Finance Advisors, LLC | 23 | 15,00 | 2 | 0,00 | ||||
| 2025-11-14 | 13F | Raymond James Financial Inc | 0 | -100,00 | 0 | |||||
| 2026-02-12 | 13F | Scotia Capital Inc. | 4.952 | 356 | ||||||
| 2026-02-12 | 13F | Nuveen, LLC | 10.446 | 0,00 | 751 | 27,55 | ||||
| 2026-02-17 | 13F | Two Sigma Advisers, Lp | 10.560 | -57,69 | 759 | -46,02 | ||||
| 2026-02-12 | 13F | Campbell & CO Investment Adviser LLC | 26.108 | 1.877 | ||||||
| 2026-02-12 | 13F | CoreCommodity Management, LLC | 7.718 | -15,91 | 554 | 7,36 | ||||
| 2026-02-19 | 13F | Invesco Ltd. | 9.614 | 5,51 | 691 | 34,70 | ||||
| 2026-01-06 | 13F | Investors Research Corp | 705 | 0,00 | 51 | 28,21 | ||||
| 2026-02-11 | 13F | Group One Trading, L.p. | Put | 0 | -100,00 | 0 | ||||
| 2026-02-13 | 13F | MAI Capital Management | 24 | 0,00 | 2 | 0,00 | ||||
| 2026-02-12 | 13F | Jane Street Group, Llc | Call | 0 | -100,00 | 0 | -100,00 | |||
| 2025-10-02 | 13F/A | Mirabella Financial Services Llp | 9.774 | 442 | ||||||
| 2026-01-30 | 13F | Archer Investment Corp | 10 | 0,00 | 1 | |||||
| 2026-02-06 | 13F | Global Retirement Partners, LLC | 15 | 0,00 | 1 | |||||
| 2026-02-09 | 13F | Legal & General Group Plc | 14.807 | -14,82 | 1.064 | 8,58 | ||||
| 2026-01-30 | 13F | Us Bancorp \de\ | 1.083 | -8,84 | 78 | 16,67 | ||||
| 2026-02-13 | 13F | Charles Schwab Investment Management Inc | 37.473 | 6,64 | 2.692 | 36,03 | ||||
| 2026-02-13 | 13F | Y-Intercept (Hong Kong) Ltd | 2.860 | 206 | ||||||
| 2026-02-17 | 13F | Point72 Asset Management, L.P. | 5.871 | -48,29 | 422 | -33,96 | ||||
| 2026-02-13 | 13F | Citigroup Inc | 8.191 | 53,13 | 589 | 95,35 | ||||
| 2026-02-12 | 13F | Steward Partners Investment Advisory, Llc | 8 | 0,00 | 1 | |||||
| 2026-01-15 | 13F | Founders Capital Management | 300 | 0,00 | 22 | 31,25 | ||||
| 2026-01-14 | 13F | Tradewinds Capital Management, LLC | 0 | -100,00 | 0 | |||||
| 2026-02-10 | 13F | Bnp Paribas Arbitrage, Sa | 9.790 | 49,37 | 704 | 90,51 | ||||
| 2025-11-14 | 13F | ExodusPoint Capital Management, LP | 8.800 | 29,41 | 496 | |||||
| 2026-02-05 | 13F | Allworth Financial LP | 374 | 7,78 | 27 | 36,84 | ||||
| 2026-02-12 | 13F | Aristides Capital LLC | 3.133 | 225 | ||||||
| 2026-02-17 | 13F | Royal Bank Of Canada | 46.238 | -85,94 | 3.324 | -82,07 | ||||
| 2025-10-15 | 13F | Marshall & Sullivan Inc /wa/ | 0 | -100,00 | 0 | |||||
| 2026-02-10 | 13F | CIBC World Markets Inc. | 9.303 | -4,22 | 668 | 22,16 | ||||
| 2026-02-17 | 13F | Guardian Partners Inc. | 3.372 | 281 | ||||||
| 2026-02-13 | 13F | Stifel Financial Corp | 0 | -100,00 | 0 | -100,00 | ||||
| 2026-02-12 | 13F | Aegis Financial Corp | 504.059 | 11,43 | 36.221 | 42,13 | ||||
| 2026-02-02 | 13F | Fifth Third Bancorp | 57 | 0,00 | 4 | 33,33 | ||||
| 2026-02-13 | 13F | Wells Fargo & Company/mn | 750 | 3,31 | 54 | 32,50 | ||||
| 2026-02-06 | 13F | Bare Financial Services, Inc | 18 | 0,00 | 1 | 0,00 | ||||
| 2026-02-13 | 13F | Dynamic Technology Lab Private Ltd | 0 | -100,00 | 0 | |||||
| 2026-01-27 | 13F | TD Waterhouse Canada Inc. | 13.696 | -3,28 | 952 | 19,47 | ||||
| 2026-02-13 | 13F | K2 Principal Fund, L.p. | 0 | -100,00 | 0 | |||||
| 2026-02-17 | 13F | PDT Partners, LLC | 3.183 | 229 | ||||||
| 2026-02-17 | 13F | Bank Of America Corp /de/ | 49.971 | -50,12 | 3.592 | -36,39 | ||||
| 2025-11-05 | 13F | SBI Securities Co., Ltd. | 0 | -100,00 | 0 | |||||
| 2026-02-05 | 13F | Northwestern Mutual Wealth Management Co | 116.690 | 11.668.900,00 | 52.478 | |||||
| 2026-02-03 | 13F | Ballentine Partners, LLC | 4.668 | 1,52 | 336 | 29,34 | ||||
| 2026-02-17 | 13F | Amundi | 2.894 | 208 | ||||||
| 2026-02-10 | 13F | State of Wyoming | 4.490 | 4,01 | 323 | 32,51 | ||||
| 2025-11-14 | 13F | Ubs Asset Management Americas Inc | 0 | -100,00 | 0 | |||||
| 2026-02-04 | 13F | Versor Investments LP | 6.624 | 475 | ||||||
| 2026-01-20 | 13F | Signaturefd, Llc | 2.662 | 3,70 | 191 | 32,64 | ||||
| 2026-02-11 | 13F | Deutsche Bank Ag\ | 365 | -84,63 | 26 | -80,45 | ||||
| 2026-02-17 | 13F | PharVision Advisers, LLC | 0 | -100,00 | 0 | |||||
| 2025-11-14 | 13F | Peak6 Llc | 0 | -100,00 | 0 | -100,00 | ||||
| 2025-11-14 | 13F | Point72 Asia (Singapore) Pte. Ltd. | 646 | 36 | ||||||
| 2026-01-16 | 13F | Ronald Blue Trust, Inc. | 20 | -16,67 | 1 | 0,00 | ||||
| 2026-02-13 | 13F | Peak6 Llc | Call | 0 | -100,00 | 0 | ||||
| 2026-02-11 | 13F | Parallel Advisors, LLC | 489 | 8,19 | 35 | 40,00 | ||||
| 2025-11-14 | 13F | Peak6 Llc | Put | 0 | -100,00 | 0 | -100,00 | |||
| 2026-01-22 | 13F | Quotient Wealth Partners, LLC | 79.161 | -18,02 | 5.690 | 4,58 | ||||
| 2026-02-17 | 13F | Encompass Capital Advisors LLC | 556.638 | -0,17 | 39.954 | 27,23 | ||||
| 2026-02-13 | 13F/A | Alberta Investment Management Corp | 0 | -100,00 | 0 | |||||
| 2026-02-13 | 13F | Oceanic Investment Management LTD | 0 | -100,00 | 0 | |||||
| 2026-02-13 | 13F | Pine Valley Investments Ltd Liability Co | 302.904 | -13,01 | 21.773 | 10,95 | ||||
| 2026-02-17 | 13F | Orion Resource Partners LP | 0 | -100,00 | 0 | |||||
| 2026-01-30 | 13F | Moody Aldrich Partners Llc | 10.100 | 0,00 | 726 | 27,64 | ||||
| 2026-02-10 | 13F | Hillsdale Investment Management Inc. | 291.836 | 20.979 | ||||||
| 2026-02-02 | 13F | Wolverine Asset Management Llc | 802 | -78,91 | 58 | -73,36 | ||||
| 2026-02-17 | 13F | Hartree Partners, LP | 0 | -100,00 | 0 | |||||
| 2026-02-13 | 13F | JustInvest LLC | 6.787 | 60,03 | 488 | 103,77 | ||||
| 2026-02-06 | 13F | Pnc Financial Services Group, Inc. | 21 | 2 | ||||||
| 2026-02-17 | 13F | Lazard Asset Management Llc | 3.967 | -3,67 | 285 | 22,94 | ||||
| 2026-02-17 | 13F | Gotham Asset Management, LLC | 4.854 | -27,15 | 349 | -7,20 | ||||
| 2026-02-17 | 13F | Russell Investments Group, Ltd. | 8.114 | -13,52 | 583 | 10,23 | ||||
| 2026-02-10 | 13F | Td Asset Management Inc | 17.568 | 6,91 | 1.262 | 36,43 | ||||
| 2026-02-17 | 13F | Toronto Dominion Bank | Call | 1.000 | -72,97 | 72 | -65,87 | |||
| 2025-11-06 | 13F | MQS Management LLC | 0 | -100,00 | 0 | |||||
| 2026-02-17 | 13F | Toronto Dominion Bank | Put | 3.000 | 25,00 | 215 | 59,26 | |||
| 2026-02-17 | 13F | Trexquant Investment LP | 0 | -100,00 | 0 | |||||
| 2026-02-13 | 13F | Verition Fund Management LLC | 6.142 | -79,87 | 441 | -74,35 | ||||
| 2026-02-17 | 13F | XTX Topco Ltd | 10.035 | 55,05 | 721 | 98,08 | ||||
| 2026-01-29 | 13F | UMA Financial Services, Inc. | 39 | 0,00 | 3 | 0,00 | ||||
| 2026-02-17 | 13F | Toronto Dominion Bank | 11.540 | 172,43 | 828 | 247,90 | ||||
| 2026-02-11 | 13F | Picton Mahoney Asset Management | 261.950 | 6,49 | 18.823 | 144.692,31 | ||||
| 2026-02-17 | 13F | Tower Research Capital LLC (TRC) | 4.623 | 53,28 | 332 | 96,45 | ||||
| 2026-02-17 | 13F | Mason Hill Advisors Llc | 30.111 | 2.161 | ||||||
| 2025-11-14 | 13F | Aigen Investment Management, Lp | 0 | -100,00 | 0 | -100,00 | ||||
| 2025-11-14 | 13F | Lighthouse Investment Partners, LLC | 0 | -100,00 | 0 |