Grundlæggende statistik
| Institutionelle aktier (lange) | 3.247.497 - 66,32% (ex 13D/G) - change of -0,44MM shares -11,84% MRQ |
| Institutionel værdi (lang) | $ 677.106 USD ($1000) |
Institutionelt ejerskab og aktionærer
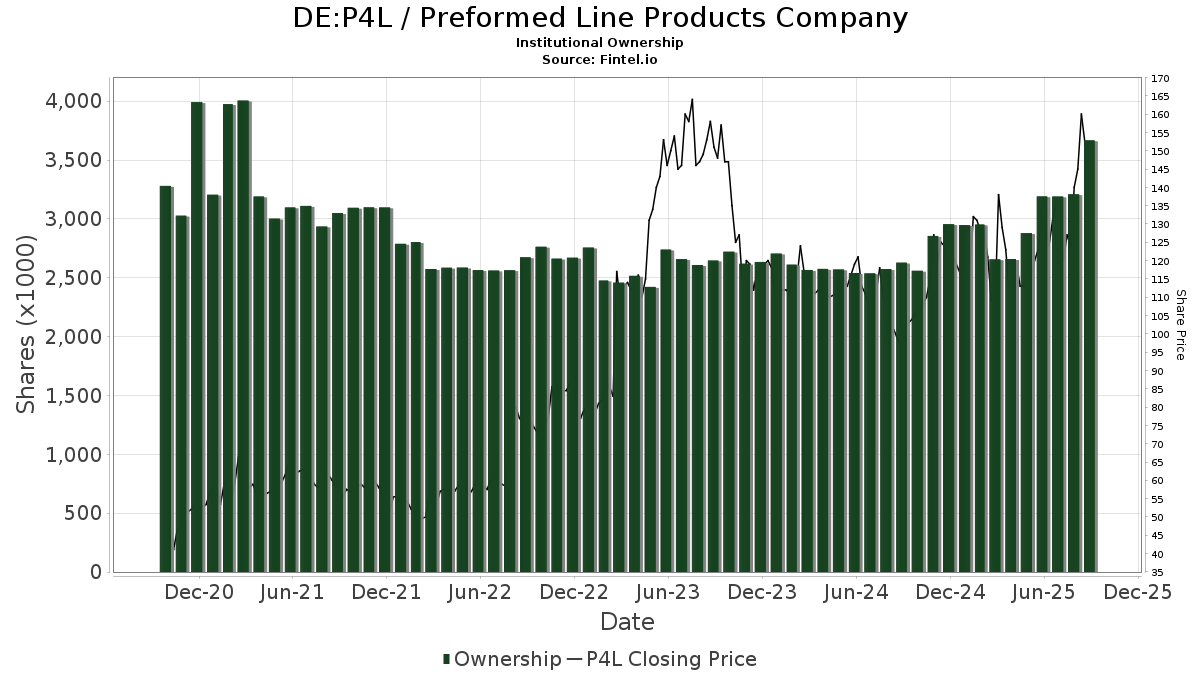
Preformed Line Products Company (DE:P4L) har 154 institutionelle ejere og aktionærer, der har indsendt 13D/G- eller 13F-formularer til Securities Exchange Commission (SEC). Disse institutioner har i alt 3,247,497 aktier. Største aktionærer omfatter HighTower Advisors, LLC, Dimensional Fund Advisors Lp, MIRAE ASSET GLOBAL ETFS HOLDINGS Ltd., BlackRock, Inc., Vanguard Group Inc, Royce & Associates Lp, Wasatch Advisors Inc, Fmr Llc, Invesco Ltd., and American Century Companies Inc .
Preformed Line Products Company (DB:P4L) institutionel ejerskabsstruktur viser aktuelle positioner i virksomheden efter institutioner og fonde, samt seneste ændringer i positionsstørrelse. Større aktionærer kan omfatte individuelle investorer, investeringsforeninger, hedgefonde eller institutioner. Skema 13D angiver, at investoren besidder (eller besidder) mere end 5 % af virksomheden og har til hensigt (eller har til hensigt at) aktivt at forfølge en ændring i forretningsstrategi. Skema 13G indikerer en passiv investering på over 5%.
The share price as of April 27, 2026 is 280,00 / share. Previously, on April 28, 2025, the share price was 116,00 / share. This represents an increase of 141,38% over that period.
Fondens stemningsscore
Fund Sentiment Score (fka Ownership Accumulation Score) finder de aktier, der bliver mest købt af fonde. Det er resultatet af en sofistikeret, multi-faktor kvantitativ model, der identificerer virksomheder med de højeste niveauer af institutionel akkumulering. Scoringsmodellen bruger en kombination af den samlede stigning i oplyste ejere, ændringerne i porteføljeallokeringer i disse ejere og andre målinger. Tallet går fra 0 til 100, hvor højere tal indikerer et højere niveau af akkumulering for sine jævnaldrende, og 50 er gennemsnittet.
Opdateringsfrekvens: Dagligt
Se Ownership Explorer, som giver en liste over højest rangerende virksomheder.
AI+ Ask Fintel’s AI assistant about Preformed Line Products Company.
Select a question to share a public post with an AI-crafted answer.
Thinking of good questions…
13F og NPORT arkivering
Detaljer om 13F-arkivering er gratis. Detaljer om NP-ansøgninger kræver et premium-medlemskab. Grønne rækker angiver nye positioner. Røde rækker angiver lukkede positioner. Klik på linket ikon for at se den fulde transaktionshistorik.
Opgrader
for at låse premium-data op og eksportere til Excel ![]() .
.
| Fil dato | Kilde | Investor | Type | Gennemsnitlig pris (Øst) |
Aktier | Δ Aktier (%) |
Rapporteret Værdi ($1000) |
Δ Værdi (%) |
Port Alloc (%) |
|
|---|---|---|---|---|---|---|---|---|---|---|
| 2026-02-17 | 13F | Millennium Management Llc | 19.470 | 303,69 | 4.025 | 325,37 | ||||
| 2026-04-07 | 13F | Signaturefd, Llc | 14 | 0,00 | 4 | 50,00 | ||||
| 2026-02-13 | 13F | Great West Life Assurance Co /can/ | 306 | 0,00 | 0 | |||||
| 2026-02-13 | 13F | Marshall Wace, Llp | 1.290 | 267 | ||||||
| 2026-01-30 | 13F | Shaker Investments Llc/oh | 4.084 | 55,29 | 844 | 63,88 | ||||
| 2026-04-02 | 13F | MJT & Associates Financial Advisory Group, Inc. | 4 | 1 | ||||||
| 2026-04-17 | 13F | AdvisorNet Financial, Inc | 300 | 0,00 | 81 | 30,65 | ||||
| 2026-02-17 | 13F | Two Sigma Investments, Lp | 17.459 | -57,77 | 3.609 | -55,50 | ||||
| 2026-02-13 | 13F | American Century Companies Inc | 73.716 | -8,25 | 15.238 | -3,31 | ||||
| 2026-02-13 | 13F | Arrowstreet Capital, Limited Partnership | 35.127 | -17,76 | 7.261 | -13,33 | ||||
| 2026-02-10 | 13F | Bank of New York Mellon Corp | 18.829 | -8,92 | 3.892 | -4,00 | ||||
| 2026-02-17 | 13F | Polymer Capital Management (US) LLC | 1.649 | -9,74 | 341 | -5,03 | ||||
| 2026-02-17 | 13F | Dark Forest Capital Management Lp | 1.573 | -41,61 | 325 | -38,45 | ||||
| 2026-02-13 | 13F | Toroso Investments, LLC | 2.981 | 141,77 | 616 | 155,60 | ||||
| 2026-02-03 | 13F | Enhancing Capital LLC | 1.860 | 0,00 | 384 | 5,49 | ||||
| 2026-02-17 | 13F | Topline Capital Management, LLC | 0 | -100,00 | 0 | |||||
| 2025-11-13 | 13F | Hsbc Holdings Plc | 0 | -100,00 | 0 | -100,00 | ||||
| 2026-02-12 | 13F | EAM Investors, LLC | 22.446 | 4.640 | ||||||
| 2026-02-05 | 13F | Amalgamated Bank | 81 | -6,90 | 0 | |||||
| 2026-04-13 | 13F | IFP Advisors, Inc | 118 | 32 | 416,67 | |||||
| 2026-02-13 | 13F | Victory Capital Management Inc | 0 | -100,00 | 0 | |||||
| 2026-02-17 | 13F/A | RBF Capital, LLC | 2.800 | 0,00 | 579 | 5,28 | ||||
| 2025-11-14 | 13F | Hrt Financial Lp | 0 | -100,00 | 0 | |||||
| 2026-02-05 | 13F | Cambridge Investment Research Advisors, Inc. | 7.905 | 514,22 | 2 | |||||
| 2026-02-05 | 13F | Center for Financial Planning, Inc. | 185 | 0,00 | 38 | 5,56 | ||||
| 2026-04-22 | 13F | Janney Montgomery Scott LLC | 2.625 | 18,24 | 1 | |||||
| 2026-02-10 | 13F | Acadian Asset Management Llc | 432 | 0 | ||||||
| 2025-11-03 | 13F | Annis Gardner Whiting Capital Advisors, LLC | 0 | -100,00 | 0 | -100,00 | ||||
| 2026-02-17 | 13F | Advisor Group Holdings, Inc. | 600 | -12,02 | 124 | -4,62 | ||||
| 2026-02-17 | 13F | Citadel Advisors Llc | 12.121 | 2.506 | ||||||
| 2025-11-04 | 13F | State of Wyoming | 0 | -100,00 | 0 | |||||
| 2026-04-15 | 13F | Pullen Investment Management, LLC | 6.891 | 1,35 | 1.866 | 32,74 | ||||
| 2026-02-02 | 13F | Principal Financial Group Inc | 10.510 | 50,98 | 2.173 | 59,12 | ||||
| 2026-01-29 | 13F | UBS Group AG | 22.629 | 199,25 | 4.678 | 215,37 | ||||
| 2026-02-09 | 13F | Quest Partners LLC | 196 | 41 | ||||||
| 2026-02-09 | 13F | Hartland & Co., LLC | 4.126 | 9,56 | 853 | 15,45 | ||||
| 2026-02-13 | 13F | Truvestments Capital Llc | 208 | 0,00 | 43 | 5,00 | ||||
| 2025-11-14 | 13F | OMERS ADMINISTRATION Corp | 0 | -100,00 | 0 | -100,00 | ||||
| 2025-11-10 | 13F | Options Solutions, Llc | 0 | -100,00 | 0 | |||||
| 2026-02-09 | 13F | Geode Capital Management, Llc | 73.602 | 1,90 | 15.216 | 7,39 | ||||
| 2026-04-22 | 13F | Spire Wealth Management | 3 | 1 | ||||||
| 2026-02-18 | 13F/A | Robotti Robert | 5.935 | -67,89 | 1.227 | -66,18 | ||||
| 2026-02-12 | 13F | Riverwater Partners LLC | 5.544 | 73,03 | 1.146 | 82,48 | ||||
| 2026-02-09 | 13F | Avalon Trust Co | 400 | 0,00 | 83 | 5,13 | ||||
| 2026-02-13 | 13F | Police & Firemen's Retirement System of New Jersey | 646 | 0,00 | 134 | 5,56 | ||||
| 2026-04-08 | 13F | Cardinal Capital Management | 12.186 | 0,68 | 3.299 | 31,85 | ||||
| 2026-02-12 | 13F | Polen Capital Management Llc | 0 | -100,00 | 0 | |||||
| 2026-01-15 | 13F | Nisa Investment Advisors, Llc | 41 | 272,73 | 8 | 300,00 | ||||
| 2026-01-28 | 13F | DekaBank Deutsche Girozentrale | 253 | 0,00 | 0 | |||||
| 2025-10-30 | 13F | Twin Peaks Wealth Advisors, LLC | 0 | -100,00 | 0 | |||||
| 2026-02-13 | 13F | Smartleaf Asset Management LLC | 2 | 100,00 | 0 | |||||
| 2026-02-13 | 13F | Rhumbline Advisers | 3.296 | -9,08 | 681 | -4,22 | ||||
| 2026-02-17 | 13F | Quadrature Capital Ltd | 0 | -100,00 | 0 | |||||
| 2025-11-14 | 13F | Point72 Asset Management, L.P. | 0 | -100,00 | 0 | |||||
| 2026-04-24 | 13F | Strs Ohio | 2.400 | -14,29 | 650 | 12,28 | ||||
| 2026-02-23 | 13F | Virtu Financial LLC | 2.038 | 0 | ||||||
| 2025-11-14 | 13F | Susquehanna International Group, Llp | 0 | -100,00 | 0 | |||||
| 2026-02-17 | 13F | Quantinno Capital Management LP | 4.676 | 9,12 | 967 | 15,00 | ||||
| 2025-11-13 | 13F | Jump Financial, LLC | 0 | -100,00 | 0 | |||||
| 2026-02-12 | 13F | BlackRock, Inc. | 199.623 | 5,35 | 41.264 | 11,02 | ||||
| 2026-02-17 | 13F | Alliancebernstein L.p. | 2.590 | -7,17 | 535 | -2,19 | ||||
| 2025-10-30 | 13F | TrueMark Investments, LLC | 0 | -100,00 | 0 | |||||
| 2026-04-17 | 13F | Wealthbridge Capital Management, Llc | 7.611 | -4,99 | 2.061 | 24,47 | ||||
| 2026-02-12 | 13F | Dimensional Fund Advisors Lp | 307.486 | -8,39 | 63.562 | -3,45 | ||||
| 2026-02-10 | 13F | Goldman Sachs Group Inc | 34.866 | 39,36 | 7.207 | 46,87 | ||||
| 2026-02-11 | 13F | Jpmorgan Chase & Co | 3.516 | 23,93 | 727 | 30,58 | ||||
| 2026-02-13 | 13F | Charles Schwab Investment Management Inc | 26.473 | -0,48 | 5.472 | 4,89 | ||||
| 2026-02-17 | 13F | Advisory Services Network, LLC | 0 | -100,00 | 0 | |||||
| 2026-04-20 | 13F | State of Alaska, Department of Revenue | 265 | 0,00 | 0 | |||||
| 2026-02-13 | 13F | SRS Capital Advisors, Inc. | 1 | -97,06 | 0 | -100,00 | ||||
| 2026-02-13 | 13F | Prudential Financial Inc | 7.791 | -1,32 | 1.610 | 4,01 | ||||
| 2026-04-24 | 13F | SummerHaven Investment Management, LLC | 4.684 | -7,58 | 1.268 | 21,11 | ||||
| 2026-02-17 | 13F | Grantham, Mayo, Van Otterloo & Co. LLC | 37.339 | -53,17 | 7.718 | -50,65 | ||||
| 2026-02-17 | 13F | Brevan Howard Capital Management LP | 1.325 | 274 | ||||||
| 2026-02-03 | 13F | Denali Advisors Llc | 0 | -100,00 | 0 | |||||
| 2026-04-16 | 13F | SG Americas Securities, LLC | 1.561 | -45,15 | 0 | |||||
| 2026-02-13 | 13F | Congruence Capital, LLC | 15.414 | 3.186 | ||||||
| 2026-02-12 | 13F | Jane Street Group, Llc | 6.051 | 22,37 | 1.251 | 29,00 | ||||
| 2026-02-13 | 13F | Ingalls & Snyder Llc | 4.070 | 0,00 | 1 | |||||
| 2026-04-27 | 13F | Sound Income Strategies, LLC | 1 | 0 | ||||||
| 2026-02-02 | 13F | CM Management, LLC | 25.000 | -10,71 | 5.168 | -5,92 | ||||
| 2026-02-06 | 13F | Covestor Ltd | 39 | -26,42 | 0 | |||||
| 2026-02-11 | 13F | Franklin Resources Inc | 2.046 | -0,58 | 423 | 4,71 | ||||
| 2026-02-17 | 13F | Aqr Capital Management Llc | 6.106 | 21,37 | 1.262 | 27,99 | ||||
| 2026-02-13 | 13F | Barclays Plc | 5.634 | 11,50 | 1.165 | 17,46 | ||||
| 2026-04-07 | 13F/A | Round Rock Advisors, LLC | 7.805 | 65,96 | 1.613 | 46,64 | ||||
| 2026-04-08 | 13F | Ausbil Investment Management Ltd | 5.209 | -23,22 | 1.518 | 8,27 | ||||
| 2026-02-11 | 13F | Ameritas Investment Partners, Inc. | 222 | 0,00 | 46 | 4,65 | ||||
| 2026-01-07 | 13F | Significant Wealth Partners LLC | 0 | -100,00 | 0 | |||||
| 2026-04-24 | 13F | Root Financial Partners, LLC | 7 | 2 | ||||||
| 2026-04-27 | 13F | Y-Intercept (Hong Kong) Ltd | 1.948 | 527 | ||||||
| 2026-02-10 | 13F | Connor, Clark & Lunn Investment Management Ltd. | 6.588 | 0,02 | 1.362 | 5,34 | ||||
| 2026-04-06 | 13F | Versant Capital Management, Inc | 96 | 0,00 | 26 | 31,58 | ||||
| 2026-02-12 | 13F | Swiss National Bank | 5.353 | 10,30 | 1.107 | 16,30 | ||||
| 2026-02-17 | 13F | Occudo Quantitative Strategies Lp | 0 | -100,00 | 0 | |||||
| 2026-02-13 | 13F | Stifel Financial Corp | 1.268 | 0,00 | 262 | 5,65 | ||||
| 2026-02-17 | 13F | Qube Research & Technologies Ltd | 9.881 | 64,99 | 2.043 | 73,94 | ||||
| 2026-02-06 | 13F | EverSource Wealth Advisors, LLC | 18 | -25,00 | 4 | -25,00 | ||||
| 2026-02-17 | 13F | Royal Bank Of Canada | 251 | 132,41 | 52 | 136,36 | ||||
| 2026-02-12 | 13F | Nuveen, LLC | 4.388 | 0,00 | 907 | 5,47 | ||||
| 2026-02-17 | 13F | Two Sigma Advisers, Lp | 2.100 | -52,27 | 434 | -49,71 | ||||
| 2026-02-10 | 13F | Rothschild Investment Llc | 1 | 0 | ||||||
| 2026-02-09 | 13F | Legal & General Group Plc | 2.217 | 0,86 | 458 | 6,26 | ||||
| 2026-02-13 | 13F | Ubs Asset Management Americas Inc | 4.316 | 88,06 | 892 | 98,22 | ||||
| 2026-02-02 | 13F | Montag A & Associates Inc | 150 | 0,00 | 31 | 6,90 | ||||
| 2026-02-13 | 13F | First Trust Advisors Lp | 16.399 | 29,44 | 3.390 | 36,38 | ||||
| 2026-02-19 | 13F | Invesco Ltd. | 79.299 | 25,72 | 16.392 | 32,48 | ||||
| 2026-02-13 | 13F | Sei Investments Co | 2.057 | 425 | ||||||
| 2026-02-13 | 13F | MAI Capital Management | 275 | 0,00 | 57 | 5,66 | ||||
| 2026-02-11 | 13F | LPL Financial LLC | 2.911 | 602 | ||||||
| 2026-02-13 | 13F | Baird Financial Group, Inc. | 2.300 | 0,00 | 475 | 5,32 | ||||
| 2026-02-17 | 13F | Susquehanna Portfolio Strategies, LLC | 13.256 | 0,00 | 2.740 | 5,38 | ||||
| 2026-01-30 | 13F | Laurel Wealth Advisors LLC | 2 | 0 | ||||||
| 2026-02-06 | 13F | HighTower Advisors, LLC | 966.185 | 11,56 | 199.720 | 17,57 | ||||
| 2026-01-30 | 13F | Us Bancorp \de\ | 50 | -50,00 | 10 | -47,37 | ||||
| 2026-02-13 | 13F | Citigroup Inc | 738 | -12,35 | 153 | -7,88 | ||||
| 2026-04-22 | 13F | Sterling Capital Management LLC | 80 | -42,03 | 22 | -25,00 | ||||
| 2026-02-17 | 13F | Janus Henderson Group Plc | 1.400 | 0,00 | 290 | 5,84 | ||||
| 2026-02-06 | 13F | Lsv Asset Management | 1.700 | 0,00 | 0 | |||||
| 2026-03-03 | 13F/A | Caitong International Asset Management Co., Ltd | 548 | 1.929,63 | 113 | 2.160,00 | ||||
| 2026-02-11 | 13F | O'shaughnessy Asset Management, Llc | 10.979 | -3,50 | 2.269 | 1,70 | ||||
| 2026-02-09 | 13F | Harbour Investments, Inc. | 10 | 0,00 | 2 | 100,00 | ||||
| 2026-02-10 | 13F | Bnp Paribas Arbitrage, Sa | 617 | 25,41 | 128 | 32,29 | ||||
| 2026-02-12 | 13F | Federated Hermes, Inc. | 25 | 92,31 | 5 | 150,00 | ||||
| 2026-02-13 | 13F | Martingale Asset Management L P | 8.859 | -3,18 | 1.831 | 2,06 | ||||
| 2026-02-17 | 13F | Price T Rowe Associates Inc /md/ | 1.437 | 12,53 | 0 | |||||
| 2026-01-26 | 13F | Cwm, Llc | 98 | 4,26 | 0 | |||||
| 2026-02-17 | 13F | State Of Wisconsin Investment Board | 3.592 | 45,43 | 743 | 53,31 | ||||
| 2026-04-21 | 13F | Founders Capital Management | 400 | -31,03 | 108 | -9,24 | ||||
| 2026-02-13 | 13F | Nierenberg Investment Management Company, Inc. | 0 | -100,00 | 0 | |||||
| 2025-11-12 | 13F/A | Norges Bank | 0 | -100,00 | 0 | |||||
| 2026-01-30 | 13F | Torren Management, LLC | 9 | 2 | ||||||
| 2026-02-13 | 13F | Wells Fargo & Company/mn | 2.984 | 62,88 | 617 | 71,59 | ||||
| 2026-02-17 | 13F | Bank Of America Corp /de/ | 2.504 | 87,01 | 518 | 97,33 | ||||
| 2026-02-17 | 13F | Creative Planning | 2.550 | 104,33 | 527 | 115,98 | ||||
| 2026-02-17 | 13F | Fmr Llc | 83.894 | 220,90 | 17.342 | 238,23 | ||||
| 2026-04-07 | 13F | Farther Finance Advisors, LLC | 1 | 0 | ||||||
| 2026-02-12 | 13F | New York State Common Retirement Fund | 821 | -37,85 | 170 | -34,75 | ||||
| 2026-02-13 | 13F | Colony Group, LLC | 1.500 | -1,64 | 294 | -1,67 | ||||
| 2026-02-13 | 13F | State Street Corp | 58.103 | -4,25 | 12.010 | 0,91 | ||||
| 2026-02-06 | 13F | Tortoise Investment Management, LLC | 0 | -100,00 | 0 | |||||
| 2026-04-08 | 13F | Ccg Wealth Management, Llc | 805 | 218 | ||||||
| 2026-02-17 | 13F | MIRAE ASSET GLOBAL ETFS HOLDINGS Ltd. | 223.014 | 2,53 | 46.100 | 8,05 | ||||
| 2026-02-06 | 13F | Larson Financial Group LLC | 0 | -100,00 | 0 | |||||
| 2026-02-09 | 13F | Huntington National Bank | 311 | 55,50 | 64 | 64,10 | ||||
| 2026-02-11 | 13F | Deutsche Bank Ag\ | 1.221 | -0,97 | 252 | 4,56 | ||||
| 2026-04-20 | 13F | Ritholtz Wealth Management | 9.389 | 11,17 | 2.542 | 45,62 | ||||
| 2026-04-24 | 13F | Private Advisor Group, LLC | 2.550 | -0,97 | 690 | 29,70 | ||||
| 2025-11-14 | 13F | Aquatic Capital Management LLC | 0 | -100,00 | 0 | |||||
| 2026-02-11 | 13F | Parallel Advisors, LLC | 6 | 0,00 | 1 | 0,00 | ||||
| 2025-11-12 | 13F | Hurley Capital, LLC | 0 | -100,00 | 0 | |||||
| 2025-11-14 | 13F | Centiva Capital, LP | 0 | -100,00 | 0 | |||||
| 2026-02-12 | 13F | MetLife Investment Management, LLC | 1.461 | 0,00 | 302 | 5,59 | ||||
| 2026-02-17 | 13F | Jones Financial Companies Lllp | 81 | -27,03 | 17 | -27,27 | ||||
| 2026-02-09 | 13F | Royce & Associates Lp | 117.703 | -11,59 | 24.330 | -6,83 | ||||
| 2026-04-21 | 13F | Wasatch Advisors Inc | 112.889 | 30.565 | ||||||
| 2025-11-14 | 13F | Raymond James Financial Inc | 0 | -100,00 | 0 | |||||
| 2026-02-11 | 13F | Los Angeles Capital Management Llc | 2.861 | -24,71 | 627 | -15,97 | ||||
| 2025-11-12 | 13F | R Squared Ltd | 0 | -100,00 | 0 | |||||
| 2025-11-12 | 13F | Aster Capital Management (DIFC) Ltd | 0 | -100,00 | 0 | |||||
| 2026-02-17 | 13F | Bridgeway Capital Management Inc | 1.000 | 207 | ||||||
| 2026-04-28 | 13F | Harbor Capital Advisors, Inc. | 37 | -7,50 | 0 | |||||
| 2026-02-10 | 13F | Quantbot Technologies LP | 0 | -100,00 | 0 | |||||
| 2026-02-12 | 13F | Renaissance Technologies Llc | 42.816 | -43,88 | 8.850 | -40,85 | ||||
| 2026-02-13 | 13F | Morgan Stanley | 22.470 | -36,62 | 4.645 | -33,21 | ||||
| 2026-04-06 | 13F | GAMMA Investing LLC | 46 | 12,20 | 12 | 50,00 | ||||
| 2026-01-28 | 13F | Klp Kapitalforvaltning As | 600 | -75,00 | 124 | -73,62 | ||||
| 2026-02-17 | 13F | California State Teachers Retirement System | 2.574 | 12,06 | 532 | 18,22 | ||||
| 2026-02-17 | 13F | Northern Trust Corp | 29.517 | -3,93 | 6.101 | 1,24 | ||||
| 2026-02-17 | 13F | Lazard Asset Management Llc | 17.668 | -3,02 | 3.652 | 2,21 | ||||
| 2026-04-21 | 13F | Fruth Investment Management | 2.200 | 0,00 | 1 | |||||
| 2026-01-14 | 13F | ORG Partners LLC | 4 | 1 | ||||||
| 2026-02-06 | 13F | Pnc Financial Services Group, Inc. | 31.510 | 0,00 | 6.513 | 5,39 | ||||
| 2026-02-13 | 13F | Jacobs Levy Equity Management, Inc | 0 | -100,00 | 0 | |||||
| 2026-04-17 | 13F | Baker Ellis Asset Management LLC | 2.980 | -9,97 | 807 | 17,84 | ||||
| 2026-01-29 | 13F | Vanguard Group Inc | 160.864 | -0,81 | 33.252 | 4,53 | ||||
| 2026-02-17 | 13F | Russell Investments Group, Ltd. | 260 | 22,07 | 54 | 29,27 | ||||
| 2026-04-21 | 13F | Vise Technologies, Inc. | 1.318 | 0,00 | 272 | 0,00 | ||||
| 2026-02-06 | 13F | Gsa Capital Partners Llp | 0 | -100,00 | 0 | |||||
| 2026-02-12 | 13F | CIBC Private Wealth Group, LLC | 2 | 0 | ||||||
| 2026-02-17 | 13F | Optiver Holding B.V. | 22 | 0,00 | 5 | 0,00 | ||||
| 2026-02-13 | 13F | Neuberger Berman Group LLC | 44.957 | 9.293 | ||||||
| 2026-02-09 | 13F | Keating Financial Advisory Services, Inc. | 9 | 2 | ||||||
| 2026-02-17 | 13F | Tower Research Capital LLC (TRC) | 239 | 74,45 | 49 | 88,46 | ||||
| 2026-02-17 | 13F | Man Group plc | 13.630 | 60,09 | 2.817 | 68,68 | ||||
| 2026-01-27 | 13F | WealthCollab, LLC | 33 | 0,00 | 7 | 0,00 |
Other Listings
| US:PLPC | 353,46 $ |