Grundlæggende statistik
| Institutionelle ejere | 206 total, 195 long only, 1 short only, 10 long/short - change of 6,19% MRQ |
| Del pris | 5,30 |
| Gennemsnitlig porteføljeallokering | 0.1654 % - change of -19,73% MRQ |
| Institutionelle aktier (lange) | 130.925.868 (ex 13D/G) - change of -21,12MM shares -13,76% MRQ |
| Institutionel værdi (lang) | $ 1.096.002 USD ($1000) |
Institutionelt ejerskab og aktionærer
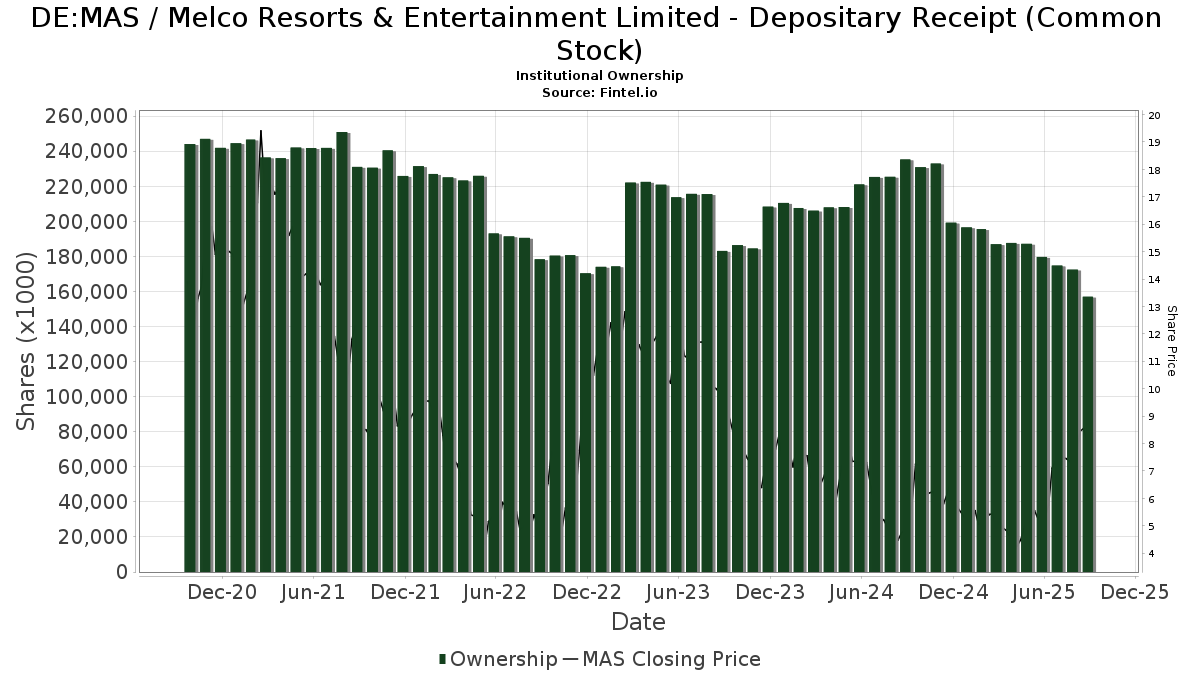
Melco Resorts & Entertainment Limited - Depositary Receipt (Common Stock) (DE:MAS) har 206 institutionelle ejere og aktionærer, der har indsendt 13D/G- eller 13F-formularer til Securities Exchange Commission (SEC). Disse institutioner har i alt 130,925,868 aktier. Største aktionærer omfatter ARGA Investment Management, LP, Citadel Advisors Llc, Arrowstreet Capital, Limited Partnership, Coronation Fund Managers Ltd., Jpmorgan Chase & Co, BlackRock, Inc., VTRIX - Vanguard International Value Fund Investor Shares, Renaissance Technologies Llc, QCSTRX - Stock Account Class R1, and LLINX - Longleaf Partners International Fund .
Melco Resorts & Entertainment Limited - Depositary Receipt (Common Stock) (DB:MAS) institutionel ejerskabsstruktur viser aktuelle positioner i virksomheden efter institutioner og fonde, samt seneste ændringer i positionsstørrelse. Større aktionærer kan omfatte individuelle investorer, investeringsforeninger, hedgefonde eller institutioner. Skema 13D angiver, at investoren besidder (eller besidder) mere end 5 % af virksomheden og har til hensigt (eller har til hensigt at) aktivt at forfølge en ændring i forretningsstrategi. Skema 13G indikerer en passiv investering på over 5%.
The share price as of February 9, 2026 is 5,30 / share. Previously, on February 10, 2025, the share price was 5,20 / share. This represents an increase of 1,92% over that period.
Fondens stemningsscore
Fund Sentiment Score (fka Ownership Accumulation Score) finder de aktier, der bliver mest købt af fonde. Det er resultatet af en sofistikeret, multi-faktor kvantitativ model, der identificerer virksomheder med de højeste niveauer af institutionel akkumulering. Scoringsmodellen bruger en kombination af den samlede stigning i oplyste ejere, ændringerne i porteføljeallokeringer i disse ejere og andre målinger. Tallet går fra 0 til 100, hvor højere tal indikerer et højere niveau af akkumulering for sine jævnaldrende, og 50 er gennemsnittet.
Opdateringsfrekvens: Dagligt
Se Ownership Explorer, som giver en liste over højest rangerende virksomheder.
AI+ Ask Fintel’s AI assistant about Melco Resorts & Entertainment Limited - Depositary Receipt (Common Stock).
Select a question to share a public post with an AI-crafted answer.
Thinking of good questions…
13F og NPORT arkivering
Detaljer om 13F-arkivering er gratis. Detaljer om NP-ansøgninger kræver et premium-medlemskab. Grønne rækker angiver nye positioner. Røde rækker angiver lukkede positioner. Klik på linket ikon for at se den fulde transaktionshistorik.
Opgrader
for at låse premium-data op og eksportere til Excel ![]() .
.
| Fil dato | Kilde | Investor | Type | Gennemsnitlig pris (Øst) |
Aktier | Δ Aktier (%) |
Rapporteret Værdi ($1000) |
Δ Værdi (%) |
Port Alloc (%) |
|
|---|---|---|---|---|---|---|---|---|---|---|
| 2025-09-24 | NP | IPAC - iShares Core MSCI Pacific ETF | 44.472 | -25,64 | 385 | 25,08 | ||||
| 2026-02-06 | 13F | Bare Financial Services, Inc | 117 | 0,00 | 1 | -100,00 | ||||
| 2025-11-13 | 13F | Wells Fargo & Company/mn | 36.365 | 8,34 | 333 | 37,60 | ||||
| 2026-02-06 | 13F | Gsa Capital Partners Llp | 96.515 | -65,78 | 1 | -100,00 | ||||
| 2026-02-10 | 13F | Connor, Clark & Lunn Investment Management Ltd. | 26.273 | -83,13 | 199 | -86,12 | ||||
| 2025-08-28 | NP | NDOW - Anydrus Advantage ETF | 12.702 | 92 | ||||||
| 2025-11-05 | 13F | Koesten, Hirschmann & Crabtree, INC. | 0 | -100,00 | 0 | |||||
| 2025-11-14 | 13F | Cetera Investment Advisers | 39.368 | 21,02 | 361 | 53,62 | ||||
| 2026-02-10 | 13F | AdvisorShares Investments LLC | 41.433 | 314 | ||||||
| 2025-10-31 | 13F | JustInvest LLC | 13.639 | 0,53 | 125 | 27,55 | ||||
| 2025-11-14 | 13F | Clough Capital Partners L P | 953.030 | 8.739 | ||||||
| 2025-08-14 | 13F | Toronto Dominion Bank | 0 | -100,00 | 0 | |||||
| 2025-08-14 | 13F | Smartleaf Asset Management LLC | 0 | -100,00 | 0 | |||||
| 2025-11-14 | 13F | Point72 Hong Kong Ltd | 305.334 | 2.800 | ||||||
| 2025-09-24 | NP | IEFA - iShares Core MSCI EAFE ETF | 1.221.711 | 1,25 | 10.568 | 70,05 | ||||
| 2025-11-10 | 13F | Citigroup Inc | 180.076 | -34,45 | 1.651 | -16,87 | ||||
| 2026-01-29 | 13F | DecisionPoint Financial, LLC | 145 | 0,00 | 1 | 0,00 | ||||
| 2026-01-16 | 13F | Ronald Blue Trust, Inc. | 58 | -69,47 | 0 | -100,00 | ||||
| 2025-11-12 | 13F | BlackRock, Inc. | 6.035.563 | -2,54 | 55.346 | 23,61 | ||||
| 2025-11-14 | 13F | OMERS ADMINISTRATION Corp | 47.470 | 435 | ||||||
| 2026-02-09 | 13F | Bleakley Financial Group, LLC | 355.600 | 33,51 | 2.692 | 10,20 | ||||
| 2026-01-29 | 13F | Vanguard Group Inc | 143.922 | -9,23 | 1.089 | -25,05 | ||||
| 2025-11-14 | 13F | J. Goldman & Co LP | Put | 144.200 | 1.322 | |||||
| 2026-02-06 | 13F | HighTower Advisors, LLC | 19.766 | -14,65 | 150 | -29,72 | ||||
| 2025-11-13 | 13F | Invesco Ltd. | 28.171 | 13,88 | 258 | 44,94 | ||||
| 2025-11-17 | 13F | Great West Life Assurance Co /can/ | 23.260 | 15,15 | 0 | |||||
| 2025-08-14 | 13F | Prelude Capital Management, Llc | 0 | -100,00 | 0 | |||||
| 2025-08-29 | NP | Gabelli Multimedia Trust Inc. | 25.000 | 0,00 | 181 | 37,40 | ||||
| 2026-02-06 | 13F | EverSource Wealth Advisors, LLC | 419 | -7,51 | 3 | -25,00 | ||||
| 2025-11-14 | 13F | Ubs Asset Management Americas Inc | 0 | -100,00 | 0 | |||||
| 2025-11-14 | 13F | Mariner, LLC | 46.121 | -4,41 | 423 | 21,26 | ||||
| 2025-11-14 | 13F | Royal Bank Of Canada | 6.028 | -99,60 | 55 | -99,50 | ||||
| 2025-11-14 | 13F | Hrt Financial Lp | 42.290 | 0 | ||||||
| 2026-02-06 | 13F | Pnc Financial Services Group, Inc. | 59 | -64,02 | 0 | -100,00 | ||||
| 2025-11-14 | 13F | Millennium Management Llc | 27.565 | 253 | ||||||
| 2026-02-05 | 13F | Pinnacle Associates Ltd | 26.860 | -3,12 | 203 | -20,08 | ||||
| 2025-09-25 | NP | VTRIX - Vanguard International Value Fund Investor Shares This fund is a listed as child fund of Vanguard Group Inc and if that institution has disclosed ownership in this security, then these positions will not be double counted when calculating total shares and total value | 5.893.638 | -1,90 | 50.980 | 64,77 | ||||
| 2025-11-13 | 13F | Arrowstreet Capital, Limited Partnership | 9.198.664 | 67,32 | 84.352 | 112,21 | ||||
| 2026-01-12 | 13F | DAVENPORT & Co LLC | 29.999 | -53,54 | 227 | -61,66 | ||||
| 2026-02-03 | 13F/A | Bank Of America Corp /de/ | 1.151.296 | 322,90 | 10.557 | 436,43 | ||||
| 2025-11-12 | 13F | Police & Firemen's Retirement System of New Jersey | 67.772 | 57,61 | 621 | 100,32 | ||||
| 2025-11-10 | 13F | Charles Schwab Investment Management Inc | 296.510 | -16,72 | 2.719 | 5,59 | ||||
| 2025-11-26 | 13F/A | Jpmorgan Chase & Co | 6.713.288 | -26,12 | 61.561 | -6,30 | ||||
| 2025-11-13 | 13F | Russell Investments Group, Ltd. | 125.373 | 1.150 | ||||||
| 2025-12-09 | 13F/A | Tudor Investment Corp Et Al | 12.321 | 113 | ||||||
| 2025-09-24 | NP | SCZ - iShares MSCI EAFE Small-Cap ETF | 614.379 | 3,28 | 5.314 | 73,49 | ||||
| 2025-11-12 | 13F | West Family Investments, Inc. | 12.848 | 2,21 | 118 | 30,00 | ||||
| 2026-01-26 | 13F | Cwm, Llc | 122 | -68,48 | 0 | |||||
| 2025-11-14 | 13F | Point72 Asset Management, L.P. | 163.379 | 1.498 | ||||||
| 2025-11-14 | 13F | Engineers Gate Manager LP | 10.550 | 97 | ||||||
| 2026-01-30 | 13F | Rachor Investment Advisory Services, LLC | 200 | 2 | ||||||
| 2025-11-14 | 13F | Numerai GP LLC | 42.632 | 391 | ||||||
| 2025-11-14 | 13F | Solel Partners LP | 0 | -100,00 | 0 | |||||
| 2026-02-09 | 13F | Wcm Investment Management, Llc | 4.073.099 | 12,38 | 30.996 | -13,09 | ||||
| 2025-11-12 | 13F | Brinker Capital Investments, LLC | 13.312 | -1,80 | 122 | 24,49 | ||||
| 2025-11-12 | 13F | Simplex Trading, Llc | Call | 140.100 | 13,44 | 1 | ||||
| 2025-11-14 | 13F | Raymond James Financial Inc | 123.471 | 10,50 | 1.132 | 40,27 | ||||
| 2026-01-05 | 13F | GAMMA Investing LLC | 2.879 | -9,35 | 22 | -27,59 | ||||
| 2025-11-14 | 13F | Tower Research Capital LLC (TRC) | 4.689 | 643,11 | 43 | 950,00 | ||||
| 2025-08-13 | 13F/A | StoneX Group Inc. | 11.800 | 117 | ||||||
| 2025-08-28 | NP | SPDW - SPDR(R) Portfolio Developed World ex-US ETF | 212.590 | 2,75 | 1.537 | 41,01 | ||||
| 2025-11-14 | 13F | Balyasny Asset Management Llc | Put | 300.000 | 2.750 | |||||
| 2025-11-14 | 13F | Balyasny Asset Management Llc | Call | 500.000 | 4.582 | |||||
| 2025-11-14 | 13F | Two Sigma Securities, Llc | 16.774 | 154 | ||||||
| 2025-11-14 | 13F | Balyasny Asset Management Llc | 880.096 | -42,74 | 8.070 | -27,38 | ||||
| 2025-08-13 | 13F | Amundi | 0 | -100,00 | 0 | |||||
| 2025-11-13 | 13F | Renaissance Technologies Llc | 4.980.700 | 19,29 | 45.673 | 51,30 | ||||
| 2026-02-09 | 13F | MQS Management LLC | 21.573 | 163 | ||||||
| 2025-11-12 | 13F | Simplex Trading, Llc | Put | 57.400 | -55,54 | 1 | ||||
| 2025-09-26 | NP | TEMRX - TIAA-CREF Emerging Markets Equity Fund Retail Class | 920.677 | -49,20 | 7.964 | -14,68 | ||||
| 2025-08-27 | NP | LLINX - Longleaf Partners International Fund | 4.078.727 | 52,58 | 29.489 | 109,33 | ||||
| 2025-11-12 | 13F | Simplex Trading, Llc | 67.421 | 35,87 | 1 | |||||
| 2025-11-14 | 13F | Bridger Management, Llc | 522.966 | 0,00 | 4.796 | 26,82 | ||||
| 2025-08-27 | 13F/A | Squarepoint Ops LLC | Put | 0 | -100,00 | 0 | -100,00 | |||
| 2026-01-27 | 13F | Atlantic Edge Private Wealth Management, LLC | 0 | -100,00 | 0 | |||||
| 2025-11-13 | 13F | Hsbc Holdings Plc | 111.194 | 1.043 | ||||||
| 2025-08-21 | NP | BJK - VanEck Vectors Gaming ETF | 29.200 | -4,55 | 211 | 31,06 | ||||
| 2025-11-04 | 13F | IMC-Chicago, LLC | 0 | -100,00 | 0 | -100,00 | ||||
| 2025-08-27 | NP | VICE - AdvisorShares Vice ETF | 46.800 | 338 | ||||||
| 2025-11-13 | 13F | Healthcare Of Ontario Pension Plan Trust Fund | 39.831 | 365 | ||||||
| 2025-11-13 | 13F | Entropy Technologies, LP | 47.605 | 437 | ||||||
| 2025-11-14 | 13F | Walleye Trading LLC | Put | 43.800 | -32,82 | 402 | -14,86 | |||
| 2026-01-15 | 13F | Frank, Rimerman Advisors LLC | 11.058 | 0,00 | 84 | -17,82 | ||||
| 2025-11-14 | 13F | Walleye Trading LLC | Call | 86.800 | -16,78 | 796 | 5,44 | |||
| 2025-11-12 | 13F | Solstein Capital, LLC | 0 | -100,00 | 0 | |||||
| 2025-11-24 | 13F | CIBC Private Wealth Group, LLC | 430 | -70,95 | 4 | -70,00 | ||||
| 2026-02-06 | 13F | Larson Financial Group LLC | 0 | -100,00 | 0 | |||||
| 2026-01-20 | 13F | Signaturefd, Llc | 11.012 | -1,34 | 83 | -18,63 | ||||
| 2025-11-17 | 13F | Caxton Associates Llp | 400.959 | 3.677 | ||||||
| 2025-10-31 | 13F | Y-Intercept (Hong Kong) Ltd | 64.148 | -53,63 | 588 | -41,20 | ||||
| 2025-10-30 | 13F | Ridgewood Investments LLC | 0 | -100,00 | 0 | |||||
| 2025-11-14 | 13F | Susquehanna International Group, Llp | Call | 190.500 | -8,10 | 1.747 | 16,56 | |||
| 2025-11-17 | 13F | GWM Advisors LLC | 63 | 0,00 | 1 | |||||
| 2025-11-14 | 13F | Susquehanna International Group, Llp | Put | 261.000 | 53,44 | 2.393 | 94,71 | |||
| 2025-09-26 | NP | RTIYX - Multifactor International Equity Fund Class Y | 8.400 | 0,00 | 24 | 71,43 | ||||
| 2025-11-13 | 13F | Pinpoint Asset Management (Singapore) Pte. Ltd. | 0 | -100,00 | 0 | -100,00 | ||||
| 2025-11-14 | 13F | Susquehanna International Group, Llp | 81.906 | 124,22 | 751 | 184,47 | ||||
| 2026-02-02 | 13F | Qrg Capital Management, Inc. | 50.791 | -17,17 | 384 | -31,67 | ||||
| 2025-11-14 | 13F | Susquehanna Portfolio Strategies, LLC | 161.337 | 1.479 | ||||||
| 2025-09-24 | NP | SFILX - Schwab Fundamental International Small Company Index Fund Institutional Shares | 62.868 | -3,67 | 544 | 61,61 | ||||
| 2025-11-13 | 13F | Lord, Abbett & Co. Llc | 435.000 | 4 | ||||||
| 2026-01-30 | 13F | Harbor Advisors LLC | 17.500 | 0,00 | 132 | -17,50 | ||||
| 2025-08-28 | NP | ARVIX - ARGA INTERNATIONAL VALUE FUND Institutional Shares | 185.949 | 0,00 | 1.344 | 37,28 | ||||
| 2025-11-14 | 13F | Jane Street Group, Llc | 59.220 | 112,27 | 543 | 170,15 | ||||
| 2025-11-04 | 13F | Jones Financial Companies Lllp | 2.856 | -31,28 | 27 | -6,90 | ||||
| 2025-11-14 | 13F | Jane Street Group, Llc | Put | 12.300 | 19,42 | 113 | 51,35 | |||
| 2025-11-14 | 13F | Jane Street Group, Llc | Call | 45.100 | -16,17 | 414 | 6,44 | |||
| 2025-08-11 | 13F | Bell Investment Advisors, Inc | 0 | -100,00 | 0 | |||||
| 2025-08-12 | 13F | Atlas Capital Advisors Llc | 35.843 | 5.598,41 | 259 | 8.533,33 | ||||
| 2025-08-28 | NP | ARMIX - ARGA EMERGING MARKETS VALUE FUND Institutional Shares | 1.338.151 | 0,00 | 9.675 | 37,18 | ||||
| 2026-02-05 | 13F | Gabelli Funds Llc | 25.000 | 0,00 | 189 | -17,47 | ||||
| 2026-02-10 | 13F | Envestnet Asset Management Inc | 96.558 | -42,71 | 731 | -52,75 | ||||
| 2025-11-14 | 13F | National Bank Of Canada /fi/ | 2.206.402 | 71.281,49 | 20.233 | 91.863,64 | ||||
| 2025-11-14 | 13F | Parallax Volatility Advisers, L.P. | Call | 55.700 | 0,00 | 511 | 26,87 | |||
| 2025-11-14 | 13F | Schonfeld Strategic Advisors LLC | 78.385 | 163,09 | 719 | 233,95 | ||||
| 2025-11-14 | 13F | Two Sigma Advisers, Lp | 304.800 | 58,01 | 2.795 | 100,50 | ||||
| 2025-11-14 | 13F | CastleKnight Management LP | 12.900 | 0,00 | 118 | 26,88 | ||||
| 2025-08-14 | 13F | Point72 Asia (Singapore) Pte. Ltd. | 0 | -100,00 | 0 | |||||
| 2025-11-14 | 13F | Squarepoint Ops LLC | Call | 39.800 | -34,97 | 365 | -17,65 | |||
| 2025-08-28 | NP | QCSTRX - Stock Account Class R1 | 4.201.830 | -0,54 | 30.379 | 36,46 | ||||
| 2025-12-15 | 13F | FNY Investment Advisers, LLC | 0 | -100,00 | 0 | |||||
| 2025-11-13 | 13F | Marshall Wace, Llp | 1.358.803 | -19,43 | 12.460 | 2,19 | ||||
| 2025-08-14 | 13F | Owl Creek Asset Management, L.P. | Call | 0 | -100,00 | 0 | -100,00 | |||
| 2026-01-26 | 13F | Private Trust Co Na | 0 | -100,00 | 0 | |||||
| 2025-11-14 | 13F | Wolverine Trading, Llc | Call | 62.400 | -32,61 | 614 | -7,81 | |||
| 2025-11-14 | 13F | Wolverine Trading, Llc | Put | 11.200 | -21,68 | 110 | 7,84 | |||
| 2026-02-03 | 13F/A | Mount Yale Investment Advisors, LLC | 0 | -100,00 | 0 | |||||
| 2025-11-14 | 13F | Public Employees Retirement System Of Ohio | 772.636 | -25,87 | 7.085 | -5,97 | ||||
| 2025-11-12 | 13F | Nuveen, LLC | 133.800 | -97,78 | 1.227 | -97,18 | ||||
| 2026-01-27 | 13F | Zurcher Kantonalbank (Zurich Cantonalbank) | 60.088 | 7,01 | 455 | -11,67 | ||||
| 2025-11-12 | 13F | Barclays Plc | Call | 743.600 | 6.819 | |||||
| 2025-11-12 | 13F | Barclays Plc | Put | 260.000 | 2.384 | |||||
| 2025-11-13 | 13F | Swiss National Bank | 362.447 | -1,55 | 3.324 | 24,88 | ||||
| 2025-11-12 | 13F | Barclays Plc | 75.902 | -74,16 | 696 | 34.700,00 | ||||
| 2025-11-14 | 13F | Vident Advisory, LLC | 26.408 | -14,39 | 242 | 8,52 | ||||
| 2025-12-15 | 13F/A | Hudson Bay Capital Management LP | 848.596 | -42,41 | 7.782 | -26,96 | ||||
| 2026-01-29 | 13F | Coronation Fund Managers Ltd. | 8.335.219 | 2,85 | 63.098 | -15,09 | ||||
| 2025-08-13 | 13F | Capital Research Global Investors | 0 | -100,00 | 0 | |||||
| 2026-01-21 | 13F | Leo Wealth, LLC | 12.000 | 0,00 | 91 | -18,18 | ||||
| 2025-11-14 | 13F | Man Group plc | 1.209.924 | 11.095 | ||||||
| 2025-11-14 | 13F | Southeastern Asset Management Inc/tn/ | 2.010.419 | -68,57 | 18.436 | -60,14 | ||||
| 2025-11-14 | 13F | Sig Brokerage, Lp | Call | 0 | -100,00 | 0 | ||||
| 2025-11-14 | 13F | Manufacturers Life Insurance Company, The | 66.881 | -0,28 | 613 | 26,65 | ||||
| 2025-11-14 | 13F | Brightlight Capital Management Lp | 1.235.300 | -22,74 | 11.328 | -2,02 | ||||
| 2026-01-22 | 13F | Pinnacle Bancorp, Inc. | 459 | 0,00 | 3 | -25,00 | ||||
| 2025-11-12 | 13F | Mcdonald Partners Llc | 0 | -100,00 | 0 | |||||
| 2025-08-28 | NP | SPGM - SPDR(R) Portfolio MSCI Global Stock Market ETF | 626 | 2,96 | 5 | 33,33 | ||||
| 2026-01-30 | 13F | ARGA Investment Management, LP | 22.852.595 | -9,30 | 172.994 | -25,12 | ||||
| 2026-01-29 | 13F | IMC-Chicago, LLC | Put | 105.000 | 18,78 | 795 | -1,98 | |||
| 2026-01-29 | 13F | IMC-Chicago, LLC | Call | 310.900 | 2,95 | 2.354 | -15,02 | |||
| 2025-11-13 | 13F | Parallel Advisors, LLC | 404 | 17,78 | 4 | 50,00 | ||||
| 2025-11-17 | 13F | PharVision Advisers, LLC | 44.295 | 406 | ||||||
| 2025-09-26 | NP | OWSMX - Old Westbury Small & Mid Cap Strategies Fund | 116.947 | -63,41 | 1.012 | -46,48 | ||||
| 2025-11-14 | 13F | Voloridge Investment Management, Llc | 906.482 | 8.312 | ||||||
| 2026-02-05 | 13F | Allworth Financial LP | 593 | -7,63 | 4 | -20,00 | ||||
| 2025-11-12 | 13F | Fox Run Management, L.l.c. | 43.955 | 403 | ||||||
| 2025-11-07 | 13F | Rothschild Investment Llc | 122 | 0,00 | 1 | |||||
| 2025-08-14 | 13F | Jain Global LLC | 0 | -100,00 | 0 | |||||
| 2025-11-14 | 13F | Federation des caisses Desjardins du Quebec | 7.796 | -6,97 | 71 | 18,33 | ||||
| 2025-09-29 | NP | PDN - Invesco FTSE RAFI Developed Markets ex-U.S. Small-Mid ETF This fund is a listed as child fund of Invesco Ltd. and if that institution has disclosed ownership in this security, then these positions will not be double counted when calculating total shares and total value | 19.090 | 112,70 | 165 | 258,70 | ||||
| 2025-11-14 | 13F | Cubist Systematic Strategies, LLC | 947.108 | 8.685 | ||||||
| 2025-11-10 | 13F | MAI Capital Management | 1.400 | -3,45 | 13 | 20,00 | ||||
| 2025-09-26 | NP | PCEMX - PACE International Emerging Markets Equity Investments Class P | 255.546 | 0,00 | 2.210 | 67,93 | ||||
| 2026-01-07 | 13F | Retirement Wealth Solutions LLC | 3 | -92,68 | 0 | |||||
| 2026-02-03 | 13F | Manning & Napier Advisors Llc | 99 | 1 | ||||||
| 2025-11-14 | 13F | Centiva Capital, LP | 71.959 | 660 | ||||||
| 2025-08-14 | 13F | Ubs Oconnor Llc | 0 | -100,00 | 0 | -100,00 | ||||
| 2025-08-18 | 13F | Wolverine Trading, Llc | 0 | -100,00 | 0 | -100,00 | ||||
| 2025-11-13 | 13F | Clearbridge Investments, LLC | 10.515 | -11,21 | 96 | 12,94 | ||||
| 2025-09-26 | NP | FTIHX - Fidelity Total International Index Fund This fund is a listed as child fund of Fmr Llc and if that institution has disclosed ownership in this security, then these positions will not be double counted when calculating total shares and total value | 94.224 | -0,86 | 815 | 66,67 | ||||
| 2025-08-12 | 13F | Coldstream Capital Management Inc | 0 | -100,00 | 0 | |||||
| 2025-11-14 | 13F | D. E. Shaw & Co., Inc. | 2.436.823 | 131,17 | 22.346 | 193,20 | ||||
| 2026-02-09 | 13F | Geode Capital Management, Llc | 357.394 | -2,81 | 2.704 | -19,77 | ||||
| 2025-11-12 | 13F | LPL Financial LLC | 87.788 | 805 | ||||||
| 2026-01-30 | 13F | Us Bancorp \de\ | 135.410 | -23,59 | 1.025 | -36,92 | ||||
| 2025-11-14 | 13F | State Street Corp | 1.865.017 | 5,94 | 17.102 | 34,37 | ||||
| 2025-12-09 | 13F | Swiss Life Asset Management Ltd | 0 | -100,00 | 0 | -100,00 | ||||
| 2025-08-28 | NP | SSGVX - State Street Global Equity ex-U.S. Index Portfolio State Street Global All Cap Equity ex-U.S. Index Portfolio This fund is a listed as child fund of State Street Corp and if that institution has disclosed ownership in this security, then these positions will not be double counted when calculating total shares and total value | 52.930 | 0,00 | 383 | 37,41 | ||||
| 2026-02-09 | 13F | Legal & General Group Plc | 114.890 | -9,59 | 870 | -25,34 | ||||
| 2026-02-10 | 13F | Bnp Paribas Arbitrage, Sa | 1.399.529 | 177,13 | 10.594 | 128,81 | ||||
| 2025-11-13 | 13F | Capital Wealth Planning, LLC | 451.089 | 4.136 | ||||||
| 2025-11-13 | 13F | Sei Investments Co | 1.806.688 | 160,84 | 16.567 | 230,88 | ||||
| 2025-11-14 | 13F | Creative Planning | 18.856 | 4,87 | 173 | 32,31 | ||||
| 2025-10-09 | 13F | Newman Dignan & Sheerar, Inc. | 0 | -100,00 | 0 | -100,00 | ||||
| 2026-02-03 | 13F | SBI Securities Co., Ltd. | 70 | -90,59 | 1 | -100,00 | ||||
| 2025-08-12 | 13F | XTX Topco Ltd | 0 | -100,00 | 0 | |||||
| 2025-11-14 | 13F | Morgan Stanley | 3.502.380 | 12,21 | 32.117 | 42,33 | ||||
| 2025-11-14 | 13F | Quarry LP | 7.391 | 68 | ||||||
| 2025-09-24 | NP | IXUS - iShares Core MSCI Total International Stock ETF | 306.537 | 4,67 | 2.652 | 75,80 | ||||
| 2025-11-14 | 13F | Mercer Global Advisors Inc /adv | 79.643 | 730 | ||||||
| 2025-11-19 | 13F | Sunbelt Securities, Inc. | 2.956 | -24,22 | 27 | 22,73 | ||||
| 2025-08-12 | 13F | Proequities, Inc. | Put | 0 | 0 | |||||
| 2025-11-12 | 13F | Group One Trading, L.p. | 70.084 | -53,67 | 643 | -41,26 | ||||
| 2025-08-12 | 13F | Proequities, Inc. | Call | 0 | 0 | |||||
| 2025-08-12 | 13F | Proequities, Inc. | 0 | 0 | ||||||
| 2026-01-13 | 13F | First Financial Corp /in/ | 2.000 | 0,00 | 15 | -16,67 | ||||
| 2025-11-12 | 13F | Group One Trading, L.p. | Put | 147.200 | -8,29 | 1.350 | 16,29 | |||
| 2025-11-14 | 13F | RBF Capital, LLC | 950.000 | -5,00 | 8.712 | 20,48 | ||||
| 2026-02-10 | 13F | Acadian Asset Management Llc | 606.063 | -77,51 | 5 | -83,33 | ||||
| 2025-11-12 | 13F | Group One Trading, L.p. | Call | 240.100 | 23,64 | 2.202 | 56,77 | |||
| 2025-11-14 | 13F | Ameriprise Financial Inc | 259.631 | 0,95 | 2.380 | 28,03 | ||||
| 2025-09-26 | NP | NITE - The Nightview Fund | 111.610 | 965 | ||||||
| 2025-11-12 | 13F/A | Norges Bank | 0 | -100,00 | 0 | |||||
| 2026-02-05 | 13F | Northwestern Mutual Wealth Management Co | 481 | -98,09 | 7 | -96,96 | ||||
| 2025-11-14 | 13F | Walleye Capital LLC | 1.338.472 | 205,70 | 12.274 | 287,77 | ||||
| 2026-02-10 | 13F | Goldman Sachs Group Inc | Put | 0 | -100,00 | 0 | -100,00 | |||
| 2025-11-13 | 13F | Jump Financial, LLC | 924.800 | 8.480 | ||||||
| 2025-11-13 | 13F | Natixis Advisors, L.p. | 206.559 | 2 | ||||||
| 2025-11-12 | 13F | Dimensional Fund Advisors Lp | 12.553 | 0,00 | 115 | 27,78 | ||||
| 2025-11-14 | 13F | Credit Agricole S A | 0 | -100,00 | 0 | |||||
| 2025-11-14 | 13F | Hudson Portfolio Management LLC | 0 | -100,00 | 0 | |||||
| 2026-01-30 | 13F | Samalin Investment Counsel, LLC | 13.773 | 0,00 | 104 | -17,46 | ||||
| 2025-11-14 | 13F | Transamerica Financial Advisors, Inc. | 170 | 2 | ||||||
| 2026-01-30 | 13F | Pekin Hardy Strauss, Inc. | 25.000 | 78,57 | 189 | 47,66 | ||||
| 2025-11-12 | 13F | Neuberger Berman Group LLC | 24.971 | 0,00 | 229 | 26,67 | ||||
| 2025-11-13 | 13F | Fmr Llc | 25 | 0,00 | 0 | |||||
| 2025-11-14 | 13F | Aigen Investment Management, Lp | 18.823 | 173 | ||||||
| 2025-10-28 | 13F | Campbell & CO Investment Adviser LLC | 100.537 | 868,56 | 922 | 1.128,00 | ||||
| 2026-01-23 | 13F | Farther Finance Advisors, LLC | 735 | 29,63 | 6 | 0,00 | ||||
| 2025-11-14 | 13F | Advisor Group Holdings, Inc. | 20.264 | 19,27 | 199 | 63,11 | ||||
| 2025-09-24 | NP | IDEV - iShares Core MSCI International Developed Markets ETF | 230.720 | 0,00 | 1.996 | 67,93 | ||||
| 2025-08-13 | 13F | Walleye Trading LLC | 0 | -100,00 | 0 | -100,00 | ||||
| 2025-09-26 | NP | FSISX - Fidelity SAI International Small Cap Index Fund | 53.337 | 1,83 | 461 | 71,38 | ||||
| 2025-11-13 | 13F | Brown Brothers Harriman & Co | 659 | 6 | ||||||
| 2025-11-13 | 13F | Quadrant Capital Group Llc | 3.609 | 33 | ||||||
| 2025-10-17 | 13F | Retireful, LLC | 0 | -100,00 | 0 | |||||
| 2025-08-12 | 13F | Long Corridor Asset Management Ltd | 0 | -100,00 | 0 | -100,00 | ||||
| 2026-01-28 | 13F | Geneos Wealth Management Inc. | 5.393 | 0,00 | 41 | -18,37 | ||||
| 2025-11-03 | 13F | New York State Common Retirement Fund | 1.405.042 | -19,61 | 12.884 | 1,96 | ||||
| 2025-08-14 | 13F | Point72 (DIFC) Ltd | 0 | -100,00 | 0 | -100,00 | ||||
| 2025-11-13 | 13F | Van Eck Associates Corp | 28.479 | -2,47 | 0 | |||||
| 2025-11-14 | 13F | Concentric Capital Strategies, LP | Call | 0 | -100,00 | 0 | ||||
| 2026-01-08 | 13F | Armstrong Advisory Group, Inc | 950 | 0,00 | 7 | -12,50 | ||||
| 2025-11-13 | 13F | Canada Pension Plan Investment Board | 0 | -100,00 | 0 | |||||
| 2025-11-05 | 13F | SOUTH STATE Corp | 0 | -100,00 | 0 | |||||
| 2025-11-14 | 13F | Aquatic Capital Management LLC | 12.829 | 0,00 | 118 | 27,17 | ||||
| 2025-11-17 | 13F | Sender Co & Partners, Inc. | 0 | -100,00 | 0 | |||||
| 2026-01-05 | 13F | Park Avenue Securities Llc | 0 | -100,00 | 0 | |||||
| 2026-02-10 | 13F | Goldman Sachs Group Inc | 451.214 | 10,89 | 3.416 | -8,47 | ||||
| 2025-09-25 | NP | DFAX - Dimensional World ex U.S. Core Equity 2 ETF | 11.953 | 0,00 | 103 | 68,85 | ||||
| 2025-11-13 | 13F | Mackenzie Financial Corp | 56.966 | 522 | ||||||
| 2025-11-12 | 13F | American Century Companies Inc | 20.025 | 0,00 | 184 | 27,08 | ||||
| 2025-11-14 | 13F | Northern Trust Corp | 273.688 | -5,58 | 2.510 | 19,76 | ||||
| 2025-11-14 | 13F | Two Sigma Investments, Lp | 14.760 | -74,50 | 135 | -67,70 | ||||
| 2025-11-14 | 13F | Alliancebernstein L.p. | 20.313 | -1,90 | 186 | 24,83 | ||||
| 2026-02-05 | 13F | Baader Bank INC | 0 | -100,00 | 0 | -100,00 | ||||
| 2025-11-14 | 13F | Citadel Advisors Llc | Call | 186.200 | -50,96 | 1.707 | -37,81 | |||
| 2025-11-14 | 13F | Citadel Advisors Llc | Put | 35.400 | 6,63 | 325 | 35,00 | |||
| 2026-02-06 | 13F | Global Retirement Partners, LLC | 232 | -97,31 | 2 | -98,73 | ||||
| 2026-01-29 | 13F | Pictet Asset Management Holding SA | 47.727 | 1,92 | 361 | -15,85 | ||||
| 2025-11-12 | 13F | Headlands Technologies LLC | 0 | -100,00 | 0 | |||||
| 2025-11-14 | 13F | Citadel Advisors Llc | 10.441.846 | -25,48 | 95.752 | -5,48 | ||||
| 2025-08-13 | 13F | Brown Advisory Inc | 0 | -100,00 | 0 | |||||
| 2025-08-12 | 13F | Clear Street Markets Llc | 0 | -100,00 | 0 | |||||
| 2025-11-13 | 13F | Deutsche Bank Ag\ | 267.098 | 1.607,46 | 2.449 | 2.067,26 | ||||
| 2026-01-23 | 13F | Assetmark, Inc | 18.292 | -43,56 | 138 | -53,54 | ||||
| 2025-11-14 | 13F | California State Teachers Retirement System | 201.895 | 0,00 | 1.851 | 26,87 | ||||
| 2025-08-12 | 13F | Clear Street Markets Llc | Call | 0 | -100,00 | 0 | ||||
| 2025-11-14 | 13F | Squarepoint Ops LLC | 0 | -100,00 | 0 | -100,00 | ||||
| 2025-11-13 | 13F | Public Employees Retirement Association Of Colorado | 59.993 | -2,91 | 1 | |||||
| 2025-08-11 | 13F | Wealthspire Advisors, LLC | 0 | -100,00 | 0 | |||||
| 2025-11-06 | 13F | Rhumbline Advisers | 3.886 | -19,08 | 36 | 2,94 | ||||
| 2025-08-13 | 13F | Maplelane Capital, Llc | 0 | -100,00 | 0 | |||||
| 2026-02-09 | 13F | Huntington National Bank | 215 | 7,50 | 2 | 0,00 | ||||
| 2025-11-12 | 13F | Principal Securities, Inc. | 2.014 | 352,58 | 18 | 500,00 | ||||
| 2025-11-19 | 13F | Caitong International Asset Management Co., Ltd | 2.272 | 195,45 | 21 | 300,00 | ||||
| 2026-01-29 | 13F | UBS Group AG | Call | 117.528 | -13,65 | 890 | -28,77 | |||
| 2025-11-14 | 13F | Algert Global Llc | 56.699 | -25,22 | 1 | |||||
| 2026-01-29 | 13F | UBS Group AG | 2.919.504 | 37,45 | 22.101 | 13,47 | ||||
| 2026-01-27 | 13F | Bayforest Capital Ltd | 1 | 0 | ||||||
| 2025-11-14 | 13F | Trexquant Investment LP | 672.629 | -45,46 | 6.168 | -30,83 | ||||
| 2025-11-14 | 13F | Verition Fund Management LLC | 233.794 | 2.144 | ||||||
| 2026-01-09 | 13F | SG Americas Securities, LLC | 158.491 | 45,28 | 1 | 0,00 | ||||
| 2025-11-14 | 13F | Rockefeller Capital Management L.P. | 1.670 | 15 | ||||||
| 2025-11-14 | 13F | Mml Investors Services, Llc | 17.441 | 160 | ||||||
| 2025-11-14 | 13F | Cantor Fitzgerald, L. P. | 0 | -100,00 | 0 | |||||
| 2026-01-30 | 13F | State of New Jersey Common Pension Fund D | 163.279 | -38,22 | 1.236 | -48,99 | ||||
| 2026-02-05 | 13F | Td Private Client Wealth Llc | 6.000 | -40,58 | 45 | -51,09 | ||||
| 2026-02-10 | 13F | Quantbot Technologies LP | 0 | -100,00 | 0 | |||||
| 2025-11-14 | 13F | State Of Wisconsin Investment Board | 11.263 | 103 |
Other Listings
| US:MLCO | 6,42 $ |