Grundlæggende statistik
| Institutionelle aktier (lange) | 15.707.766 - 97,02% (ex 13D/G) - change of -4,69MM shares -23,01% MRQ |
| Institutionel værdi (lang) | $ 1.763.384 USD ($1000) |
Institutionelt ejerskab og aktionærer
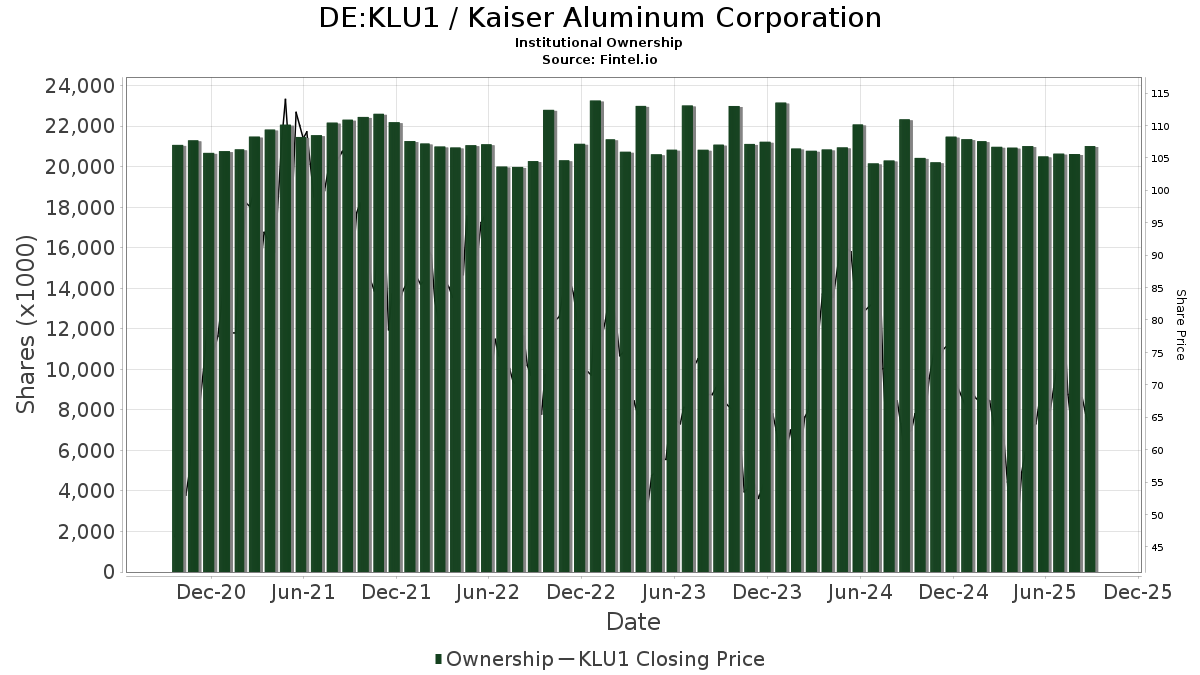
Kaiser Aluminum Corporation (DE:KLU1) har 271 institutionelle ejere og aktionærer, der har indsendt 13D/G- eller 13F-formularer til Securities Exchange Commission (SEC). Disse institutioner har i alt 15,707,766 aktier. Største aktionærer omfatter BlackRock, Inc., Vanguard Group Inc, State Street Corp, Delaware Management Holdings, Inc., Dimensional Fund Advisors Lp, American Century Companies Inc, Barrow Hanley Mewhinney & Strauss Llc, Wellington Management Group Llp, Geode Capital Management, Llc, and Charles Schwab Investment Management Inc .
Kaiser Aluminum Corporation (DB:KLU1) institutionel ejerskabsstruktur viser aktuelle positioner i virksomheden efter institutioner og fonde, samt seneste ændringer i positionsstørrelse. Større aktionærer kan omfatte individuelle investorer, investeringsforeninger, hedgefonde eller institutioner. Skema 13D angiver, at investoren besidder (eller besidder) mere end 5 % af virksomheden og har til hensigt (eller har til hensigt at) aktivt at forfølge en ændring i forretningsstrategi. Skema 13G indikerer en passiv investering på over 5%.
The share price as of April 22, 2026 is 129,00 / share. Previously, on April 28, 2025, the share price was 53,00 / share. This represents an increase of 143,40% over that period.
Fondens stemningsscore
Fund Sentiment Score (fka Ownership Accumulation Score) finder de aktier, der bliver mest købt af fonde. Det er resultatet af en sofistikeret, multi-faktor kvantitativ model, der identificerer virksomheder med de højeste niveauer af institutionel akkumulering. Scoringsmodellen bruger en kombination af den samlede stigning i oplyste ejere, ændringerne i porteføljeallokeringer i disse ejere og andre målinger. Tallet går fra 0 til 100, hvor højere tal indikerer et højere niveau af akkumulering for sine jævnaldrende, og 50 er gennemsnittet.
Opdateringsfrekvens: Dagligt
Se Ownership Explorer, som giver en liste over højest rangerende virksomheder.
AI+ Ask Fintel’s AI assistant about Kaiser Aluminum Corporation.
Select a question to share a public post with an AI-crafted answer.
Thinking of good questions…
13F og NPORT arkivering
Detaljer om 13F-arkivering er gratis. Detaljer om NP-ansøgninger kræver et premium-medlemskab. Grønne rækker angiver nye positioner. Røde rækker angiver lukkede positioner. Klik på linket ikon for at se den fulde transaktionshistorik.
Opgrader
for at låse premium-data op og eksportere til Excel ![]() .
.
| Fil dato | Kilde | Investor | Type | Gennemsnitlig pris (Øst) |
Aktier | Δ Aktier (%) |
Rapporteret Værdi ($1000) |
Δ Værdi (%) |
Port Alloc (%) |
|
|---|---|---|---|---|---|---|---|---|---|---|
| 2026-02-17 | 13F | D. E. Shaw & Co., Inc. | 62.999 | 7.236 | ||||||
| 2026-04-22 | 13F | Pictet Asset Management Holding SA | 2.499 | 19,97 | 301 | 25,94 | ||||
| 2026-02-06 | 13F | Legato Capital Management LLC | 4.266 | 490 | ||||||
| 2026-04-15 | 13F | Trust Point Inc. | 2.566 | 0,94 | 309 | 6,19 | ||||
| 2026-02-06 | 13F | Larson Financial Group LLC | 18 | 0,00 | 2 | 100,00 | ||||
| 2026-02-05 | 13F | Thrivent Financial For Lutherans | 18.394 | -27,51 | 2 | 100,00 | ||||
| 2025-11-14 | 13F | Texas Permanent School Fund | 0 | -100,00 | 0 | |||||
| 2026-02-12 | 13F | Nuveen, LLC | 50.871 | 1,74 | 5.843 | 51,45 | ||||
| 2026-01-13 | 13F | Synergy Financial Management, LLC | 2.467 | 283 | ||||||
| 2026-01-28 | 13F | Arizona State Retirement System | 4.506 | -5,93 | 518 | 40,11 | ||||
| 2026-02-13 | 13F | Toroso Investments, LLC | 0 | -100,00 | 0 | |||||
| 2026-01-12 | 13F | Rialto Wealth Management, LLC | 7 | 0,00 | 1 | |||||
| 2026-04-16 | 13F | Sheets Smith Wealth Management | 5.459 | -0,55 | 658 | 4,29 | ||||
| 2026-02-12 | 13F | Dimensional Fund Advisors Lp | 831.652 | 1,70 | 95.528 | 51,40 | ||||
| 2026-02-06 | 13F | Gsa Capital Partners Llp | 0 | -100,00 | 0 | |||||
| 2026-02-17 | 13F | PDT Partners, LLC | 31.788 | 0,00 | 3.651 | 48,90 | ||||
| 2026-04-21 | 13F | E&G Advisors, LP | 1.800 | 217 | ||||||
| 2026-02-05 | 13F | Allworth Financial LP | 53 | 112,00 | 6 | 500,00 | ||||
| 2026-02-10 | 13F | Hillsdale Investment Management Inc. | 47.100 | 5.410 | ||||||
| 2026-02-12 | 13F | Ankerstar Wealth, LLC | 2 | 0 | ||||||
| 2026-02-13 | 13F | Caxton Associates Llp | 12.958 | 387,88 | 1.488 | 629,41 | ||||
| 2026-02-14 | 13F | Rockefeller Capital Management L.P. | 0 | -100,00 | 0 | |||||
| 2026-04-13 | 13F | IFP Advisors, Inc | 16 | 0,00 | 2 | 0,00 | ||||
| 2026-02-04 | 13F | First Eagle Investment Management, LLC | 146.915 | -4,13 | 16.875 | 42,72 | ||||
| 2026-04-15 | 13F | DAVENPORT & Co LLC | 2.781 | 9,92 | 335 | 15,52 | ||||
| 2026-02-09 | 13F | Kingsview Wealth Management, LLC | 3.550 | 408 | ||||||
| 2026-04-16 | 13F | SG Americas Securities, LLC | 4.241 | -34,49 | 1 | |||||
| 2026-01-28 | 13F | Salomon & Ludwin, LLC | 104 | 67,74 | 13 | 200,00 | ||||
| 2026-01-14 | 13F | ORG Partners LLC | 80 | 0,00 | 9 | 50,00 | ||||
| 2026-02-11 | 13F | Barrow Hanley Mewhinney & Strauss Llc | 564.218 | -26,99 | 64.806 | 8,68 | ||||
| 2026-02-17 | 13F | Royal Bank Of Canada | 11.945 | -59,03 | 1.373 | -38,98 | ||||
| 2026-04-16 | 13F | Diversified Trust Co | 3.467 | 69,62 | 418 | 78,21 | ||||
| 2026-04-15 | 13F | Bright Futures Wealth Management, LLC. | 0 | -100,00 | 0 | |||||
| 2026-02-12 | 13F | Voya Investment Management Llc | 16.792 | 4,50 | 1.929 | 55,61 | ||||
| 2026-02-17 | 13F | Jump Financial, LLC | 6.797 | 5,49 | 781 | 56,94 | ||||
| 2026-02-17 | 13F | Russell Investments Group, Ltd. | 50.407 | 18,17 | 5.790 | 75,90 | ||||
| 2026-02-18 | 13F | First Citizens Bank & Trust Co | 5.215 | 81,83 | 599 | 170,59 | ||||
| 2026-04-27 | 13F | Sound Income Strategies, LLC | 22 | 0,00 | 3 | 0,00 | ||||
| 2026-02-13 | 13F | Ubs Asset Management Americas Inc | 37.003 | 12,40 | 4.250 | 67,32 | ||||
| 2026-04-08 | 13F | Oliver Luxxe Assets LLC | 21.537 | 2.595 | ||||||
| 2026-02-11 | 13F | LPL Financial LLC | 16.571 | -7,27 | 1.903 | 38,10 | ||||
| 2026-02-17 | 13F | Susquehanna International Group, Llp | Call | 7.200 | 827 | |||||
| 2026-01-26 | 13F | Private Trust Co Na | 263 | 24,06 | 30 | 87,50 | ||||
| 2026-02-11 | 13F | ARK Investment Management LLC | 14.877 | 15,21 | 1.709 | 71,49 | ||||
| 2026-02-13 | 13F | Pathstone Holdings, LLC | 1.983 | 228 | ||||||
| 2026-02-17 | 13F | Citadel Advisors Llc | Call | 8.000 | 53,85 | 919 | 128,93 | |||
| 2026-02-17 | 13F | Tower Research Capital LLC (TRC) | 1.831 | 159,72 | 210 | 288,89 | ||||
| 2026-01-30 | 13F | Us Bancorp \de\ | 2.752 | -11,62 | 316 | 31,67 | ||||
| 2026-02-17 | 13F | Citadel Advisors Llc | 32.473 | 3.730 | ||||||
| 2026-02-17 | 13F | Citadel Advisors Llc | Put | 2.200 | -47,62 | 253 | -22,22 | |||
| 2026-02-17 | 13F | Susquehanna International Group, Llp | 41.341 | 4.748 | ||||||
| 2026-02-17 | 13F | XTX Topco Ltd | 5.376 | 617 | ||||||
| 2025-11-14 | 13F | Trexquant Investment LP | 0 | -100,00 | 0 | |||||
| 2026-02-10 | 13F | Intech Investment Management Llc | 8.024 | -88,21 | 922 | -82,47 | ||||
| 2026-02-17 | 13F | Miller Capital Partners, Inc. | 20 | 2 | ||||||
| 2026-02-17 | 13F | MIRAE ASSET GLOBAL ETFS HOLDINGS Ltd. | 7.748 | 1,39 | 891 | 51,10 | ||||
| 2026-01-22 | 13F | Bartlett & Co. Wealth Management Llc | 20 | 0,00 | 2 | 100,00 | ||||
| 2026-02-10 | 13F | State of Wyoming | 3.166 | 283,76 | 364 | 476,19 | ||||
| 2025-11-14 | 13F | Ieq Capital, Llc | 0 | -100,00 | 0 | |||||
| 2026-02-05 | 13F | Cambridge Investment Research Advisors, Inc. | 10.431 | -8,75 | 1 | |||||
| 2026-02-12 | 13F | Brinker Capital Investments, LLC | 11.787 | -8,95 | 1.354 | 35,57 | ||||
| 2026-02-12 | 13F | EntryPoint Capital, LLC | 5.579 | 18,85 | 641 | 76,80 | ||||
| 2026-02-17 | 13F | SageView Advisory Group, LLC | 243 | 28 | ||||||
| 2026-04-24 | 13F | ProShare Advisors LLC | 2.502 | -19,99 | 302 | -16,16 | ||||
| 2026-02-06 | 13F | Kingdom Financial Group LLC. | 1.601 | 184 | ||||||
| 2026-02-13 | 13F | Public Sector Pension Investment Board | 0 | -100,00 | 0 | |||||
| 2026-02-13 | 13F | Bollard Group LLC | 577 | 0,70 | 0 | |||||
| 2026-02-13 | 13F | Edgestream Partners, L.P. | 43.473 | 4.993 | ||||||
| 2026-02-03 | 13F | SBI Securities Co., Ltd. | 102 | 92,45 | 12 | 175,00 | ||||
| 2026-02-09 | 13F | Fisher Asset Management, LLC | 157.078 | 14,00 | 18.042 | 69,70 | ||||
| 2026-02-17 | 13F | Raymond James Financial Inc | 62.555 | 8,18 | 7.185 | 61,06 | ||||
| 2026-02-11 | 13F | CenterBook Partners LP | 3.756 | 431 | ||||||
| 2026-02-17 | 13F | Mercer Global Advisors Inc /adv | 0 | -100,00 | 0 | |||||
| 2026-02-12 | 13F | New York State Common Retirement Fund | 5.635 | 0,00 | 647 | 49,08 | ||||
| 2026-01-29 | 13F | UBS Group AG | 55.941 | -30,60 | 6.425 | 3,31 | ||||
| 2026-02-10 | 13F | Rothschild Investment Llc | 23 | 15,00 | 3 | 100,00 | ||||
| 2026-02-10 | 13F | Bank of New York Mellon Corp | 198.354 | 16,78 | 22.783 | 73,83 | ||||
| 2026-02-12 | 13F | EAM Investors, LLC | 43.017 | 4.941 | ||||||
| 2026-04-07 | 13F | Farther Finance Advisors, LLC | 361 | 31,75 | 47 | 51,61 | ||||
| 2026-02-02 | 13F | Danske Bank A/s | 200 | 0,00 | 23 | 46,67 | ||||
| 2026-02-12 | 13F | Great Lakes Advisors, Llc | 45.364 | 0,00 | 5.211 | 48,86 | ||||
| 2026-02-13 | 13F | Wells Fargo & Company/mn | 44.862 | 12,37 | 5.153 | 67,27 | ||||
| 2025-11-07 | 13F | Putney Financial Group LLC | 0 | -100,00 | 0 | |||||
| 2026-04-16 | 13F | Evolve Private Wealth, Llc | 4.015 | 484 | ||||||
| 2026-02-11 | 13F | Jpmorgan Chase & Co | 46.545 | -41,60 | 5.346 | -13,06 | ||||
| 2026-02-13 | 13F | Arrowstreet Capital, Limited Partnership | 271.749 | 286,36 | 31.213 | 475,14 | ||||
| 2026-02-17 | 13F | Delaware Management Holdings, Inc. | 907.978 | 104.290 | ||||||
| 2026-02-11 | 13F | Los Angeles Capital Management Llc | 4.326 | -1,68 | 383 | 12,98 | ||||
| 2026-02-13 | 13F | Segall Bryant & Hamill, Llc | 12.473 | -0,79 | 1.433 | 47,63 | ||||
| 2025-11-14 | 13F | SummitTX Capital, L.P. | 0 | -100,00 | 0 | |||||
| 2026-01-30 | 13F | Mitsubishi UFJ Trust & Banking Corp | 3.551 | 408 | ||||||
| 2026-02-19 | 13F | Invesco Ltd. | 151.511 | 20,69 | 17.403 | 79,66 | ||||
| 2026-01-28 | 13F | Klp Kapitalforvaltning As | 3.400 | 0,00 | 391 | 48,85 | ||||
| 2026-02-05 | 13F | Bessemer Group Inc | 29.969 | 45.307,58 | 3 | |||||
| 2026-02-17 | 13F | Janus Henderson Group Plc | 6.893 | 0,00 | 792 | 48,87 | ||||
| 2026-01-13 | 13F | Dakota Wealth Management | 4.872 | 560 | ||||||
| 2026-02-13 | 13F | MAI Capital Management | 70 | 8 | ||||||
| 2026-02-10 | 13F | Natixis Advisors, L.p. | 14.383 | 8,22 | 2 | 0,00 | ||||
| 2026-02-17 | 13F | Massar Capital Management, LP | 1.903 | 219 | ||||||
| 2026-04-27 | 13F | Y-Intercept (Hong Kong) Ltd | 14.813 | 1.785 | ||||||
| 2026-02-17 | 13F | Polymer Capital Management (US) LLC | 2.573 | 296 | ||||||
| 2026-02-05 | 13F | High Note Wealth, LLC | 54 | -18,18 | 6 | 20,00 | ||||
| 2026-02-13 | 13F | Mariner, LLC | 2.824 | 5,85 | 327 | 59,02 | ||||
| 2026-02-17 | 13F | Ameriprise Financial Inc | 47.298 | -2,65 | 5.433 | 44,93 | ||||
| 2026-02-09 | 13F | Legal & General Group Plc | 39.287 | 0,92 | 4.513 | 50,25 | ||||
| 2025-11-07 | 13F | Bastion Asset Management Inc. | 0 | -100,00 | 0 | |||||
| 2026-02-12 | 13F | BlackRock, Inc. | 2.997.191 | -0,97 | 344.257 | 47,42 | ||||
| 2026-02-12 | 13F | Principal Securities, Inc. | 0 | -100,00 | 0 | |||||
| 2026-02-13 | 13F | First National Bank Of Omaha | 7.648 | -2,11 | 878 | 45,85 | ||||
| 2026-02-17 | 13F | Harvest Investment Advisors, LLC | 20.369 | 4,73 | 2.340 | 50,51 | ||||
| 2026-02-17 | 13F | Canada Pension Plan Investment Board | 3.300 | 379 | ||||||
| 2026-01-29 | 13F | Vanguard Group Inc | 2.117.791 | 0,28 | 243.249 | 49,27 | ||||
| 2026-02-11 | 13F | Franklin Resources Inc | 4.572 | 14,41 | 525 | 70,45 | ||||
| 2026-02-17 | 13F | Advisor Group Holdings, Inc. | 1.218 | -97,19 | 140 | -95,88 | ||||
| 2026-02-17 | 13F | Jones Financial Companies Lllp | 520 | 0,00 | 60 | 47,50 | ||||
| 2026-04-16 | 13F | Capital Advisors, Ltd. LLC | 133 | 0,00 | 0 | |||||
| 2026-01-23 | 13F | Westside Investment Management, Inc. | 315 | 0,96 | 36 | 50,00 | ||||
| 2026-01-20 | 13F | Harbor Capital Advisors, Inc. | 29 | -3,33 | 0 | |||||
| 2026-04-22 | 13F | Janney Montgomery Scott LLC | 0 | -100,00 | 0 | |||||
| 2026-02-12 | 13F | Triumph Capital Management | 100 | 0,00 | 11 | 57,14 | ||||
| 2026-03-06 | 13F | Hsbc Holdings Plc | 11.803 | -19,02 | 1.360 | 21,45 | ||||
| 2026-01-09 | 13F | 180 Wealth Advisors, Llc | 10.149 | -0,67 | 1.166 | 47,84 | ||||
| 2026-02-02 | 13F | Horizon Investments, LLC | 5.777 | 664 | ||||||
| 2026-02-06 | 13F | Global Retirement Partners, LLC | 366 | 408,33 | 42 | 740,00 | ||||
| 2026-04-24 | 13F | Yousif Capital Management, Llc | 4.256 | -1,80 | 513 | -7,25 | ||||
| 2026-02-04 | 13F | Oregon Public Employees Retirement Fund | 3.642 | 0,00 | 418 | 48,75 | ||||
| 2026-03-27 | 13F | Prosperity Wealth Management, Inc. | 7.700 | 884 | ||||||
| 2025-11-13 | 13F | C M Bidwell & Associates Ltd | 0 | -100,00 | 0 | |||||
| 2026-02-13 | 13F | Citigroup Inc | 11.514 | -66,58 | 1.322 | -50,26 | ||||
| 2026-02-11 | 13F | Meeder Asset Management Inc | 5.897 | 76,29 | 677 | 162,40 | ||||
| 2026-02-09 | 13F | Hartland & Co., LLC | 400 | 0,00 | 46 | 50,00 | ||||
| 2026-02-12 | 13F | Advisors Asset Management, Inc. | 5.008 | -85,47 | 575 | -78,38 | ||||
| 2026-02-13 | 13F | Caitong International Asset Management Co., Ltd | 110 | 13 | ||||||
| 2026-02-17 | 13F | Wellington Management Group Llp | 481.602 | -4,15 | 55.317 | 42,68 | ||||
| 2026-02-09 | 13F | Hantz Financial Services, Inc. | 386 | 3,21 | 0 | |||||
| 2026-02-13 | 13F | Charles Schwab Investment Management Inc | 289.778 | -1,71 | 33.284 | 46,31 | ||||
| 2026-02-12 | 13F | Pitcairn Co | 0 | -100,00 | 0 | -100,00 | ||||
| 2026-02-17 | 13F | Man Group plc | 15.057 | -33,68 | 1.729 | -1,26 | ||||
| 2026-02-09 | 13F | Systematic Financial Management Lp | 258.210 | -2,19 | 29.658 | 45,60 | ||||
| 2026-01-30 | 13F | AMG National Trust Bank | 12.999 | 1.493 | ||||||
| 2026-03-12 | 13F/A | Peak6 Llc | Call | 40.000 | 4.594 | |||||
| 2026-01-30 | 13F | Torren Management, LLC | 5 | 1 | ||||||
| 2026-02-17 | 13F | Cetera Investment Advisers | 2.633 | 302 | ||||||
| 2026-04-20 | 13F | Ronald Blue Trust, Inc. | 17 | 0,00 | 2 | 100,00 | ||||
| 2026-02-02 | 13F | Qrg Capital Management, Inc. | 1.834 | 211 | ||||||
| 2026-02-09 | 13F | Geode Capital Management, Llc | 393.529 | -1,42 | 45.209 | 46,76 | ||||
| 2026-02-17 | 13F | Price T Rowe Associates Inc /md/ | 15.712 | 9,37 | 2 | 0,00 | ||||
| 2026-02-11 | 13F | Simplex Trading, Llc | Call | 0 | -100,00 | 0 | ||||
| 2026-02-17 | 13F | Bridgeway Capital Management Inc | 125.386 | 4,55 | 14.402 | 55,64 | ||||
| 2026-02-17 | 13F | Mangrove Partners | 5.269 | 605 | ||||||
| 2026-02-13 | 13F | Walleye Trading LLC | 0 | -100,00 | 0 | |||||
| 2025-11-13 | 13F | Chesapeake Capital Corp /il/ | 0 | -100,00 | 0 | |||||
| 2026-02-11 | 13F | Simplex Trading, Llc | Put | 700 | -56,25 | 80 | ||||
| 2026-02-13 | 13F | Walleye Trading LLC | Put | 0 | -100,00 | 0 | ||||
| 2026-02-17 | 13F | Millennium Management Llc | 38.869 | 84,12 | 4.464 | 174,20 | ||||
| 2026-02-11 | 13F | Simplex Trading, Llc | 7.520 | 1.360,19 | 864 | |||||
| 2026-02-13 | 13F | Walleye Trading LLC | Call | 0 | -100,00 | 0 | ||||
| 2026-02-17 | 13F | Guggenheim Capital Llc | 7.008 | -1,13 | 805 | 47,25 | ||||
| 2026-04-20 | 13F | Louisiana State Employees Retirement System | 7.100 | -4,05 | 856 | 0,71 | ||||
| 2026-02-04 | 13F | Bailard, Inc. | 2.798 | 321 | ||||||
| 2026-02-10 | 13F | Goldman Sachs Group Inc | 179.781 | 111,74 | 20.650 | 215,20 | ||||
| 2026-02-13 | 13F | Prudential Financial Inc | 27.085 | 9,98 | 3.111 | 63,68 | ||||
| 2026-02-09 | 13F | Huntington National Bank | 976 | -0,31 | 112 | 49,33 | ||||
| 2026-02-18 | 13F | Mackenzie Financial Corp | 17.204 | 2.028 | ||||||
| 2026-04-13 | 13F | True Wealth Design, LLC | 2 | 0,00 | 0 | |||||
| 2026-04-06 | 13F | Versant Capital Management, Inc | 7 | 250,00 | 1 | |||||
| 2026-02-12 | 13F | CIBC Private Wealth Group, LLC | 4 | 0 | ||||||
| 2026-02-05 | 13F | Gamco Investors, Inc. Et Al | 8.434 | -0,51 | 969 | 48,01 | ||||
| 2026-02-13 | 13F | SRS Capital Advisors, Inc. | 141 | -87,57 | 16 | -81,61 | ||||
| 2026-02-11 | 13F | Group One Trading, L.p. | Call | 100 | 11 | |||||
| 2026-02-12 | 13F | Commonwealth Equity Services, Llc | 3.916 | 1,98 | 450 | |||||
| 2026-02-10 | 13F | Iat Reinsurance Co Ltd. | 70 | 0,00 | 8 | 60,00 | ||||
| 2026-02-12 | 13F | Skopos Labs, Inc. | 4.331 | 511 | ||||||
| 2026-02-12 | 13F | Jane Street Group, Llc | Call | 6.700 | 770 | |||||
| 2026-02-12 | 13F | Jane Street Group, Llc | 49.972 | 237,10 | 5.740 | 402,10 | ||||
| 2026-02-13 | 13F | Parkside Financial Bank & Trust | 3 | 0,00 | 0 | |||||
| 2026-01-27 | 13F | First Horizon Corp | 774 | 120,51 | 89 | 225,93 | ||||
| 2026-02-12 | 13F | MetLife Investment Management, LLC | 9.083 | -4,85 | 1.043 | 41,71 | ||||
| 2026-02-12 | 13F | Jane Street Group, Llc | Put | 2.800 | 322 | |||||
| 2026-04-24 | 13F | Deprince Race & Zollo Inc | 14.742 | -68,79 | 1.777 | -67,26 | ||||
| 2025-11-14 | 13F | ExodusPoint Capital Management, LP | 0 | -100,00 | 0 | |||||
| 2026-04-27 | 13F | Ethic Inc. | 3.350 | 31,22 | 404 | 37,54 | ||||
| 2026-02-13 | 13F | Public Employees Retirement Association Of Colorado | 2.119 | 0,00 | 0 | |||||
| 2026-02-13 | 13F | Icon Advisers Inc/co | 66.482 | -40,32 | 7.636 | -11,15 | ||||
| 2026-02-17 | 13F | Amundi | 2.226 | -26,51 | 256 | 10,39 | ||||
| 2026-04-09 | 13F | Vista Investment Partners Llc | 5.105 | 0,00 | 615 | 4,95 | ||||
| 2026-01-28 | 13F | WPG Advisers, LLC | 3 | 0,00 | 0 | |||||
| 2026-02-13 | 13F | Pinnacle Wealth Planning Services, Inc. | 423 | 49 | ||||||
| 2026-01-29 | 13F | Ashton Thomas Private Wealth, LLC | 2.537 | 291 | ||||||
| 2026-02-12 | 13F | Steward Partners Investment Advisory, Llc | 0 | -100,00 | 0 | |||||
| 2026-04-08 | 13F | Heritage Family Offices, LLP | 1.876 | -40,86 | 226 | -37,91 | ||||
| 2026-02-10 | 13F | Bnp Paribas Arbitrage, Sa | 26.066 | 378,98 | 2.994 | 614,32 | ||||
| 2026-04-20 | 13F | State of Alaska, Department of Revenue | 8.566 | -3,12 | 1 | 0,00 | ||||
| 2026-04-22 | 13F | Sterling Capital Management LLC | 308 | -92,18 | 37 | -91,81 | ||||
| 2026-01-29 | 13F | Comerica Bank | 5.701 | -10,47 | 655 | 33,20 | ||||
| 2026-02-17 | 13F | Fmr Llc | 10.933 | 944,22 | 1.256 | 1.468,75 | ||||
| 2026-02-17 | 13F | Northern Trust Corp | 170.104 | -5,19 | 19.538 | 41,13 | ||||
| 2026-02-17 | 13F | Aristeia Capital Llc | 0 | -100,00 | 0 | |||||
| 2026-02-04 | 13F | Versor Investments LP | 6.734 | -0,97 | 773 | 47,52 | ||||
| 2026-02-13 | 13F | Marshall Wace, Llp | 34.225 | 3.931 | ||||||
| 2026-02-13 | 13F | Smartleaf Asset Management LLC | 7 | 1 | ||||||
| 2026-04-14 | 13F | USA Financial Portformulas Corp | 616 | 74 | ||||||
| 2026-02-13 | 13F | Brightline Capital Management, Llc | 168.000 | 19.296 | ||||||
| 2026-01-29 | 13F | Teachers Retirement System Of The State Of Kentucky | 4.044 | -11,18 | 0 | |||||
| 2026-02-17 | 13F | Hotchkis & Wiley Capital Management Llc | 149.470 | -12,04 | 17.168 | 30,94 | ||||
| 2026-02-17 | 13F | Public Employees Retirement System Of Ohio | 544 | -5,56 | 62 | 40,91 | ||||
| 2025-10-30 | 13F | TrueMark Investments, LLC | 0 | -100,00 | 0 | -100,00 | ||||
| 2026-02-13 | 13F | Panagora Asset Management Inc | 29.047 | 664,19 | 3.336 | 1.038,57 | ||||
| 2025-11-12 | 13F | Aster Capital Management (DIFC) Ltd | 0 | -100,00 | 0 | |||||
| 2026-02-06 | 13F | Bare Financial Services, Inc | 7 | 1 | ||||||
| 2026-01-28 | 13F | Universal- Beteiligungs- und Servicegesellschaft mbH | 23.843 | -4,82 | 2.748 | 42,24 | ||||
| 2026-02-10 | 13F | Norges Bank | 16.469 | 1.892 | ||||||
| 2026-02-13 | 13F | Squarepoint Ops LLC | 38.356 | 4.406 | ||||||
| 2026-02-10 | 13F | Commonwealth Of Pennsylvania Public School Empls Retrmt Sys | 3.975 | -2,62 | 457 | 45,22 | ||||
| 2026-02-13 | 13F | State Street Corp | 966.148 | -16,20 | 110.972 | 24,74 | ||||
| 2026-04-13 | 13F | Salem Investment Counselors Inc | 500 | 60 | ||||||
| 2026-02-12 | 13F | Renaissance Technologies Llc | 7.300 | 14,06 | 838 | 69,98 | ||||
| 2026-02-13 | 13F | Victory Capital Management Inc | 9.896 | -70,51 | 1.137 | -56,12 | ||||
| 2025-10-30 | 13F | Twin Peaks Wealth Advisors, LLC | 0 | -100,00 | 0 | |||||
| 2026-04-07 | 13F | Carolina Wealth Advisors, LLC | 94 | 11 | ||||||
| 2026-02-05 | 13F | Gabelli Funds Llc | 38.838 | -6,72 | 4.461 | 38,85 | ||||
| 2026-04-23 | 13F | CWM Advisors, LLC | 892 | -91,99 | 108 | -91,63 | ||||
| 2026-04-23 | 13F | Farmers & Merchants Investments Inc | 10 | -16,67 | 1 | 0,00 | ||||
| 2026-02-12 | 13F | Swiss National Bank | 31.900 | 1,92 | 3.664 | 51,72 | ||||
| 2026-02-12 | 13F | DRW Securities, LLC | 0 | -100,00 | 0 | |||||
| 2026-02-13 | 13F | American Century Companies Inc | 593.086 | 0,74 | 68.122 | 49,96 | ||||
| 2026-04-06 | 13F | GAMMA Investing LLC | 715 | 13,49 | 86 | 19,44 | ||||
| 2026-02-02 | 13F | Fifth Third Bancorp | 76 | -10,59 | 9 | 33,33 | ||||
| 2026-04-16 | 13F | Tactive Advisors, LLC | 2.744 | 331 | ||||||
| 2026-04-27 | 13F | New York State Teachers Retirement System | 5.420 | -5,98 | 1 | |||||
| 2026-02-02 | 13F | Winslow Asset Management Inc | 75.789 | -0,11 | 9 | 60,00 | ||||
| 2026-02-17 | 13F | Maryland State Retirement & Pension System | 2.332 | 268 | ||||||
| 2026-02-17 | 13F | Sherbrooke Park Advisers Llc | 0 | -100,00 | 0 | |||||
| 2026-02-13 | 13F | Mml Investors Services, Llc | 3.044 | 350 | ||||||
| 2026-04-22 | 13F | 1492 Capital Management LLC | 43.461 | 11,60 | 5.237 | 17,11 | ||||
| 2026-02-17 | 13F | Hancock Whitney Corp | 2.550 | 293 | ||||||
| 2026-04-21 | 13F | Gilpin Wealth Management, Llc | 3 | 200,00 | 0 | |||||
| 2026-02-03 | 13F | International Assets Investment Management, Llc | 13 | 1 | ||||||
| 2026-02-18 | 13F | State of Tennessee, Treasury Department | 11.747 | 52,40 | 1.440 | 142,42 | ||||
| 2026-02-13 | 13F | Manufacturers Life Insurance Company, The | 0 | -100,00 | 0 | |||||
| 2026-01-30 | 13F | Pvg Asset Management Corp | 1.939 | 223 | ||||||
| 2026-02-13 | 13F | Sei Investments Co | 39.469 | 123,80 | 4.533 | 233,31 | ||||
| 2026-02-13 | 13F | Macquarie Group Ltd | 0 | -100,00 | 0 | |||||
| 2026-02-17 | 13F | Engineers Gate Manager LP | 12.224 | 1.404 | ||||||
| 2026-04-24 | 13F | Profund Advisors Llc | 0 | -100,00 | 0 | |||||
| 2026-02-17 | 13F | Advisory Services Network, LLC | 0 | -100,00 | 0 | |||||
| 2026-04-07 | 13F | Retirement Wealth Solutions LLC | 11 | 22,22 | 1 | 0,00 | ||||
| 2026-04-07 | 13F | Signaturefd, Llc | 60 | 76,47 | 7 | 133,33 | ||||
| 2026-04-07 | 13F | Central Pacific Bank - Trust Division | 4.274 | 0,00 | 515 | 5,10 | ||||
| 2026-02-13 | 13F | First Trust Advisors Lp | 38.552 | 56,38 | 4.428 | 132,81 | ||||
| 2026-02-17 | 13F | Graham Capital Management, L.P. | 0 | -100,00 | 0 | |||||
| 2026-04-27 | 13F | Moran Wealth Management, LLC | 1.776 | 214 | ||||||
| 2025-11-17 | 13F | Jacobs Levy Equity Management, Inc | 0 | -100,00 | 0 | -100,00 | ||||
| 2026-02-13 | 13F | Healthcare Of Ontario Pension Plan Trust Fund | 10.172 | 1.168 | ||||||
| 2026-02-17 | 13F | Aqr Capital Management Llc | 19.642 | 0,65 | 2.256 | 49,90 | ||||
| 2026-02-09 | 13F | Atlantic Trust, LLC | 0 | -100,00 | 0 | |||||
| 2026-02-13 | 13F | Barclays Plc | 28.758 | 11,51 | 3.303 | 66,06 | ||||
| 2026-02-09 | 13F | Jackson Creek Investment Advisors LLC | 23.860 | -3,35 | 3 | 100,00 | ||||
| 2026-02-10 | 13F | Envestnet Asset Management Inc | 63.491 | -4,48 | 7.293 | 42,20 | ||||
| 2026-02-17 | 13F | California State Teachers Retirement System | 16.303 | -0,09 | 1.873 | 48,69 | ||||
| 2026-02-11 | 13F | Ameritas Investment Partners, Inc. | 1.344 | 154 | ||||||
| 2026-02-13 | 13F | Umb Bank N A/mo | 287 | 17,14 | 33 | 77,78 | ||||
| 2026-01-27 | 13F | Tributary Capital Management, LLC | 232.880 | -6,93 | 26.749 | 38,55 | ||||
| 2026-02-17 | 13F | Bank Of America Corp /de/ | 169.861 | -2,69 | 19.510 | 44,86 | ||||
| 2026-02-17 | 13F | Algert Global Llc | 68.008 | 48,37 | 8 | 133,33 | ||||
| 2025-11-12 | 13F | Group One Trading, L.p. | Put | 0 | -100,00 | 0 | -100,00 | |||
| 2026-02-06 | 13F | Tortoise Investment Management, LLC | 0 | -100,00 | 0 | |||||
| 2026-02-13 | 13F | Quarry LP | 107 | 101,89 | 12 | 200,00 | ||||
| 2026-01-29 | 13F | Cornerstone Investment Partners, LLC | 1.916 | 220 | ||||||
| 2026-02-13 | 13F | Great West Life Assurance Co /can/ | 44.367 | 211,00 | 5 | 400,00 | ||||
| 2025-11-12 | 13F | Group One Trading, L.p. | 0 | -100,00 | 0 | -100,00 | ||||
| 2026-02-06 | 13F | Covestor Ltd | 5.844 | 584.300,00 | 1 | |||||
| 2026-02-17 | 13F | Quantinno Capital Management LP | 3.634 | 11,82 | 417 | 66,80 | ||||
| 2026-01-15 | 13F | Allspring Global Investments Holdings, LLC | 41.712 | 5.018 | ||||||
| 2026-02-10 | 13F | Quantbot Technologies LP | 2.969 | 1.586,93 | 341 | 2.523,08 | ||||
| 2026-01-26 | 13F | Cwm, Llc | 1.334 | 2,69 | 0 | |||||
| 2026-02-12 | 13F | Bank Of Montreal /can/ | 11.591 | 15,71 | 1.331 | 72,41 | ||||
| 2026-02-11 | 13F | Cookson Peirce & Co Inc | 10.002 | 1.149 | ||||||
| 2026-02-17 | 13F/A | Uniplan Investment Counsel, Inc. | 47 | 5 | ||||||
| 2026-02-09 | 13F | Employees Retirement System of Texas | 1.012 | 0 | ||||||
| 2026-02-17 | 13F | Point72 Asset Management, L.P. | 29.836 | 3.427 | ||||||
| 2026-01-27 | 13F | Zurcher Kantonalbank (Zurich Cantonalbank) | 2.756 | 0,00 | 317 | 49,06 | ||||
| 2026-02-12 | 13F | Scotia Capital Inc. | 2.377 | 273 | ||||||
| 2026-02-12 | 13F | Third Avenue Management Llc | 0 | -100,00 | 0 | |||||
| 2026-02-17 | 13F | Optiver Holding B.V. | 8 | -89,19 | 1 | -100,00 | ||||
| 2026-02-13 | 13F | Nfj Investment Group, Llc | 123.336 | -3,34 | 14.166 | 43,89 | ||||
| 2026-02-13 | 13F | Morgan Stanley | 210.182 | 2,25 | 24.142 | 52,20 | ||||
| 2026-02-17 | 13F | Creative Planning | 6.134 | 31,07 | 705 | 95,01 | ||||
| 2026-02-09 | 13F | Quest Partners LLC | 2.286 | -89,82 | 263 | -84,87 | ||||
| 2026-02-11 | 13F | Prestige Wealth Management Group LLC | 17 | 0,00 | 2 | 0,00 | ||||
| 2026-02-11 | 13F | Deutsche Bank Ag\ | 12.479 | 9,11 | 1.433 | 62,47 | ||||
| 2026-02-17 | 13F | Summit Global Investments | 13.274 | 148,25 | 2 | |||||
| 2026-02-06 | 13F | Envestnet Portfolio Solutions, Inc. | 6.363 | 52,22 | 731 | 126,71 | ||||
| 2026-01-15 | 13F | Nisa Investment Advisors, Llc | 4.761 | 1,47 | 547 | 50,83 | ||||
| 2026-02-13 | 13F | Verition Fund Management LLC | 13.440 | 174,45 | 1.544 | 309,28 | ||||
| 2026-02-17 | 13F | Quadrature Capital Ltd | 5.959 | 684 | ||||||
| 2026-02-13 | 13F | Kestra Advisory Services, LLC | 591 | 68 | ||||||
| 2026-02-17 | 13F | Alliancebernstein L.p. | 18.469 | 0,00 | 2.121 | 48,84 | ||||
| 2026-02-17 | 13F | Silvercrest Asset Management Group Llc | 3.640 | 0,00 | 418 | 49,29 | ||||
| 2026-02-13 | 13F | Police & Firemen's Retirement System of New Jersey | 4.444 | 0,00 | 510 | 49,12 | ||||
| 2026-02-06 | 13F | GPS Wealth Strategies Group, LLC | 0 | -100,00 | 0 | |||||
| 2026-02-06 | 13F | EverSource Wealth Advisors, LLC | 471 | 18,34 | 54 | 80,00 | ||||
| 2026-02-10 | 13F | Mutual Of America Capital Management Llc | 1.835 | 211 | ||||||
| 2026-02-12 | 13F | Brown Brothers Harriman & Co | 68 | 8 | ||||||
| 2026-02-17 | 13F | Brevan Howard Capital Management LP | 5.689 | 653 | ||||||
| 2026-02-02 | 13F | Principal Financial Group Inc | 76.657 | -1,01 | 8.805 | 47,35 | ||||
| 2026-02-12 | 13F | Integrated Quantitative Investments LLC | 4.266 | 490 | ||||||
| 2026-02-13 | 13F | BNP Paribas Asset Management Holding S.A. | 273 | 30,62 | 0 | |||||
| 2026-02-11 | 13F | Empowered Funds, LLC | 73.952 | 7,97 | 8.494 | 60,75 | ||||
| 2026-02-05 | 13F | Stephens Inc /ar/ | 0 | -100,00 | 0 | |||||
| 2026-02-06 | 13F | Pnc Financial Services Group, Inc. | 3.514 | -4,74 | 404 | 41,90 | ||||
| 2026-02-11 | 13F | Parallel Advisors, LLC | 235 | -1,67 | 27 | 50,00 | ||||
| 2026-02-05 | 13F | Amalgamated Bank | 4.658 | -1,42 | 1 | |||||
| 2026-01-28 | 13F | Teacher Retirement System Of Texas | 9.900 | -28,99 | 1.137 | 5,77 | ||||
| 2026-02-12 | 13F | Quadrant Capital Group Llc | 199 | 17,06 | 23 | 69,23 | ||||
| 2026-02-13 | 13F | Rhumbline Advisers | 47.566 | -5,52 | 5.463 | 40,65 | ||||
| 2026-02-10 | 13F | Acadian Asset Management Llc | 11.918 | 1 | ||||||
| 2026-02-17 | 13F | Numerai GP LLC | 6.317 | 726 | ||||||
| 2026-02-11 | 13F | Illinois Municipal Retirement Fund | 7.843 | -9,47 | 901 | 34,73 |
Other Listings
| US:KALU | 177,86 $ |