Grundlæggende statistik
| Institutionelle aktier (lange) | 55.489.898 - 89,90% (ex 13D/G) - change of 9,19MM shares 19,84% MRQ |
| Institutionel værdi (lang) | $ 1.498.682 USD ($1000) |
Institutionelt ejerskab og aktionærer
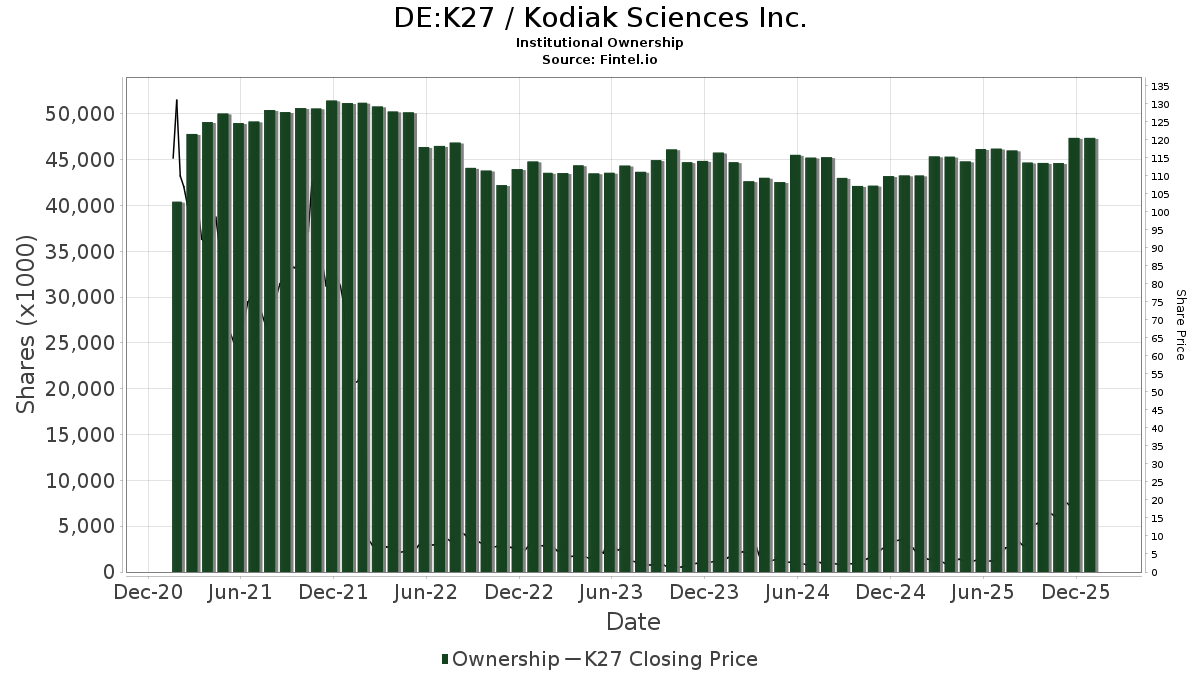
Kodiak Sciences Inc. (DE:K27) har 161 institutionelle ejere og aktionærer, der har indsendt 13D/G- eller 13F-formularer til Securities Exchange Commission (SEC). Disse institutioner har i alt 55,489,898 aktier. Største aktionærer omfatter Baker Bros. Advisors Lp, BlackRock, Inc., Vanguard Group Inc, Point72 Asset Management, L.P., Braidwell Lp, State Street Corp, Rtw Investments, Lp, Goldman Sachs Group Inc, ICONIQ Capital, LLC, and Price T Rowe Associates Inc /md/ .
Kodiak Sciences Inc. (DB:K27) institutionel ejerskabsstruktur viser aktuelle positioner i virksomheden efter institutioner og fonde, samt seneste ændringer i positionsstørrelse. Større aktionærer kan omfatte individuelle investorer, investeringsforeninger, hedgefonde eller institutioner. Skema 13D angiver, at investoren besidder (eller besidder) mere end 5 % af virksomheden og har til hensigt (eller har til hensigt at) aktivt at forfølge en ændring i forretningsstrategi. Skema 13G indikerer en passiv investering på over 5%.
The share price as of April 24, 2026 is 38,40 / share. Previously, on April 28, 2025, the share price was 3,57 / share. This represents an increase of 974,43% over that period.
Fondens stemningsscore
Fund Sentiment Score (fka Ownership Accumulation Score) finder de aktier, der bliver mest købt af fonde. Det er resultatet af en sofistikeret, multi-faktor kvantitativ model, der identificerer virksomheder med de højeste niveauer af institutionel akkumulering. Scoringsmodellen bruger en kombination af den samlede stigning i oplyste ejere, ændringerne i porteføljeallokeringer i disse ejere og andre målinger. Tallet går fra 0 til 100, hvor højere tal indikerer et højere niveau af akkumulering for sine jævnaldrende, og 50 er gennemsnittet.
Opdateringsfrekvens: Dagligt
Se Ownership Explorer, som giver en liste over højest rangerende virksomheder.
AI+ Ask Fintel’s AI assistant about Kodiak Sciences Inc..
Select a question to share a public post with an AI-crafted answer.
Thinking of good questions…
13F og NPORT arkivering
Detaljer om 13F-arkivering er gratis. Detaljer om NP-ansøgninger kræver et premium-medlemskab. Grønne rækker angiver nye positioner. Røde rækker angiver lukkede positioner. Klik på linket ikon for at se den fulde transaktionshistorik.
Opgrader
for at låse premium-data op og eksportere til Excel ![]() .
.
| Fil dato | Kilde | Investor | Type | Gennemsnitlig pris (Øst) |
Aktier | Δ Aktier (%) |
Rapporteret Værdi ($1000) |
Δ Værdi (%) |
Port Alloc (%) |
|
|---|---|---|---|---|---|---|---|---|---|---|
| 2026-02-12 | 13F | Skopos Labs, Inc. | 10.627 | -81,53 | 306 | 44,34 | ||||
| 2026-02-17 | 13F | Royal Bank Of Canada | 8.745 | -95,65 | 245 | -92,55 | ||||
| 2026-04-13 | 13F | IFP Advisors, Inc | 6 | 0,00 | 0 | |||||
| 2026-02-10 | 13F | Belvedere Trading LLC | Call | 200 | 6 | |||||
| 2026-02-10 | 13F | Belvedere Trading LLC | 8.037 | 225 | ||||||
| 2026-02-02 | 13F | RIA Advisory Group LLC | Call | 0 | -100,00 | 0 | -100,00 | |||
| 2026-02-10 | 13F | Belvedere Trading LLC | Put | 200 | 6 | |||||
| 2026-02-12 | 13F | New York State Common Retirement Fund | 67.260 | 4.023,85 | 1.881 | 7.130,77 | ||||
| 2026-02-17 | 13F | T. Rowe Price Investment Management, Inc. | 13.201 | 0 | ||||||
| 2026-02-10 | 13F | Bank of New York Mellon Corp | 102.713 | -1,67 | 2.872 | 67,99 | ||||
| 2026-04-06 | 13F | GAMMA Investing LLC | 836 | 18,08 | 32 | 63,16 | ||||
| 2026-02-05 | 13F | Cambridge Investment Research Advisors, Inc. | 9.600 | 0 | ||||||
| 2026-02-02 | 13F | Cornerstone Planning Group LLC | 210 | 0,00 | 5 | 25,00 | ||||
| 2026-02-11 | 13F | LPL Financial LLC | 18.399 | 514 | ||||||
| 2026-02-06 | 13F | EverSource Wealth Advisors, LLC | 991 | 1.221,33 | 28 | 2.600,00 | ||||
| 2026-02-17 | 13F | Advisor Group Holdings, Inc. | 83.421 | 726,03 | 2.332 | 1.454,67 | ||||
| 2025-10-29 | 13F | LJI Wealth Management, LLC | 0 | -100,00 | 0 | |||||
| 2026-04-24 | 13F | Strs Ohio | 3.100 | 0,00 | 118 | 37,21 | ||||
| 2026-04-16 | 13F | Diversified Trust Co | 0 | -100,00 | 0 | |||||
| 2026-02-05 | 13F | Allworth Financial LP | 354 | 17.600,00 | 10 | |||||
| 2026-02-13 | 13F | Morgan Stanley | 699.772 | 8,06 | 19.566 | 84,58 | ||||
| 2026-02-17 | 13F | Braidwell Lp | 2.072.788 | 57.955 | ||||||
| 2026-02-17 | 13F | MIRAE ASSET GLOBAL ETFS HOLDINGS Ltd. | 18.666 | 24,86 | 522 | 113,52 | ||||
| 2026-02-17 | 13F | XTX Topco Ltd | 0 | -100,00 | 0 | |||||
| 2026-02-17 | 13F | Tower Research Capital LLC (TRC) | 435 | -84,56 | 12 | -73,91 | ||||
| 2026-02-13 | 13F | Rafferty Asset Management, LLC | 59.520 | 1.664 | ||||||
| 2026-02-17 | 13F | Boxer Capital Management, LLC | 1.136.000 | 51,47 | 31.763 | 158,71 | ||||
| 2025-11-14 | 13F | Millennium Management Llc | Call | 0 | -100,00 | 0 | -100,00 | |||
| 2026-02-17 | 13F | Diadema Partners Lp | Put | 0 | -100,00 | 0 | ||||
| 2026-02-17 | 13F | Persistent Asset Partners Ltd | Call | 80 | 25,00 | 182 | 167,65 | |||
| 2026-02-13 | 13F | MAI Capital Management | 5 | 0 | ||||||
| 2026-02-13 | 13F | Caitong International Asset Management Co., Ltd | 0 | -100,00 | 0 | |||||
| 2026-02-12 | 13F | Federated Hermes, Inc. | 244.231 | 0,00 | 6.829 | 70,79 | ||||
| 2026-02-13 | 13F | Wells Fargo & Company/mn | 92.143 | 248,78 | 2.576 | 496,30 | ||||
| 2026-02-13 | 13F | Headlands Technologies LLC | 16.278 | -45,26 | 455 | -6,38 | ||||
| 2026-04-17 | 13F | PSP Research LLC | 10.000 | -48,50 | 381 | -29,70 | ||||
| 2026-02-19 | 13F | Invesco Ltd. | 555.073 | 454,08 | 15.520 | 846,86 | ||||
| 2025-11-14 | 13F | Squarepoint Ops LLC | 0 | -100,00 | 0 | |||||
| 2026-04-13 | 13F | E Fund Management Co., Ltd. | 8.989 | 723,92 | 343 | 175,81 | ||||
| 2026-02-11 | 13F | Franklin Resources Inc | 19.529 | 546 | ||||||
| 2026-02-13 | 13F | Jacobs Levy Equity Management, Inc | 127.230 | -22,99 | 3.557 | 31,55 | ||||
| 2026-04-07 | 13F | Farther Finance Advisors, LLC | 758 | -33,33 | 32 | 3,23 | ||||
| 2026-02-17 | 13F | Creative Planning | 10.787 | 302 | ||||||
| 2026-02-17 | 13F | Two Sigma Advisers, Lp | 103.100 | -50,76 | 2.883 | -15,90 | ||||
| 2026-02-11 | 13F | Los Angeles Capital Management Llc | 182 | 4 | ||||||
| 2026-02-17 | 13F | Persistent Asset Partners Ltd | Put | 0 | -100,00 | 0 | ||||
| 2026-02-11 | 13F | Group One Trading, L.p. | Put | 1.800 | -76,62 | 50 | -60,32 | |||
| 2026-02-11 | 13F | Group One Trading, L.p. | Call | 23.000 | -74,07 | 643 | -55,72 | |||
| 2026-01-30 | 13F | Us Bancorp \de\ | 1.934 | 5,05 | 54 | 80,00 | ||||
| 2026-02-12 | 13F | BlackRock, Inc. | 3.954.603 | 33,95 | 110.571 | 128,78 | ||||
| 2026-02-11 | 13F | Group One Trading, L.p. | 3.852 | 108 | ||||||
| 2026-02-17 | 13F | Jones Financial Companies Lllp | 420 | -26,96 | 12 | 22,22 | ||||
| 2026-02-11 | 13F | Jpmorgan Chase & Co | 17.905 | 35,71 | 501 | 132,56 | ||||
| 2026-02-04 | 13F | Ameritas Advisory Services, LLC | 0 | -100,00 | 0 | |||||
| 2026-02-17 | 13F | Balyasny Asset Management Llc | 263.278 | 1.607,49 | 7.361 | 2.821,03 | ||||
| 2026-02-17 | 13F | Optiver Holding B.V. | 0 | -100,00 | 0 | |||||
| 2026-02-10 | 13F | Intech Investment Management Llc | 13.939 | 390 | ||||||
| 2025-11-14 | 13F | Point72 (DIFC) Ltd | 2.516 | 41 | ||||||
| 2026-01-26 | 13F | Cwm, Llc | 3.135 | 5,03 | 0 | |||||
| 2026-02-09 | 13F | Legal & General Group Plc | 2.918 | 6,22 | 82 | 84,09 | ||||
| 2026-02-17 | 13F | Canada Pension Plan Investment Board | 2.300 | 64 | ||||||
| 2026-02-17 | 13F | Janus Henderson Group Plc | 1.000.000 | 27.950 | ||||||
| 2026-02-17 | 13F | Fred Alger Management, Llc | 0 | -100,00 | 0 | |||||
| 2026-02-13 | 13F | Citigroup Inc | 16.617 | 93,81 | 465 | 231,43 | ||||
| 2026-02-17 | 13F | Ameriprise Financial Inc | 19.896 | -59,27 | 556 | -30,41 | ||||
| 2026-02-09 | 13F | Jefferies Financial Group Inc. | 13.134 | 367 | ||||||
| 2026-02-17 | 13F | Millennium Management Llc | 60.621 | -60,95 | 1.695 | -33,33 | ||||
| 2026-02-17 | 13F | State Of Wisconsin Investment Board | 36.775 | -13,85 | 1.028 | 47,28 | ||||
| 2026-02-17 | 13F | Diadema Partners Lp | Call | 29.600 | 6,47 | 828 | 81,76 | |||
| 2026-02-06 | 13F | ProShare Advisors LLC | 8.330 | 233 | ||||||
| 2025-11-13 | 13F | Hsbc Holdings Plc | 0 | -100,00 | 0 | -100,00 | ||||
| 2026-02-11 | 13F | Simplex Trading, Llc | Call | 2.300 | -34,29 | 64 | ||||
| 2026-02-17 | 13F | Trexquant Investment LP | 190.505 | 303,14 | 5.327 | 589,00 | ||||
| 2026-02-11 | 13F | Simplex Trading, Llc | Put | 4.100 | 412,50 | 115 | ||||
| 2026-02-11 | 13F | Simplex Trading, Llc | 6.133 | -55,81 | 171 | |||||
| 2026-02-09 | 13F | Geode Capital Management, Llc | 897.692 | 12,01 | 25.105 | 91,33 | ||||
| 2026-04-15 | 13F | Activest Wealth Management | 1.001 | 0,00 | 38 | 40,74 | ||||
| 2026-02-11 | 13F | Cerity Partners LLC | 16.446 | 7,44 | 460 | 83,60 | ||||
| 2026-03-11 | 13F | Leonteq Securities AG | 0 | -100,00 | 0 | |||||
| 2026-04-16 | 13F | SG Americas Securities, LLC | 17.124 | -29,02 | 1 | |||||
| 2026-02-06 | 13F | Global Retirement Partners, LLC | 10 | 66,67 | 0 | |||||
| 2026-02-11 | 13F | Fox Run Management, L.l.c. | 29.419 | 136,15 | 823 | 304,93 | ||||
| 2026-02-13 | 13F | Dynamic Technology Lab Private Ltd | 13.560 | 379 | ||||||
| 2026-02-17 | 13F | Bridgeway Capital Management Inc | 43.200 | -40,17 | 1.208 | 2,20 | ||||
| 2026-01-29 | 13F | Vanguard Group Inc | 2.313.395 | 18,62 | 64.683 | 102,60 | ||||
| 2026-04-13 | 13F | True Wealth Design, LLC | 13 | 0,00 | 0 | |||||
| 2026-02-17 | 13F | Wellington Management Group Llp | 473.796 | 304,75 | 13.247 | 591,39 | ||||
| 2026-04-15 | 13F | Fortitude Family Office, LLC | 45 | 2 | ||||||
| 2026-02-12 | 13F | Jane Street Group, Llc | Call | 15.700 | 439 | |||||
| 2026-02-12 | 13F | Jane Street Group, Llc | Put | 25.100 | 38,67 | 702 | 136,82 | |||
| 2026-02-10 | 13F | Td Asset Management Inc | 133.918 | 120,99 | 3.744 | 277,42 | ||||
| 2026-02-23 | 13F | Virtu Financial LLC | 0 | -100,00 | 0 | |||||
| 2026-02-12 | 13F | Soleus Capital Management, L.P. | 60.000 | 205,44 | 1.678 | 422,43 | ||||
| 2026-02-14 | 13F | POM Investment Strategies, LLC | 500 | 0,00 | 14 | 62,50 | ||||
| 2026-02-12 | 13F | Polen Capital Management Llc | 0 | -100,00 | 0 | |||||
| 2026-02-17 | 13F | J. Goldman & Co LP | 28.949 | 809 | ||||||
| 2026-02-06 | 13F | Profund Advisors Llc | 22.092 | 618 | ||||||
| 2026-02-10 | 13F | Bnp Paribas Arbitrage, Sa | 8.407 | 31,92 | 235 | 125,96 | ||||
| 2026-01-23 | 13F | Avion Wealth | 411 | -20,66 | 0 | |||||
| 2026-02-10 | 13F | Goldman Sachs Group Inc | 1.303.030 | 298,75 | 36.433 | 581,10 | ||||
| 2026-01-06 | 13F | Sanctuary Advisors, LLC | 0 | -100,00 | 0 | -100,00 | ||||
| 2026-02-13 | 13F | Victory Capital Management Inc | 44.047 | 1.232 | ||||||
| 2026-04-13 | 13F | Massmutual Trust Co Fsb/adv | 53 | 2 | ||||||
| 2026-04-24 | 13F | Root Financial Partners, LLC | 19 | 1 | ||||||
| 2026-02-11 | 13F | Rise Advisors, LLC | 0 | -100,00 | 0 | |||||
| 2026-02-17 | 13F | Scientech Research LLC | 10.329 | 289 | ||||||
| 2026-04-24 | 13F | UMA Financial Services, Inc. | 599 | 0,00 | 23 | 37,50 | ||||
| 2026-02-12 | 13F | MetLife Investment Management, LLC | 19.427 | 0,00 | 543 | 70,75 | ||||
| 2026-02-17 | 13F | Fmr Llc | 199.190 | -24,28 | 5.569 | 29,33 | ||||
| 2026-02-17 | 13F | Adage Capital Partners Gp, L.l.c. | 785.000 | -41,20 | 21.949 | 0,43 | ||||
| 2026-02-17 | 13F | Atom Investors LP | 207.495 | 5.802 | ||||||
| 2026-02-06 | 13F | Gsa Capital Partners Llp | 0 | -100,00 | 0 | |||||
| 2025-11-05 | 13F | SBI Securities Co., Ltd. | 0 | -100,00 | 0 | |||||
| 2026-02-13 | 13F | State Street Corp | 1.732.015 | 108,06 | 48.427 | 255,38 | ||||
| 2026-02-17 | 13F | Public Employees Retirement System Of Ohio | 8.235 | 0,00 | 230 | 71,64 | ||||
| 2026-04-22 | 13F | Sterling Capital Management LLC | 1.254 | -33,62 | 48 | -9,62 | ||||
| 2026-02-13 | 13F | Prudential Financial Inc | 78.320 | 25,62 | 2.190 | 114,61 | ||||
| 2026-02-17 | 13F | Ikarian Capital, LLC | 719.787 | 73,93 | 20.125 | 197,09 | ||||
| 2026-02-17 | 13F | Rtw Investments, Lp | 1.487.933 | 41.603 | ||||||
| 2026-02-12 | 13F | CIBC Private Wealth Group, LLC | 1 | 0 | ||||||
| 2026-02-13 | 13F | Panagora Asset Management Inc | 180.718 | 16,66 | 5.053 | 99,29 | ||||
| 2026-02-10 | 13F | Rothschild Investment Llc | 14 | 0 | ||||||
| 2026-02-17 | 13F | Artisan Partners Limited Partnership | 836.506 | 23.389 | ||||||
| 2026-02-17 | 13F | Price T Rowe Associates Inc /md/ | 1.170.179 | 133,00 | 33 | 300,00 | ||||
| 2026-02-17 | 13F | Northern Trust Corp | 333.668 | -1,25 | 9.329 | 68,67 | ||||
| 2026-02-17 | 13F | Wealth Watch Advisors, INC | 15 | 0 | ||||||
| 2026-02-10 | 13F | Norges Bank | 50.000 | 1.398 | ||||||
| 2026-02-10 | 13F | CIBC World Markets Inc. | 7.373 | 206 | ||||||
| 2026-02-17 | 13F | Aqr Capital Management Llc | 57.693 | 40,12 | 1.613 | 139,32 | ||||
| 2026-02-17 | 13F | Artia Global Partners LP | 17.019 | 476 | ||||||
| 2026-02-13 | 13F | Manufacturers Life Insurance Company, The | 0 | -100,00 | 0 | |||||
| 2026-04-22 | 13F | Spire Wealth Management | 633 | 0,00 | 24 | 41,18 | ||||
| 2026-02-12 | 13F | Renaissance Technologies Llc | 359.800 | -22,00 | 10.060 | 33,23 | ||||
| 2026-02-13 | 13F | Barclays Plc | 124.334 | 80,59 | 3.476 | 208,43 | ||||
| 2026-02-13 | 13F | American Century Companies Inc | 8.553 | -89,06 | 239 | -81,31 | ||||
| 2026-04-15 | 13F | Gf Fund Management Co. Ltd. | 1.192 | 14,40 | 45 | 55,17 | ||||
| 2026-02-12 | 13F | Silverarc Capital Management, Llc | 1.023.122 | 2,31 | 28.606 | 74,75 | ||||
| 2026-02-17 | 13F | Sphera Funds Management Ltd. | 175.500 | 4.907 | ||||||
| 2026-02-17 | 13F | Bank Of America Corp /de/ | 196.689 | -36,36 | 5.499 | 8,70 | ||||
| 2026-02-17 | 13F | Squadron Capital Management LLC | 291.710 | 8.156 | ||||||
| 2026-02-17 | 13F | California State Teachers Retirement System | 2.015 | -1,13 | 56 | 69,70 | ||||
| 2026-02-17 | 13F | Point72 Asset Management, L.P. | 2.166.929 | -23,62 | 60.587 | 30,45 | ||||
| 2026-02-17 | 13F | Quantinno Capital Management LP | 8.438 | 236 | ||||||
| 2026-02-13 | 13F | JustInvest LLC | 14.809 | -0,98 | 414 | 69,67 | ||||
| 2026-02-17 | 13F | Tudor Investment Corp Et Al | Put | 30.800 | -65,82 | 861 | -41,59 | |||
| 2026-02-11 | 13F | Ameritas Investment Partners, Inc. | 2.568 | 72 | ||||||
| 2026-02-17 | 13F | Tudor Investment Corp Et Al | Call | 50.200 | -43,02 | 1.404 | -2,70 | |||
| 2026-02-13 | 13F | Police & Firemen's Retirement System of New Jersey | 9.097 | 0,00 | 254 | 71,62 | ||||
| 2026-02-13 | 13F | Bruce & Co., Inc. | 165.000 | -40,93 | 4.613 | 0,90 | ||||
| 2026-02-13 | 13F | Rhumbline Advisers | 43.244 | -10,76 | 1.209 | 52,46 | ||||
| 2026-02-13 | 13F | Sei Investments Co | 20.664 | 578 | ||||||
| 2026-02-17 | 13F | Board of Trustees of The Leland Stanford Junior University | 691.767 | 0,00 | 19.342 | 70,80 | ||||
| 2026-01-15 | 13F | Nisa Investment Advisors, Llc | 569 | -47,02 | 16 | -11,76 | ||||
| 2026-02-13 | 13F | Y-Intercept (Hong Kong) Ltd | 37.965 | 1.062 | ||||||
| 2026-02-17 | 13F | Harvest Investment Services, LLC | 61.983 | 1.733 | ||||||
| 2026-02-17 | 13F | Tang Capital Management Llc | 0 | -100,00 | 0 | |||||
| 2026-04-23 | 13F | RIA Advisory Group LLC | 84.672 | -25,38 | 3.228 | 1,73 | ||||
| 2025-11-14 | 13F | Raymond James Financial Inc | 0 | -100,00 | 0 | |||||
| 2026-02-12 | 13F | Jane Street Group, Llc | 0 | -100,00 | 0 | -100,00 | ||||
| 2026-02-11 | 13F | Deutsche Bank Ag\ | 35.317 | 14,95 | 987 | 96,61 | ||||
| 2026-02-17 | 13F | Aster Capital Management (DIFC) Ltd | 4.253 | 119 | ||||||
| 2026-02-12 | 13F | Campbell & CO Investment Adviser LLC | 43.369 | 45,51 | 1.213 | 148,87 | ||||
| 2026-02-13 | 13F | SRS Capital Advisors, Inc. | 0 | -100,00 | 0 | |||||
| 2026-02-17 | 13F | Baker Bros. Advisors Lp | 19.919.186 | 15,07 | 556.940 | 96,54 | ||||
| 2026-01-30 | 13F | Aries Wealth Management | 25.000 | 0,00 | 699 | 70,90 | ||||
| 2026-02-17 | 13F | Boothbay Fund Management, Llc | 173.221 | 48,77 | 4.843 | 154,09 | ||||
| 2026-04-22 | 13F | Continuum Advisory, LLC | 14.852 | 0,00 | 566 | 36,39 | ||||
| 2026-02-06 | 13F | Pnc Financial Services Group, Inc. | 1.229 | 16,83 | 34 | 100,00 | ||||
| 2026-02-17 | 13F | Two Sigma Investments, Lp | 51.671 | -62,63 | 1.445 | -36,19 | ||||
| 2026-02-17 | 13F | Perceptive Advisors Llc | 848.900 | 33,77 | 23.735 | 128,48 | ||||
| 2026-02-13 | 13F | ICONIQ Capital, LLC | 1.266.563 | 0,00 | 35.413 | 70,80 | ||||
| 2026-02-17 | 13F | TCG Crossover Management, LLC | 0 | -100,00 | 0 | |||||
| 2026-02-17 | 13F | Algert Global Llc | 9.390 | 0 | ||||||
| 2026-02-17 | 13F | Alliancebernstein L.p. | 35.180 | -36,11 | 984 | 9,10 | ||||
| 2026-01-26 | 13F | Mirae Asset Global Investments Co., Ltd. | 2.578 | 72 | ||||||
| 2026-02-17 | 13F | Susquehanna International Group, Llp | 36.722 | -78,58 | 1.027 | -63,42 | ||||
| 2026-02-17 | 13F | Brevan Howard Capital Management LP | 17.207 | 481 | ||||||
| 2026-02-05 | 13F | Amalgamated Bank | 1.028 | -10,92 | 0 | |||||
| 2026-02-13 | 13F | Charles Schwab Investment Management Inc | 340.657 | 21,89 | 9.525 | 108,17 | ||||
| 2026-02-17 | 13F | Susquehanna International Group, Llp | Put | 46.900 | -41,52 | 1.311 | -0,08 | |||
| 2026-02-17 | 13F | Susquehanna International Group, Llp | Call | 100.900 | 108,90 | 2.821 | 257,09 | |||
| 2026-02-17 | 13F | Citadel Advisors Llc | Put | 7.800 | -77,06 | 218 | -60,79 | |||
| 2026-01-29 | 13F | China Universal Asset Management Co., Ltd. | 8.644 | 242 | ||||||
| 2026-02-17 | 13F | Citadel Advisors Llc | Call | 57.400 | 18,84 | 1.605 | 103,04 | |||
| 2026-02-17 | 13F | Jain Global LLC | 284.899 | 7.966 | ||||||
| 2026-01-29 | 13F | UBS Group AG | 168.562 | 197,24 | 4.713 | 407,76 | ||||
| 2026-02-17 | 13F | Citadel Advisors Llc | 290.479 | 539,05 | 8.122 | 991,53 | ||||
| 2026-02-12 | 13F | State Board Of Administration Of Florida Retirement System | 9.723 | 272 | ||||||
| 2026-02-17 | 13F | Boone Capital Management Llc | 503.830 | -29,62 | 14.087 | 20,22 | ||||
| 2026-04-21 | 13F | Financial Consulate, Inc | 30 | 0,00 | 1 | |||||
| 2026-02-17 | 13F | Virtus Investment Advisers, Inc. | 11.173 | 312 | ||||||
| 2026-02-12 | 13F | Nuveen, LLC | 73.044 | -39,84 | 2.042 | 2,77 | ||||
| 2026-02-10 | 13F | Acadian Asset Management Llc | 709.818 | -26,82 | 20 | 26,67 | ||||
| 2026-02-13 | 13F | Nantahala Capital Management, LLC | 0 | -100,00 | 0 | |||||
| 2026-02-13 | 13F | Ubs Asset Management Americas Inc | 193 | 5 | ||||||
| 2026-02-17 | 13F | Russell Investments Group, Ltd. | 31.717 | -11,79 | 887 | 50,68 | ||||
| 2025-11-14 | 13F | Graham Capital Management, L.P. | 0 | -100,00 | 0 | -100,00 | ||||
| 2026-02-10 | 13F | Daiwa Securities Group Inc. | 177 | 0 | ||||||
| 2026-02-17 | 13F | D. E. Shaw & Co., Inc. | 320.647 | -29,97 | 8.965 | 19,61 | ||||
| 2026-02-17 | 13F | Vestal Point Capital, LP | 0 | -100,00 | 0 | |||||
| 2026-02-12 | 13F | Dimensional Fund Advisors Lp | 327.482 | -36,78 | 9.156 | 8,01 | ||||
| 2026-02-09 | 13F | Quest Partners LLC | 210 | -4,55 | 6 | 66,67 |
Other Listings
| US:KOD | 44,84 $ |