Grundlæggende statistik
| Institutionelle aktier (lange) | 20.047.985 - 13,83% (ex 13D/G) - change of 8,03MM shares 66,80% MRQ |
| Institutionel værdi (lang) | $ 39.921 USD ($1000) |
Institutionelt ejerskab og aktionærer
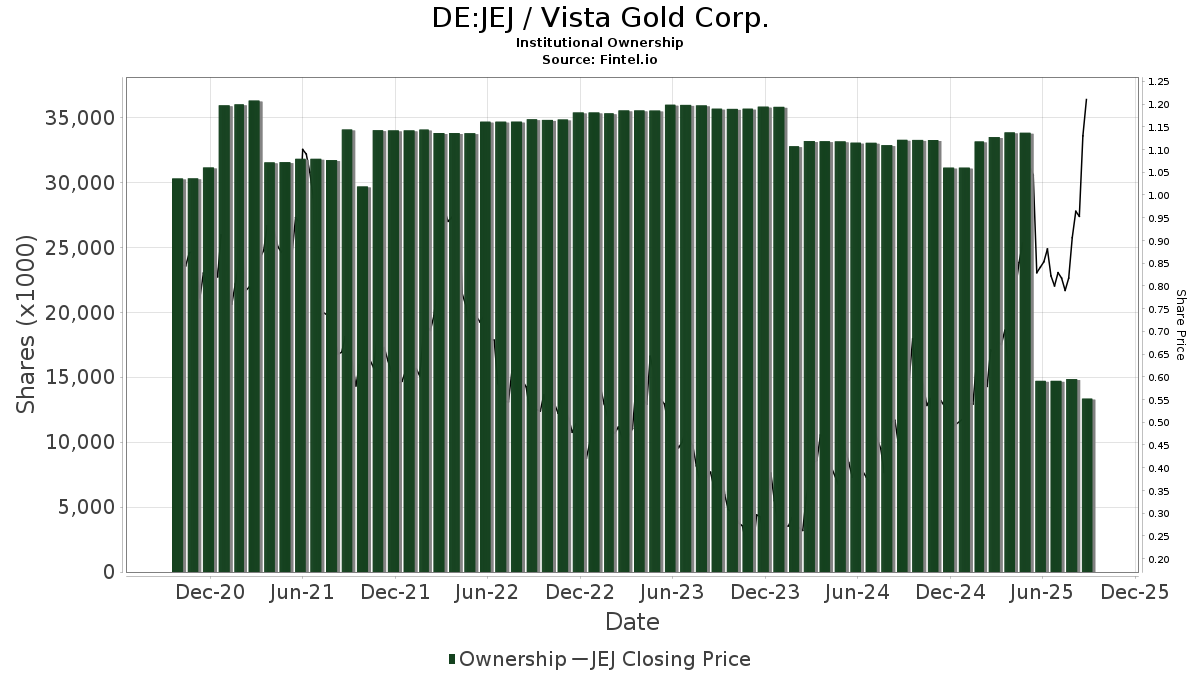
Vista Gold Corp. (DE:JEJ) har 77 institutionelle ejere og aktionærer, der har indsendt 13D/G- eller 13F-formularer til Securities Exchange Commission (SEC). Disse institutioner har i alt 20,047,985 aktier. Største aktionærer omfatter Kopernik Global Investors, LLC, Nilsine Partners, LLC, Cetera Investment Advisers, BCJ Capital Management, LLC, Marshall Wace, Llp, Two Sigma Investments, Lp, Redmond Asset Management, LLC, Jane Street Group, Llc, Arrowstreet Capital, Limited Partnership, and Millennium Management Llc .
Vista Gold Corp. (DB:JEJ) institutionel ejerskabsstruktur viser aktuelle positioner i virksomheden efter institutioner og fonde, samt seneste ændringer i positionsstørrelse. Større aktionærer kan omfatte individuelle investorer, investeringsforeninger, hedgefonde eller institutioner. Skema 13D angiver, at investoren besidder (eller besidder) mere end 5 % af virksomheden og har til hensigt (eller har til hensigt at) aktivt at forfølge en ændring i forretningsstrategi. Skema 13G indikerer en passiv investering på over 5%.
The share price as of April 30, 2026 is 1,81 / share. Previously, on May 5, 2025, the share price was 0,81 / share. This represents an increase of 123,15% over that period.
Fondens stemningsscore
Fund Sentiment Score (fka Ownership Accumulation Score) finder de aktier, der bliver mest købt af fonde. Det er resultatet af en sofistikeret, multi-faktor kvantitativ model, der identificerer virksomheder med de højeste niveauer af institutionel akkumulering. Scoringsmodellen bruger en kombination af den samlede stigning i oplyste ejere, ændringerne i porteføljeallokeringer i disse ejere og andre målinger. Tallet går fra 0 til 100, hvor højere tal indikerer et højere niveau af akkumulering for sine jævnaldrende, og 50 er gennemsnittet.
Opdateringsfrekvens: Dagligt
Se Ownership Explorer, som giver en liste over højest rangerende virksomheder.
AI+ Ask Fintel’s AI assistant about Vista Gold Corp..
Select a question to share a public post with an AI-crafted answer.
Thinking of good questions…
13F og NPORT arkivering
Detaljer om 13F-arkivering er gratis. Detaljer om NP-ansøgninger kræver et premium-medlemskab. Grønne rækker angiver nye positioner. Røde rækker angiver lukkede positioner. Klik på linket ikon for at se den fulde transaktionshistorik.
Opgrader
for at låse premium-data op og eksportere til Excel ![]() .
.
| Fil dato | Kilde | Investor | Type | Gennemsnitlig pris (Øst) |
Aktier | Δ Aktier (%) |
Rapporteret Værdi ($1000) |
Δ Værdi (%) |
Port Alloc (%) |
|
|---|---|---|---|---|---|---|---|---|---|---|
| 2026-02-17 | 13F | Citadel Advisors Llc | Call | 44.900 | 88 | |||||
| 2026-02-11 | 13F | Group One Trading, L.p. | 0 | -100,00 | 0 | -100,00 | ||||
| 2026-02-13 | 13F | Morgan Stanley | 509.508 | 112,30 | 1.004 | 96,28 | ||||
| 2026-02-17 | 13F | Citadel Advisors Llc | Put | 96.100 | 493,21 | 189 | 455,88 | |||
| 2026-02-17 | 13F | Citadel Advisors Llc | 198.812 | 4,59 | 392 | -3,22 | ||||
| 2026-02-17 | 13F | Bank Of America Corp /de/ | 226.919 | 132,00 | 447 | 114,90 | ||||
| 2026-01-29 | 13F | UBS Group AG | 43.110 | -50,08 | 85 | -54,10 | ||||
| 2025-11-14 | 13F | Cubist Systematic Strategies, LLC | 64.024 | 136 | ||||||
| 2026-02-09 | 13F | Jefferies Financial Group Inc. | 48.047 | 88,42 | 95 | 74,07 | ||||
| 2026-02-05 | 13F | Baader Bank INC | 15.828 | -23,38 | 14 | -31,58 | ||||
| 2026-02-13 | 13F | Kopernik Global Investors, LLC | 2.466.589 | -21,18 | 4.859 | -27,10 | ||||
| 2026-02-17 | 13F | Cetera Investment Advisers | 2.165.903 | -0,19 | 4.267 | -7,70 | ||||
| 2026-02-13 | 13F | Wells Fargo & Company/mn | 272.019 | 21,97 | 529 | 12,79 | ||||
| 2026-02-23 | 13F | Virtu Financial LLC | 17.215 | 0 | ||||||
| 2026-02-17 | 13F | Susquehanna International Group, Llp | Call | 30.900 | -8,58 | 61 | -15,49 | |||
| 2026-02-12 | 13F | Brinker Capital Investments, LLC | 211.586 | 65,59 | 417 | 52,94 | ||||
| 2026-01-21 | 13F | Stone House Investment Management, LLC | 0 | -100,00 | 0 | |||||
| 2026-02-13 | 13F | Mariner, LLC | 150.413 | 0,00 | 296 | -7,50 | ||||
| 2026-02-17 | 13F | Royal Bank Of Canada | 800 | -1,23 | 2 | 0,00 | ||||
| 2026-02-17 | 13F | Mirabella Financial Services Llp | 28.327 | -42,09 | 56 | -47,12 | ||||
| 2026-02-05 | 13F | Allworth Financial LP | 4.200 | 8 | ||||||
| 2026-02-17 | 13F | Captrust Financial Advisors | 0 | -100,00 | 0 | |||||
| 2026-04-16 | 13F | Prairiewood Capital, LLC | 41.000 | 0,00 | 80 | 0,00 | ||||
| 2026-02-17 | 13F | Two Sigma Investments, Lp | 1.061.652 | 2.091 | ||||||
| 2026-02-17 | 13F | Two Sigma Advisers, Lp | 239.100 | 471 | ||||||
| 2026-02-17 | 13F | XTX Topco Ltd | 340.853 | 274,18 | 671 | 245,88 | ||||
| 2026-02-06 | 13F | Global Retirement Partners, LLC | 145.312 | -23,66 | 286 | -29,38 | ||||
| 2026-02-13 | 13F | Citigroup Inc | 13.237 | 333,57 | 26 | 316,67 | ||||
| 2026-02-04 | 13F | BCJ Capital Management, LLC | 2.050.683 | 4.040 | ||||||
| 2026-02-17 | 13F | Quantinno Capital Management LP | 10.000 | 0,00 | 20 | -9,52 | ||||
| 2025-11-12 | 13F | Simplex Trading, Llc | 0 | -100,00 | 0 | |||||
| 2025-11-04 | 13F | Atlantic Union Bankshares Corp | 0 | -100,00 | 0 | |||||
| 2026-02-10 | 13F | Goldman Sachs Group Inc | 518.594 | 289,63 | 1.022 | 260,78 | ||||
| 2026-01-20 | 13F | AdvisorNet Financial, Inc | 0 | -100,00 | 0 | |||||
| 2026-02-17 | 13F | Mangrove Partners | 83.760 | 165 | ||||||
| 2026-02-17 | 13F | Susquehanna International Group, Llp | 52.022 | 130,59 | 102 | 112,50 | ||||
| 2026-02-17 | 13F/A | Kovack Advisors, Inc. | 25.500 | 50 | ||||||
| 2026-02-17 | 13F | Susquehanna International Group, Llp | Put | 22.100 | 44 | |||||
| 2026-02-11 | 13F | Simplex Trading, Llc | Put | 1.300 | -92,02 | 3 | ||||
| 2026-02-11 | 13F | Simplex Trading, Llc | Call | 280.900 | 222,13 | 553 | ||||
| 2026-04-07 | 13F | CoreCap Advisors, LLC | 1.000 | 0,00 | 2 | 0,00 | ||||
| 2026-02-13 | 13F | Integrated Wealth Concepts LLC | 100.000 | 0,00 | 197 | -7,51 | ||||
| 2026-01-30 | 13F | Us Bancorp \de\ | 100 | 0,00 | 0 | |||||
| 2026-02-12 | 13F | Hrt Financial Lp | 23.995 | -45,78 | 0 | |||||
| 2026-02-11 | 13F | Group One Trading, L.p. | Call | 106.500 | 349,37 | 210 | 318,00 | |||
| 2026-02-10 | 13F | Bnp Paribas Arbitrage, Sa | 0 | -100,00 | 0 | -100,00 | ||||
| 2026-02-11 | 13F | Group One Trading, L.p. | Put | 30.400 | 109,66 | 60 | 96,67 | |||
| 2026-02-11 | 13F | Fore Capital, LLC | 380.000 | 748 | ||||||
| 2026-02-18 | 13F | Caitlin John, LLC | 5.000 | -66,67 | 10 | -70,97 | ||||
| 2025-11-07 | 13F | Beacon Capital Management, LLC | 0 | -100,00 | 0 | |||||
| 2026-04-30 | 13F | Hsbc Holdings Plc | 15.787 | -12,59 | 30 | -23,08 | ||||
| 2026-02-17 | 13F | Millennium Management Llc | 519.601 | 411,29 | 1.024 | 373,61 | ||||
| 2026-02-13 | 13F | OMERS ADMINISTRATION Corp | 0 | -100,00 | 0 | |||||
| 2026-02-12 | 13F | Dimensional Fund Advisors Lp | 16.168 | 0,00 | 32 | -8,82 | ||||
| 2026-02-17 | 13F | Two Sigma Securities, Llc | 12.740 | -8,38 | 25 | -13,79 | ||||
| 2026-02-13 | 13F | Searle & Co. | 0 | -100,00 | 0 | |||||
| 2026-02-17 | 13F | Advisor Group Holdings, Inc. | 1.500 | 0,00 | 3 | -33,33 | ||||
| 2026-02-13 | 13F | Victory Capital Management Inc | 14.127 | 0,89 | 28 | -6,90 | ||||
| 2026-02-13 | 13F | Pathstone Holdings, LLC | 125.000 | 0,00 | 246 | -7,52 | ||||
| 2026-02-17 | 13F | Boothbay Fund Management, Llc | 28.093 | 55 | ||||||
| 2025-11-14 | 13F | Loews Corp | 0 | -100,00 | 0 | -100,00 | ||||
| 2026-02-13 | 13F | National Bank Of Canada /fi/ | 2.510 | 5 | ||||||
| 2026-02-11 | 13F | LPL Financial LLC | 0 | -100,00 | 0 | -100,00 | ||||
| 2026-02-13 | 13F | Marshall Wace, Llp | 1.269.689 | 2.501 | ||||||
| 2026-02-13 | 13F | Arrowstreet Capital, Limited Partnership | 633.241 | 826,77 | 1.240 | 761,11 | ||||
| 2026-04-27 | 13F | Garrett Wealth Advisory Group, LLC | 10.000 | 0,00 | 20 | 0,00 | ||||
| 2026-04-29 | 13F | Cary Street Partners Financial Llc | 11.200 | 0,00 | 22 | -4,55 | ||||
| 2026-02-18 | 13F | Vermillion & White Wealth Management Group, LLC | 0 | -100,00 | 0 | |||||
| 2026-02-11 | 13F | Jpmorgan Chase & Co | 3.334 | -88,11 | 7 | -89,83 | ||||
| 2026-02-12 | 13F | Jane Street Group, Llc | Call | 30.700 | 60 | |||||
| 2026-02-12 | 13F | Jane Street Group, Llc | 762.185 | 242,41 | 1.502 | 216,67 | ||||
| 2026-02-09 | 13F | Harbour Investments, Inc. | 1.109 | 0,00 | 2 | 0,00 | ||||
| 2026-02-13 | 13F | Barclays Plc | 120.000 | 127.559,57 | 236 | |||||
| 2026-02-17 | 13F | Qube Research & Technologies Ltd | 401.146 | 790 | ||||||
| 2025-11-14 | 13F | Wolverine Trading, Llc | 40.091 | 88 | ||||||
| 2026-02-06 | 13F | Leonteq Securities AG | 0 | -100,00 | 0 | |||||
| 2025-11-14 | 13F | Wolverine Trading, Llc | Call | 23.200 | 51 | |||||
| 2026-02-09 | 13F | Redmond Asset Management, LLC | 945.628 | 0,05 | 1.863 | -7,50 | ||||
| 2026-02-12 | 13F | Sprott Inc. | 295.582 | -7,94 | 582 | -14,79 | ||||
| 2026-02-11 | 13F | Tradition Wealth Management, LLC | 19.977 | 0,00 | 39 | -7,14 | ||||
| 2026-04-14 | 13F | Nbc Securities, Inc. | 5.750 | 0,00 | 11 | 0,00 | ||||
| 2026-04-29 | 13F | Nilsine Partners, LLC | 2.457.008 | 14,25 | 5.405 | 27,60 | ||||
| 2026-02-12 | 13F | StoneX Group Inc. | 23.383 | 62,13 | 46 | 53,33 | ||||
| 2026-01-26 | 13F | Ckw Financial Group | 25 | 0,00 | 0 | |||||
| 2026-02-17 | 13F | Raymond James Financial Inc | 44.300 | 0,00 | 87 | -7,45 | ||||
| 2026-04-16 | 13F | Brookstone Capital Management | 12.100 | 0,83 | 24 | 0,00 | ||||
| 2026-02-09 | 13F | Endowment Wealth Management, Inc. | 12.500 | 0,00 | 25 | -7,69 | ||||
| 2026-02-17 | 13F | Quadrature Capital Ltd | 87.227 | 103,74 | 172 | 90,00 | ||||
| 2026-02-13 | 13F | Walleye Capital LLC | 32.023 | -77,47 | 63 | -79,14 | ||||
| 2026-03-24 | 13F | Armis Advisers, LLC | 27.308 | 76,66 | 49 | 100,00 | ||||
| 2026-02-12 | 13F | Commonwealth Equity Services, Llc | 75.170 | 0,00 | 148 | |||||
| 2026-02-06 | 13F | Orcam Financial Group | 73.929 | 0,00 | 146 | -7,64 | ||||
| 2026-02-18 | 13F | GWM Advisors LLC | 106.000 | 209 | ||||||
| 2026-05-01 | 13F | Blume Capital Management, Inc. | 6.016 | 14,81 | 12 | 10,00 | ||||
| 2026-02-13 | 13F | Global Strategic Management Inc | 0 | -100,00 | 0 | |||||
| 2026-02-13 | 13F | Squarepoint Ops LLC | 70.297 | 344,55 | 138 | 318,18 | ||||
| 2026-04-20 | 13F | Ronald Blue Trust, Inc. | 1.340 | 0,00 | 3 | 0,00 | ||||
| 2026-02-12 | 13F | Bank Of Montreal /can/ | Put | 2.500 | 5 | |||||
| 2026-02-12 | 13F | Bank Of Montreal /can/ | 124.976 | -7,19 | 243 | -15,03 | ||||
| 2026-02-17 | 13F | Point72 Asset Management, L.P. | 79.730 | 157 | ||||||
| 2026-02-13 | 13F | Centiva Capital, LP | 45.087 | -40,17 | 89 | -45,00 |