Grundlæggende statistik
| Institutionelle aktier (lange) | 22.019.097 - 46,29% (ex 13D/G) - change of -0,14MM shares -0,61% MRQ |
| Institutionel værdi (lang) | $ 48.401 USD ($1000) |
Institutionelt ejerskab og aktionærer
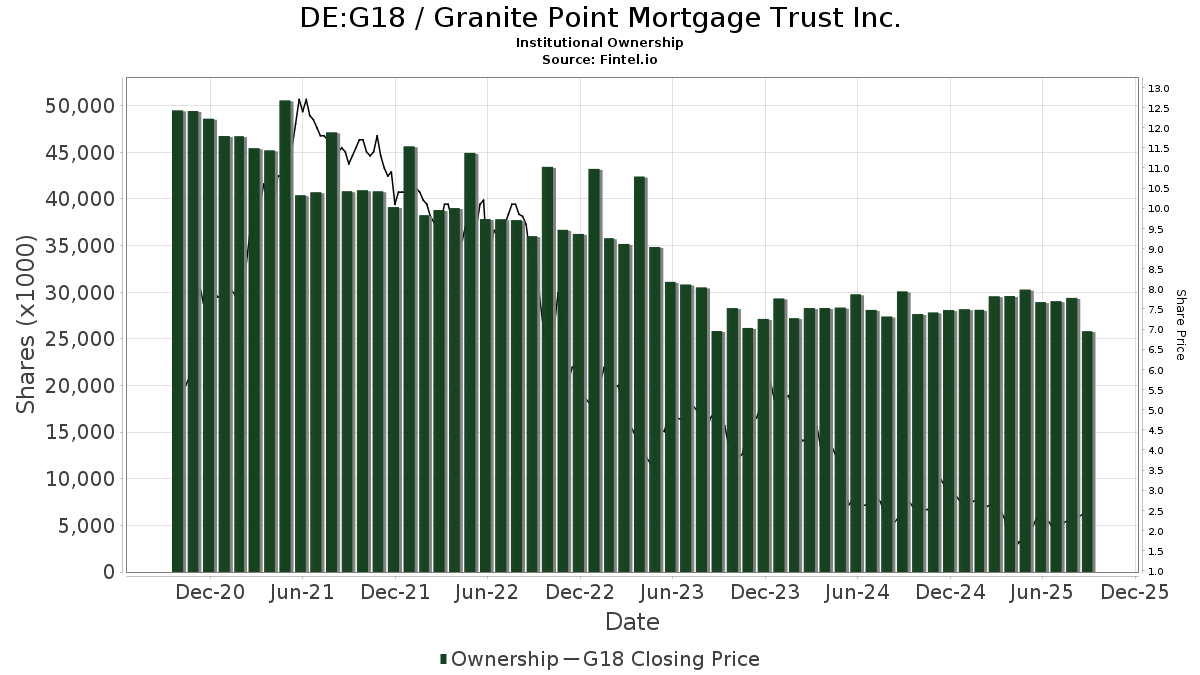
Granite Point Mortgage Trust Inc. (DE:G18) har 105 institutionelle ejere og aktionærer, der har indsendt 13D/G- eller 13F-formularer til Securities Exchange Commission (SEC). Disse institutioner har i alt 22,019,097 aktier. Største aktionærer omfatter Vanguard Group Inc, Gratia Capital, Llc, Cura Wealth Advisors, Llc, BlackRock, Inc., Hotchkis & Wiley Capital Management Llc, Acadian Asset Management Llc, Epiq Partners, Llc, Marshall Wace, Llp, D. E. Shaw & Co., Inc., and Morgan Stanley .
Granite Point Mortgage Trust Inc. (DB:G18) institutionel ejerskabsstruktur viser aktuelle positioner i virksomheden efter institutioner og fonde, samt seneste ændringer i positionsstørrelse. Større aktionærer kan omfatte individuelle investorer, investeringsforeninger, hedgefonde eller institutioner. Skema 13D angiver, at investoren besidder (eller besidder) mere end 5 % af virksomheden og har til hensigt (eller har til hensigt at) aktivt at forfølge en ændring i forretningsstrategi. Skema 13G indikerer en passiv investering på over 5%.
The share price as of March 6, 2026 is 1,49 / share. Previously, on March 10, 2025, the share price was 2,54 / share. This represents a decline of 41,34% over that period.
Fondens stemningsscore
Fund Sentiment Score (fka Ownership Accumulation Score) finder de aktier, der bliver mest købt af fonde. Det er resultatet af en sofistikeret, multi-faktor kvantitativ model, der identificerer virksomheder med de højeste niveauer af institutionel akkumulering. Scoringsmodellen bruger en kombination af den samlede stigning i oplyste ejere, ændringerne i porteføljeallokeringer i disse ejere og andre målinger. Tallet går fra 0 til 100, hvor højere tal indikerer et højere niveau af akkumulering for sine jævnaldrende, og 50 er gennemsnittet.
Opdateringsfrekvens: Dagligt
Se Ownership Explorer, som giver en liste over højest rangerende virksomheder.
AI+ Ask Fintel’s AI assistant about Granite Point Mortgage Trust Inc..
Select a question to share a public post with an AI-crafted answer.
Thinking of good questions…
13F og NPORT arkivering
Detaljer om 13F-arkivering er gratis. Detaljer om NP-ansøgninger kræver et premium-medlemskab. Grønne rækker angiver nye positioner. Røde rækker angiver lukkede positioner. Klik på linket ikon for at se den fulde transaktionshistorik.
Opgrader
for at låse premium-data op og eksportere til Excel ![]() .
.
| Fil dato | Kilde | Investor | Type | Gennemsnitlig pris (Øst) |
Aktier | Δ Aktier (%) |
Rapporteret Værdi ($1000) |
Δ Værdi (%) |
Port Alloc (%) |
|
|---|---|---|---|---|---|---|---|---|---|---|
| 2026-02-04 | 13F | Atlantic Union Bankshares Corp | 132 | 85,92 | 0 | |||||
| 2026-02-12 | 13F | Eagle Point Credit Management LLC | 80.666 | 194 | ||||||
| 2026-02-13 | 13F | Mariner, LLC | 10.109 | 24 | ||||||
| 2025-11-13 | 13F | Jump Financial, LLC | 0 | -100,00 | 0 | |||||
| 2025-09-29 | NP | PRFZ - Invesco FTSE RAFI US 1500 Small-Mid ETF This fund is a listed as child fund of Invesco Ltd. and if that institution has disclosed ownership in this security, then these positions will not be double counted when calculating total shares and total value | 173.732 | -23,14 | 443 | -0,45 | ||||
| 2026-02-10 | 13F | Connor, Clark & Lunn Investment Management Ltd. | 71.142 | -26,17 | 171 | -41,18 | ||||
| 2026-02-10 | 13F | Bnp Paribas Arbitrage, Sa | 13.984 | 51.692,59 | 34 | |||||
| 2026-03-06 | 13F | Hsbc Holdings Plc | 28.589 | 0,00 | 69 | -20,00 | ||||
| 2026-02-12 | 13F | Brown Brothers Harriman & Co | 142 | 0,00 | 0 | |||||
| 2026-01-29 | 13F | Vanguard Group Inc | 2.404.107 | -1,56 | 5.770 | -21,25 | ||||
| 2025-11-14 | 13F | DRW Securities, LLC | 0 | -100,00 | 0 | |||||
| 2026-01-06 | 13F | Sanctuary Advisors, LLC | 0 | -100,00 | 0 | -100,00 | ||||
| 2025-11-14 | 13F | Wolverine Trading, Llc | 0 | -100,00 | 0 | -100,00 | ||||
| 2026-01-13 | 13F | CoreCap Advisors, LLC | 245 | 29,63 | 1 | |||||
| 2026-02-11 | 13F | Group One Trading, L.p. | 6.617 | 1.486,81 | 16 | 1.400,00 | ||||
| 2025-11-14 | 13F | Wolverine Trading, Llc | Put | 0 | -100,00 | 0 | -100,00 | |||
| 2026-02-13 | 13F | Ausdal Financial Partners, Inc. | 23.750 | -15,93 | 57 | -32,14 | ||||
| 2026-01-29 | 13F | UBS Group AG | 14.946 | 175,35 | 36 | 118,75 | ||||
| 2026-02-09 | 13F | Catalyst Funds Management Pty Ltd | 10.386 | -74,08 | 25 | -80,00 | ||||
| 2026-02-17 | 13F | Quadrature Capital Ltd | 0 | -100,00 | 0 | |||||
| 2026-02-06 | 13F | Gsa Capital Partners Llp | 399.886 | -17,30 | 1 | -100,00 | ||||
| 2025-09-26 | NP | SMLF - iShares Edge MSCI Multifactor USA Small-Cap ETF | 309.947 | 4,41 | 790 | 35,27 | ||||
| 2026-02-12 | 13F | Hrt Financial Lp | 0 | -100,00 | 0 | |||||
| 2026-02-18 | 13F | Vident Advisory, LLC | 0 | -100,00 | 0 | |||||
| 2026-02-17 | 13F | Point72 Asset Management, L.P. | 43.668 | 105 | ||||||
| 2025-11-06 | 13F | Assetmark, Inc | 0 | -100,00 | 0 | |||||
| 2026-02-02 | 13F | Chung Wu Investment Group, LLC | 284 | 0,00 | 1 | |||||
| 2026-02-17 | 13F | Millennium Management Llc | 242.712 | -42,84 | 583 | -54,28 | ||||
| 2026-02-17 | 13F | Tower Research Capital LLC (TRC) | 1.658 | -9,84 | 4 | -40,00 | ||||
| 2026-01-29 | 13F | Camelot Portfolios, LLC | 324.621 | -8,71 | 779 | -26,92 | ||||
| 2026-01-22 | 13F | Apollon Wealth Management, LLC | 16.515 | 0,00 | 40 | -20,41 | ||||
| 2026-02-17 | 13F | Two Sigma Advisers, Lp | 407.125 | 171,73 | 977 | 117,59 | ||||
| 2025-09-24 | NP | SWTSX - Schwab Total Stock Market Index Fund This fund is a listed as child fund of Charles Schwab Investment Management Inc and if that institution has disclosed ownership in this security, then these positions will not be double counted when calculating total shares and total value | 23.221 | 0,00 | 59 | 31,11 | ||||
| 2025-09-29 | NP | KCXIX - Knights of Columbus U.S. All Cap Index Fund I Shares | 203 | 3,57 | 1 | |||||
| 2026-01-15 | 13F | Nisa Investment Advisors, Llc | 6.272 | -18,16 | 15 | -31,82 | ||||
| 2025-11-12 | 13F | Cresset Asset Management, LLC | 42.700 | 0,00 | 128 | 21,90 | ||||
| 2026-02-13 | 13F | OMERS ADMINISTRATION Corp | 35.600 | 85 | ||||||
| 2026-02-06 | 13F | Global Retirement Partners, LLC | 450 | 0,22 | 1 | 0,00 | ||||
| 2025-11-13 | 13F | Hudson Bay Capital Management LP | 0 | -100,00 | 0 | |||||
| 2026-02-17 | 13F | Wiley Bros.-aintree Capital, Llc | 110.320 | -0,90 | 265 | -20,72 | ||||
| 2026-01-07 | 13F | Epiq Partners, Llc | 1.093.188 | -8,51 | 2.624 | -26,81 | ||||
| 2026-02-10 | 13F | Envestnet Asset Management Inc | 22.555 | -30,86 | 54 | -44,33 | ||||
| 2026-02-12 | 13F | Principal Securities, Inc. | 0 | -100,00 | 0 | |||||
| 2026-02-17 | 13F | Gratia Capital, Llc | 2.239.309 | 31,12 | 5.374 | 4,90 | ||||
| 2026-02-19 | 13F | Invesco Ltd. | 98.617 | -34,86 | 237 | -48,02 | ||||
| 2026-02-06 | 13F | Lloyd Advisory Services, LLC. | 1 | 0 | ||||||
| 2026-02-06 | 13F | VSM Wealth Advisory, LLC | 0 | -100,00 | 0 | |||||
| 2026-02-17 | 13F | Northern Trust Corp | 175.375 | 3,52 | 421 | -17,32 | ||||
| 2026-02-17 | 13F | Aqr Capital Management Llc | 13.739 | -39,38 | 33 | -52,24 | ||||
| 2026-02-12 | 13F | Federation des caisses Desjardins du Quebec | 1.006 | 0,00 | 2 | -33,33 | ||||
| 2025-09-26 | NP | DVDN - Kingsbarn Dividend Opportunity ETF | 53.113 | -18,85 | 135 | 5,47 | ||||
| 2026-01-30 | 13F | Torren Management, LLC | 159 | 0 | ||||||
| 2025-09-26 | NP | USMIX - Extended Market Index Fund | 4.855 | 0,98 | 12 | 33,33 | ||||
| 2026-01-21 | 13F | Daytona Street Capital LLC | 309 | 1 | ||||||
| 2025-09-24 | NP | PJARX - SmallCap Value Fund II R-3 | 156.715 | -1,91 | 400 | 27,07 | ||||
| 2026-02-13 | 13F | Citigroup Inc | 0 | -100,00 | 0 | |||||
| 2026-02-13 | 13F | Arrowstreet Capital, Limited Partnership | 137.463 | -21,86 | 330 | -37,57 | ||||
| 2026-02-17 | 13F | Raymond James Financial Inc | 150.206 | -20,51 | 360 | -36,40 | ||||
| 2026-02-09 | 13F | Geode Capital Management, Llc | 506.915 | 0,33 | 1.217 | -19,79 | ||||
| 2026-02-11 | 13F | LPL Financial LLC | 10.258 | 25 | ||||||
| 2025-11-14 | 13F | Brevan Howard Capital Management LP | 0 | -100,00 | 0 | |||||
| 2025-11-13 | 13F | Russell Investments Group, Ltd. | 0 | -100,00 | 0 | |||||
| 2025-11-14 | 13F | Skopos Labs, Inc. | 0 | -100,00 | 0 | |||||
| 2026-01-26 | 13F | Cwm, Llc | 2.224 | -31,53 | 0 | |||||
| 2026-02-06 | 13F | EverSource Wealth Advisors, LLC | 386 | -24,61 | 1 | -100,00 | ||||
| 2026-02-06 | 13F | Pnc Financial Services Group, Inc. | 830 | 5,87 | 2 | -50,00 | ||||
| 2025-11-14 | 13F | Ieq Capital, Llc | 0 | -100,00 | 0 | |||||
| 2025-09-29 | NP | SUNAMERICA SERIES TRUST - SA Small Cap Index Portfolio Class 1 | 0 | -100,00 | 0 | -100,00 | ||||
| 2025-09-26 | NP | FLXSX - Fidelity Flex Small Cap Index Fund This fund is a listed as child fund of Fmr Llc and if that institution has disclosed ownership in this security, then these positions will not be double counted when calculating total shares and total value | 0 | -100,00 | 0 | -100,00 | ||||
| 2026-02-06 | 13F | Gables Capital Management Inc. | 207 | 0,00 | 0 | |||||
| 2026-01-30 | 13F/A | M&t Bank Corp | 19.228 | 0,00 | 46 | -19,30 | ||||
| 2026-02-17 | 13F | Advisory Services Network, LLC | 0 | -100,00 | 0 | |||||
| 2026-02-17 | 13F | Engineers Gate Manager LP | 39.007 | 18,54 | 94 | -5,10 | ||||
| 2026-02-12 | 13F | Steward Partners Investment Advisory, Llc | 0 | -100,00 | 0 | |||||
| 2026-02-17 | 13F | Graham Capital Management, L.P. | 93.899 | -5,63 | 225 | -24,50 | ||||
| 2025-11-13 | 13F | Glenmede Investment Management, LP | 0 | -100,00 | 0 | |||||
| 2026-02-10 | 13F | Acadian Asset Management Llc | 1.193.800 | 42,74 | 3 | 0,00 | ||||
| 2025-11-14 | 13F | Point72 Asia (Singapore) Pte. Ltd. | 26.393 | -38,99 | 79 | -25,47 | ||||
| 2026-02-17 | 13F | Hotchkis & Wiley Capital Management Llc | 1.269.557 | 0,84 | 3.047 | -19,33 | ||||
| 2025-11-14 | 13F | Jain Global LLC | 0 | -100,00 | 0 | |||||
| 2025-11-13 | 13F | IPG Investment Advisors LLC | 0 | -100,00 | 0 | |||||
| 2025-11-07 | 13F | May Hill Capital, LLC | 0 | -100,00 | 0 | |||||
| 2026-02-17 | 13F | Bank Of America Corp /de/ | 35.876 | -45,76 | 86 | -56,57 | ||||
| 2025-11-14 | 13F | Squarepoint Ops LLC | 0 | -100,00 | 0 | |||||
| 2026-01-30 | 13F | Caldwell Securities, Inc | 20.232 | -5,46 | 49 | -25,00 | ||||
| 2026-02-12 | 13F | American Financial Group Inc | 81.021 | 0,00 | 194 | -20,16 | ||||
| 2026-01-23 | 13F | Farther Finance Advisors, LLC | 1.806 | -24,44 | 4 | -42,86 | ||||
| 2026-02-13 | 13F | SRS Capital Advisors, Inc. | 0 | -100,00 | 0 | |||||
| 2026-02-17 | 13F | Advisor Group Holdings, Inc. | 6.374 | -33,41 | 15 | -46,43 | ||||
| 2026-02-13 | 13F | Charles Schwab Investment Management Inc | 264.279 | -12,79 | 634 | -30,25 | ||||
| 2026-02-17 | 13F | Two Sigma Investments, Lp | 330.565 | 76,98 | 793 | 41,61 | ||||
| 2026-02-17 | 13F | Ameriprise Financial Inc | 196.598 | -0,06 | 472 | -20,17 | ||||
| 2026-02-17 | 13F | XTX Topco Ltd | 97.558 | 156,81 | 234 | 107,08 | ||||
| 2026-02-13 | 13F | Sei Investments Co | 36.241 | -29,41 | 87 | -44,16 | ||||
| 2025-10-28 | 13F | Confluence Wealth Services, Inc. | 0 | -100,00 | 0 | |||||
| 2025-11-19 | 13F | Caitong International Asset Management Co., Ltd | 0 | -100,00 | 0 | |||||
| 2026-01-23 | 13F | Cura Wealth Advisors, Llc | 1.894.666 | 5,43 | 4.547 | -15,66 | ||||
| 2026-02-17 | 13F | Fmr Llc | 6.599 | -1,12 | 16 | -25,00 | ||||
| 2026-02-10 | 13F | Goldman Sachs Group Inc | 134.627 | -23,91 | 323 | -39,06 | ||||
| 2025-11-06 | 13F | Ground Swell Capital, LLC | 0 | -100,00 | 0 | -100,00 | ||||
| 2026-02-17 | 13F | Q Global Advisors, LLC | 183.717 | 0 | ||||||
| 2025-10-08 | 13F/A | New York State Common Retirement Fund | 0 | -100,00 | 0 | -100,00 | ||||
| 2026-02-17 | 13F | Cetera Investment Advisers | 23.385 | -23,28 | 56 | -38,46 | ||||
| 2025-11-12 | 13F | Neuberger Berman Group LLC | 0 | -100,00 | 0 | |||||
| 2026-02-13 | 13F | Marshall Wace, Llp | 849.109 | 2.038 | ||||||
| 2026-01-21 | 13F | Flagship Harbor Advisors, Llc | 1.707 | 4 | ||||||
| 2026-01-26 | 13F | Abundance Wealth Counselors | 191.011 | 2,08 | 458 | -18,36 | ||||
| 2026-02-17 | 13F | Two Sigma Securities, Llc | 22.395 | 43,36 | 54 | 15,22 | ||||
| 2026-02-17 | 13F | D. E. Shaw & Co., Inc. | 803.782 | 22,79 | 1.929 | -1,73 | ||||
| 2026-02-17 | 13F | Royal Bank Of Canada | 5.316 | 32,37 | 13 | 8,33 | ||||
| 2025-10-21 | 13F | True Wealth Design, LLC | 0 | -100,00 | 0 | |||||
| 2025-10-31 | 13F | National Asset Management, Inc. | 0 | -100,00 | 0 | |||||
| 2026-02-17 | 13F | 683 Capital Management, LLC | 183.150 | 440 | ||||||
| 2026-02-13 | 13F | State Street Corp | 265.242 | 2,12 | 650 | -16,69 | ||||
| 2026-02-11 | 13F | Jpmorgan Chase & Co | 216.838 | -2,72 | 520 | -22,16 | ||||
| 2026-02-17 | 13F | Optiver Holding B.V. | 782 | -0,51 | 2 | -50,00 | ||||
| 2026-02-11 | 13F | Simplex Trading, Llc | Call | 0 | -100,00 | 0 | ||||
| 2025-11-14 | 13F | Susquehanna International Group, Llp | Call | 0 | -100,00 | 0 | -100,00 | |||
| 2026-02-02 | 13F | Oppenheimer & Co Inc | 270.000 | 0,00 | 648 | -20,00 | ||||
| 2026-02-17 | 13F | Qube Research & Technologies Ltd | 46.563 | -39,54 | 112 | -51,95 | ||||
| 2026-02-17 | 13F | Price T Rowe Associates Inc /md/ | 85.539 | 0,00 | 0 | |||||
| 2026-02-12 | 13F | Jane Street Group, Llc | 328.005 | -6,55 | 787 | -25,26 | ||||
| 2026-02-19 | 13F | CI Private Wealth, LLC | 20.948 | 0,00 | 50 | -19,35 | ||||
| 2026-02-12 | 13F | BlackRock, Inc. | 1.516.316 | -5,43 | 3.639 | -24,33 | ||||
| 2026-02-11 | 13F | Group One Trading, L.p. | Put | 0 | -100,00 | 0 | -100,00 | |||
| 2026-02-17 | 13F | Citadel Advisors Llc | Put | 10.400 | -36,97 | 25 | -51,02 | |||
| 2025-10-15 | 13F | Harbor Capital Advisors, Inc. | 0 | -100,00 | 0 | |||||
| 2026-02-17 | 13F | Citadel Advisors Llc | 399.358 | 125,38 | 958 | 80,41 | ||||
| 2026-02-17 | 13F | Lighthouse Investment Partners, LLC | 24.060 | 58 | ||||||
| 2025-11-14 | 13F | Cubist Systematic Strategies, LLC | 45.022 | -80,71 | 135 | -76,56 | ||||
| 2026-02-12 | 13F | Investment Research Partners LLC | 50.139 | -0,09 | 120 | -12,41 | ||||
| 2025-11-14 | 13F | Point72 (DIFC) Ltd | 0 | -100,00 | 0 | |||||
| 2026-02-17 | 13F | Palogic Value Management, L.P. | 79.000 | 0,00 | 190 | -20,25 | ||||
| 2025-10-31 | 13F | Y-Intercept (Hong Kong) Ltd | 0 | -100,00 | 0 | |||||
| 2026-02-13 | 13F | Barclays Plc | 95.931 | 112,31 | 230 | 70,37 | ||||
| 2025-11-12 | 13F | Group One Trading, L.p. | Call | 0 | -100,00 | 0 | -100,00 | |||
| 2026-02-13 | 13F | Truffle Hound Capital, LLC | 400.000 | 0,00 | 960 | -20,00 | ||||
| 2025-11-12 | 13F | Aster Capital Management (DIFC) Ltd | 0 | -100,00 | 0 | |||||
| 2026-01-26 | 13F | Invested Advisors | 32.767 | 50,60 | 79 | 32,20 | ||||
| 2026-02-09 | 13F | Keating Financial Advisory Services, Inc. | 900 | 2 | ||||||
| 2026-02-09 | 13F | Harbour Investments, Inc. | 2.713 | -2,20 | 7 | -25,00 | ||||
| 2026-02-13 | 13F | Wells Fargo & Company/mn | 6.942 | 1,79 | 17 | -20,00 | ||||
| 2026-02-11 | 13F | Simplex Trading, Llc | Put | 100 | 0,00 | 0 | ||||
| 2026-02-17 | 13F | Susquehanna International Group, Llp | 284.054 | -7,76 | 682 | -26,22 | ||||
| 2026-02-11 | 13F | Simplex Trading, Llc | 945 | 2 | ||||||
| 2026-02-13 | 13F | Public Employees Retirement Association Of Colorado | 35.268 | 0,00 | 0 | |||||
| 2026-02-13 | 13F | Morgan Stanley | 509.789 | 5,74 | 1.223 | -15,42 | ||||
| 2026-02-18 | 13F | GWM Advisors LLC | 151 | 0,00 | 0 | |||||
| 2026-02-05 | 13F | Accredited Investors Inc. | 15.721 | 0,00 | 38 | -21,28 | ||||
| 2026-02-14 | 13F | Rockefeller Capital Management L.P. | 0 | -100,00 | 0 |
Other Listings
| US:GPMT | 1,72 $ |