Grundlæggende statistik
| Institutionelle aktier (lange) | 4.666.110 - 28,28% (ex 13D/G) - change of 0,39MM shares 9,01% MRQ |
| Institutionel værdi (lang) | $ 87.616 USD ($1000) |
Institutionelt ejerskab og aktionærer
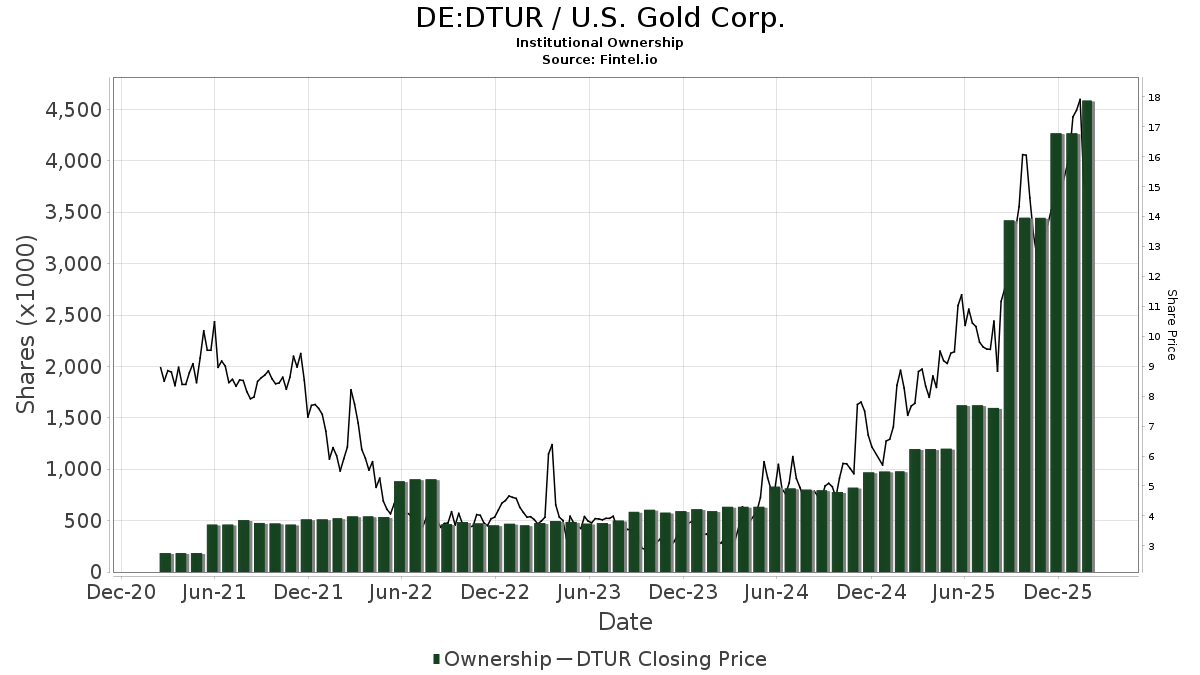
U.S. Gold Corp. (DE:DTUR) har 85 institutionelle ejere og aktionærer, der har indsendt 13D/G- eller 13F-formularer til Securities Exchange Commission (SEC). Disse institutioner har i alt 4,666,110 aktier. Største aktionærer omfatter Philadelphia Financial Management of San Francisco, LLC, Vanguard Group Inc, BlackRock, Inc., Millennium Management Llc, Geode Capital Management, Llc, State Street Corp, Goldman Sachs Group Inc, Citadel Advisors Llc, Northern Trust Corp, and Peak6 Llc .
U.S. Gold Corp. (DB:DTUR) institutionel ejerskabsstruktur viser aktuelle positioner i virksomheden efter institutioner og fonde, samt seneste ændringer i positionsstørrelse. Større aktionærer kan omfatte individuelle investorer, investeringsforeninger, hedgefonde eller institutioner. Skema 13D angiver, at investoren besidder (eller besidder) mere end 5 % af virksomheden og har til hensigt (eller har til hensigt at) aktivt at forfølge en ændring i forretningsstrategi. Skema 13G indikerer en passiv investering på over 5%.
The share price as of April 30, 2026 is 13,58 / share. Previously, on May 2, 2025, the share price was 8,97 / share. This represents an increase of 51,39% over that period.
Fondens stemningsscore
Fund Sentiment Score (fka Ownership Accumulation Score) finder de aktier, der bliver mest købt af fonde. Det er resultatet af en sofistikeret, multi-faktor kvantitativ model, der identificerer virksomheder med de højeste niveauer af institutionel akkumulering. Scoringsmodellen bruger en kombination af den samlede stigning i oplyste ejere, ændringerne i porteføljeallokeringer i disse ejere og andre målinger. Tallet går fra 0 til 100, hvor højere tal indikerer et højere niveau af akkumulering for sine jævnaldrende, og 50 er gennemsnittet.
Opdateringsfrekvens: Dagligt
Se Ownership Explorer, som giver en liste over højest rangerende virksomheder.
AI+ Ask Fintel’s AI assistant about U.S. Gold Corp..
Select a question to share a public post with an AI-crafted answer.
Thinking of good questions…
13F og NPORT arkivering
Detaljer om 13F-arkivering er gratis. Detaljer om NP-ansøgninger kræver et premium-medlemskab. Grønne rækker angiver nye positioner. Røde rækker angiver lukkede positioner. Klik på linket ikon for at se den fulde transaktionshistorik.
Opgrader
for at låse premium-data op og eksportere til Excel ![]() .
.
| Fil dato | Kilde | Investor | Type | Gennemsnitlig pris (Øst) |
Aktier | Δ Aktier (%) |
Rapporteret Værdi ($1000) |
Δ Værdi (%) |
Port Alloc (%) |
|
|---|---|---|---|---|---|---|---|---|---|---|
| 2026-02-09 | 13F | Legal & General Group Plc | 1.162 | -4,83 | 23 | 10,00 | ||||
| 2026-02-20 | 13F | Sunbelt Securities, Inc. | 750 | 36,36 | 15 | 55,56 | ||||
| 2026-04-15 | 13F | Fortitude Family Office, LLC | 198 | 48,87 | 3 | 50,00 | ||||
| 2026-02-13 | 13F | Squarepoint Ops LLC | 0 | -100,00 | 0 | |||||
| 2026-04-29 | 13F | Police & Firemen's Retirement System of New Jersey | 2.722 | 0,00 | 41 | -21,15 | ||||
| 2026-04-06 | 13F | GAMMA Investing LLC | 239 | 35,03 | 4 | 0,00 | ||||
| 2026-04-30 | 13F | Cambridge Investment Research Advisors, Inc. | 59.372 | -1,45 | 1 | -100,00 | ||||
| 2026-02-17 | 13F | Two Sigma Investments, Lp | 26.210 | -0,29 | 509 | 17,32 | ||||
| 2026-05-01 | 13F | International Assets Investment Management, Llc | 2.750 | 175,00 | 43 | 126,32 | ||||
| 2026-02-11 | 13F | Deutsche Bank Ag\ | 8.671 | -27,48 | 168 | -14,72 | ||||
| 2026-04-14 | 13F | Prospera Financial Services Inc | 43.900 | -2,98 | 667 | -24,15 | ||||
| 2026-04-07 | 13F | CoreCap Advisors, LLC | 14.520 | 2,11 | 221 | -20,29 | ||||
| 2026-01-28 | 13F | Universal- Beteiligungs- und Servicegesellschaft mbH | 24.000 | 0,00 | 471 | 18,99 | ||||
| 2026-02-06 | 13F | Gsa Capital Partners Llp | 29.092 | 1 | ||||||
| 2026-04-24 | 13F | Vision Financial Markets Llc | 70 | 0,00 | 1 | 0,00 | ||||
| 2026-02-11 | 13F | Jpmorgan Chase & Co | 4.744 | -4,76 | 92 | 12,20 | ||||
| 2025-11-13 | 13F | Marshall Wace, Llp | 0 | -100,00 | 0 | |||||
| 2026-02-10 | 13F | Bank of New York Mellon Corp | 24.593 | -1,49 | 477 | 16,06 | ||||
| 2026-02-17 | 13F | Advisor Group Holdings, Inc. | 1.176 | -44,68 | 23 | -26,67 | ||||
| 2026-02-13 | 13F | Ubs Asset Management Americas Inc | 472 | 9 | ||||||
| 2026-02-11 | 13F | Ameritas Investment Partners, Inc. | 1.124 | 22 | ||||||
| 2026-02-17 | 13F | Cetera Investment Advisers | 13.710 | -0,76 | 266 | 17,18 | ||||
| 2026-01-29 | 13F | UBS Group AG | 66.163 | 1,41 | 1.284 | 19,44 | ||||
| 2026-02-13 | 13F | National Bank Of Canada /fi/ | 0 | -100,00 | 0 | |||||
| 2026-02-04 | 13F | Ameritas Advisory Services, LLC | 0 | -100,00 | 0 | |||||
| 2026-02-17 | 13F | Alliancebernstein L.p. | 10.700 | 208 | ||||||
| 2026-04-24 | 13F | UMA Financial Services, Inc. | 141 | 0,00 | 2 | 0,00 | ||||
| 2026-02-13 | 13F | Quarry LP | 0 | -100,00 | 0 | |||||
| 2026-02-09 | 13F | Geode Capital Management, Llc | 286.848 | 3,17 | 5.569 | 21,51 | ||||
| 2026-02-10 | 13F | Bnp Paribas Arbitrage, Sa | 2.799 | 16,00 | 54 | 38,46 | ||||
| 2026-02-12 | 13F | EAM Investors, LLC | 44.974 | 873 | ||||||
| 2026-03-03 | 13F/A | Caitong International Asset Management Co., Ltd | 5.408 | 105 | ||||||
| 2026-04-22 | 13F | Atlantic Edge Private Wealth Management, LLC | 100 | 0,00 | 2 | 0,00 | ||||
| 2026-04-28 | 13F | SBI Securities Co., Ltd. | 0 | -100,00 | 0 | |||||
| 2026-02-17 | 13F | Occudo Quantitative Strategies Lp | 0 | -100,00 | 0 | |||||
| 2026-02-17 | 13F | MIRAE ASSET GLOBAL ETFS HOLDINGS Ltd. | 5.513 | -4,00 | 107 | 13,83 | ||||
| 2026-02-12 | 13F | CIBC Private Wealth Group, LLC | 2.000 | 39 | ||||||
| 2026-02-12 | 13F | BlackRock, Inc. | 667.768 | 3,99 | 12.961 | 22,48 | ||||
| 2026-04-30 | 13F | Private Trust Co Na | 1.000 | 0,00 | 15 | -21,05 | ||||
| 2026-02-17 | 13F | Quadrature Capital Ltd | 18.721 | 363 | ||||||
| 2026-02-13 | 13F | NewGen Asset Management Ltd | 80.000 | 1.553 | ||||||
| 2026-02-13 | 13F | State Street Corp | 237.407 | 0,43 | 4.608 | 18,31 | ||||
| 2025-11-07 | 13F | Beacon Capital Management, LLC | 0 | -100,00 | 0 | |||||
| 2026-02-12 | 13F | BRYN MAWR TRUST Co | 0 | -100,00 | 0 | -100,00 | ||||
| 2026-03-12 | 13F/A | Peak6 Llc | Call | 81.700 | 1.586 | |||||
| 2026-02-23 | 13F | Virtu Financial LLC | 23.745 | 0 | ||||||
| 2026-02-11 | 13F | Group One Trading, L.p. | 2.917 | 210,98 | 57 | 273,33 | ||||
| 2026-02-12 | 13F | Federated Hermes, Inc. | 107 | 0,00 | 2 | 100,00 | ||||
| 2026-02-17 | 13F | Millennium Management Llc | 343.204 | 51,36 | 6.662 | 78,29 | ||||
| 2026-02-13 | 13F | Sei Investments Co | 34.460 | 669 | ||||||
| 2026-02-10 | 13F | Quantbot Technologies LP | 4.539 | -77,50 | 88 | -73,49 | ||||
| 2026-02-11 | 13F | Los Angeles Capital Management Llc | 70.644 | 1.099 | ||||||
| 2025-11-12 | 13F | Simplex Trading, Llc | 0 | -100,00 | 0 | |||||
| 2026-02-17 | 13F | Citadel Advisors Llc | Call | 30.200 | -54,72 | 586 | -46,68 | |||
| 2026-02-17 | 13F | Philadelphia Financial Management of San Francisco, LLC | 1.209.624 | 41,03 | 23.479 | 66,10 | ||||
| 2026-02-17 | 13F | Citadel Advisors Llc | Put | 90.500 | -18,47 | 1.757 | -3,99 | |||
| 2026-02-17 | 13F | Citadel Advisors Llc | 21.421 | -58,44 | 416 | -51,12 | ||||
| 2026-04-23 | 13F | J.w. Cole Advisors, Inc. | 11.495 | 175 | ||||||
| 2026-04-13 | 13F | Massmutual Trust Co Fsb/adv | 34 | -24,44 | 1 | |||||
| 2026-02-13 | 13F | Citigroup Inc | 2.724 | 398,90 | 53 | 550,00 | ||||
| 2026-01-26 | 13F | Cwm, Llc | 33 | 0,00 | 0 | |||||
| 2026-02-09 | 13F | Harbour Investments, Inc. | 6 | 0,00 | 0 | |||||
| 2026-02-12 | 13F | Dimensional Fund Advisors Lp | 0 | -100,00 | 0 | |||||
| 2026-02-13 | 13F | Barclays Plc | 18.521 | 4,66 | 359 | 23,37 | ||||
| 2026-02-13 | 13F | SRS Capital Advisors, Inc. | 0 | -100,00 | 0 | |||||
| 2026-02-13 | 13F | Morgan Stanley | 71.567 | -20,44 | 1.389 | -6,28 | ||||
| 2026-04-24 | 13F | Strs Ohio | 400 | 0,00 | 6 | -14,29 | ||||
| 2026-02-13 | 13F | Charles Schwab Investment Management Inc | 37.581 | -0,83 | 729 | 16,83 | ||||
| 2026-02-06 | 13F | Pnc Financial Services Group, Inc. | 60 | -41,75 | 1 | 0,00 | ||||
| 2026-02-12 | 13F | MetLife Investment Management, LLC | 7.651 | 0,00 | 149 | 17,46 | ||||
| 2026-01-28 | 13F | N.E.W. Advisory Services LLC | 200 | 0,00 | 4 | 0,00 | ||||
| 2026-04-20 | 13F | Up Capital Management, Inc. | 0 | -100,00 | 0 | |||||
| 2026-02-10 | 13F | Goldman Sachs Group Inc | 177.993 | 334,30 | 3.455 | 411,70 | ||||
| 2026-02-17 | 13F | Bank Of America Corp /de/ | 10.464 | 43,19 | 203 | 69,17 | ||||
| 2026-02-17 | 13F | Susquehanna International Group, Llp | 22.976 | 446 | ||||||
| 2026-02-17 | 13F | Susquehanna International Group, Llp | Put | 35.700 | 224,55 | 693 | 282,32 | |||
| 2026-02-12 | 13F | Sprott Inc. | 0 | -100,00 | 0 | |||||
| 2026-04-08 | 13F | Arlington Trust Co LLC | 17 | 0 | ||||||
| 2026-02-17 | 13F | Susquehanna International Group, Llp | Call | 62.900 | -30,80 | 1.221 | -18,56 | |||
| 2026-02-17 | 13F | California State Teachers Retirement System | 732 | 6,40 | 14 | 27,27 | ||||
| 2026-04-23 | 13F | North Star Investment Management Corp. | 30 | 0 | ||||||
| 2026-02-13 | 13F | Wells Fargo & Company/mn | 16.859 | 47,10 | 327 | 73,94 | ||||
| 2026-02-17 | 13F | Royal Bank Of Canada | 334 | 97,63 | 6 | 100,00 | ||||
| 2025-11-14 | 13F | Raymond James Financial Inc | 0 | -100,00 | 0 | |||||
| 2026-02-17 | 13F | Fmr Llc | 6.591 | 108,11 | 128 | 144,23 | ||||
| 2026-02-17 | 13F | Schonfeld Strategic Advisors LLC | 0 | -100,00 | 0 | |||||
| 2026-04-30 | 13F | Nuveen, LLC | 21.084 | 0,00 | 320 | -21,76 | ||||
| 2026-02-17 | 13F | Jones Financial Companies Lllp | 1.067 | 0,47 | 21 | 17,65 | ||||
| 2026-04-21 | 13F | Financial Consulate, Inc | 1.000 | 0,00 | 15 | -21,05 | ||||
| 2026-01-29 | 13F | Vanguard Group Inc | 682.141 | 5,12 | 13.240 | 23,81 | ||||
| 2026-02-10 | 13F/A | Northwestern Mutual Wealth Management Co | 5 | 0 | ||||||
| 2025-11-14 | 13F | Engineers Gate Manager LP | 0 | -100,00 | 0 | -100,00 | ||||
| 2025-11-14 | 13F | Wolverine Trading, Llc | 11.219 | 177 | ||||||
| 2025-11-14 | 13F | Wolverine Trading, Llc | Call | 15.000 | 0,67 | 237 | 30,94 | |||
| 2026-02-12 | 13F | Jane Street Group, Llc | 51.202 | 79,51 | 994 | 111,28 | ||||
| 2026-02-05 | 13F | Amalgamated Bank | 373 | -0,80 | 0 | |||||
| 2026-02-13 | 13F | Rhumbline Advisers | 13.992 | -11,77 | 272 | 3,83 | ||||
| 2026-02-12 | 13F | New York State Common Retirement Fund | 4.500 | -23,73 | 88 | -7,37 | ||||
| 2026-02-11 | 13F | Rise Advisors, LLC | 0 | -100,00 | 0 | |||||
| 2026-02-12 | 13F | Steward Partners Investment Advisory, Llc | 700 | 0,00 | 14 | 18,18 | ||||
| 2026-04-13 | 13F | IFP Advisors, Inc | 10 | 0 | ||||||
| 2026-04-22 | 13F | Sterling Capital Management LLC | 80 | 0,00 | 1 | 0,00 | ||||
| 2026-04-27 | 13F | Evolution Wealth Management Inc. | 1.400 | 0,00 | 21 | -22,22 | ||||
| 2026-02-17 | 13F | Russell Investments Group, Ltd. | 1.156 | -79,39 | 22 | -76,09 | ||||
| 2026-02-17 | 13F | Northern Trust Corp | 87.989 | -9,99 | 1.708 | 6,02 | ||||
| 2026-05-01 | 13F | Trifecta Capital Advisors, LLC | 250 | -91,67 | 4 | -94,83 | ||||
| 2026-02-17 | 13F | Tower Research Capital LLC (TRC) | 1.346 | 100,60 | 26 | 136,36 | ||||
| 2026-02-17 | 13F | Parvin Asset Management, LLC | 650 | 100,00 | 13 | 140,00 |