Grundlæggende statistik
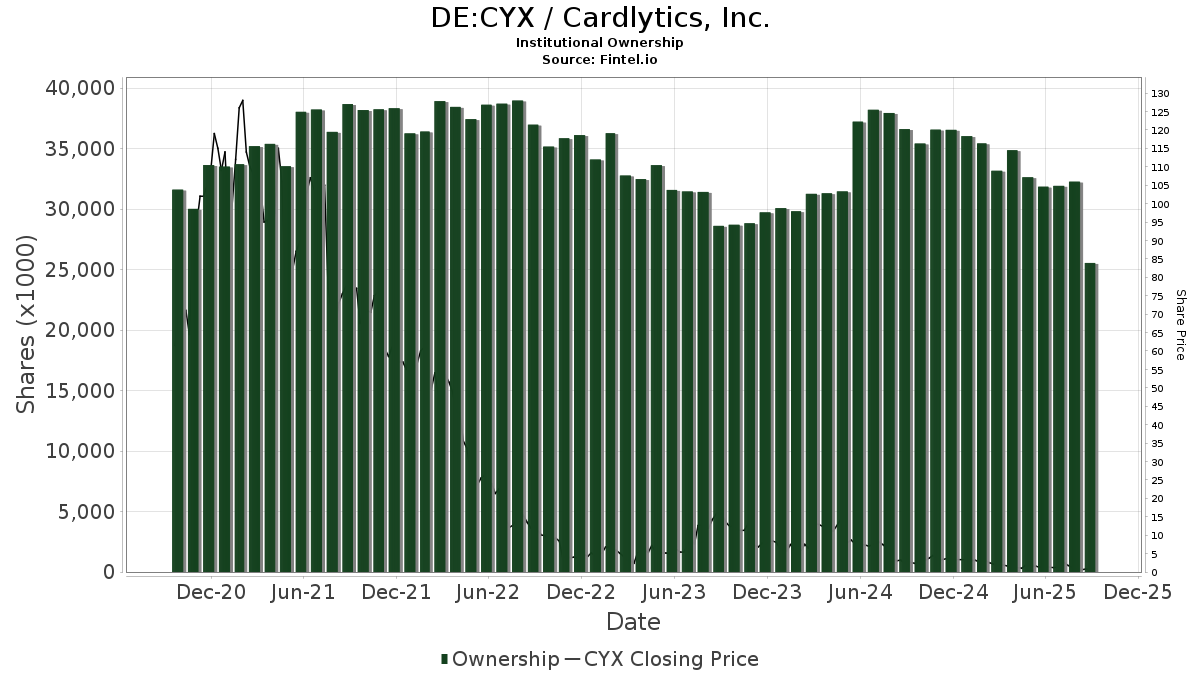
| Institutionelle aktier (lange) | 21.863.411 - 39,71% (ex 13D/G) - change of -1,37MM shares -5,90% MRQ |
| Institutionel værdi (lang) | $ 24.545 USD ($1000) |
Institutionelt ejerskab og aktionærer
Cardlytics, Inc. (DE:CYX) har 74 institutionelle ejere og aktionærer, der har indsendt 13D/G- eller 13F-formularer til Securities Exchange Commission (SEC). Disse institutioner har i alt 21,863,411 aktier. Største aktionærer omfatter CAS Investment Partners, LLC, Vanguard Group Inc, Bank Of America Corp /de/, 683 Capital Management, LLC, KPS Global Asset Management UK Ltd, Worldly Partners Management, Llc, BlackRock, Inc., RBF Capital, LLC, Jane Street Group, Llc, and Geode Capital Management, Llc .
Cardlytics, Inc. (DB:CYX) institutionel ejerskabsstruktur viser aktuelle positioner i virksomheden efter institutioner og fonde, samt seneste ændringer i positionsstørrelse. Større aktionærer kan omfatte individuelle investorer, investeringsforeninger, hedgefonde eller institutioner. Skema 13D angiver, at investoren besidder (eller besidder) mere end 5 % af virksomheden og har til hensigt (eller har til hensigt at) aktivt at forfølge en ændring i forretningsstrategi. Skema 13G indikerer en passiv investering på over 5%.
The share price as of March 30, 2026 is 0,75 / share. Previously, on April 1, 2025, the share price was 1,53 / share. This represents a decline of 50,62% over that period.
Fondens stemningsscore
Fund Sentiment Score (fka Ownership Accumulation Score) finder de aktier, der bliver mest købt af fonde. Det er resultatet af en sofistikeret, multi-faktor kvantitativ model, der identificerer virksomheder med de højeste niveauer af institutionel akkumulering. Scoringsmodellen bruger en kombination af den samlede stigning i oplyste ejere, ændringerne i porteføljeallokeringer i disse ejere og andre målinger. Tallet går fra 0 til 100, hvor højere tal indikerer et højere niveau af akkumulering for sine jævnaldrende, og 50 er gennemsnittet.
Opdateringsfrekvens: Dagligt
Se Ownership Explorer, som giver en liste over højest rangerende virksomheder.
AI+ Ask Fintel’s AI assistant about Cardlytics, Inc..
Select a question to share a public post with an AI-crafted answer.
Thinking of good questions…
13F og NPORT arkivering
Detaljer om 13F-arkivering er gratis. Detaljer om NP-ansøgninger kræver et premium-medlemskab. Grønne rækker angiver nye positioner. Røde rækker angiver lukkede positioner. Klik på linket ikon for at se den fulde transaktionshistorik.
Opgrader
for at låse premium-data op og eksportere til Excel ![]() .
.
| Fil dato | Kilde | Investor | Type | Gennemsnitlig pris (Øst) |
Aktier | Δ Aktier (%) |
Rapporteret Værdi ($1000) |
Δ Værdi (%) |
Port Alloc (%) |
|
|---|---|---|---|---|---|---|---|---|---|---|
| 2026-02-06 | 13F | Gsa Capital Partners Llp | 470.350 | 313,03 | 1 | |||||
| 2026-02-13 | 13F | Walleye Trading LLC | Put | 0 | -100,00 | 0 | ||||
| 2026-02-13 | 13F | Walleye Trading LLC | 0 | -100,00 | 0 | |||||
| 2026-02-11 | 13F | Simplex Trading, Llc | 186.379 | -27,01 | 214 | |||||
| 2026-02-11 | 13F | Simplex Trading, Llc | Call | 114.300 | -47,16 | 131 | ||||
| 2026-02-13 | 13F | Fifth Lane Capital, Lp | 0 | -100,00 | 0 | |||||
| 2026-02-11 | 13F | Simplex Trading, Llc | Put | 38.200 | -81,22 | 44 | ||||
| 2026-01-29 | 13F | Sanctuary Advisors, LLC | 0 | -100,00 | 0 | -100,00 | ||||
| 2026-02-19 | 13F | Invesco Ltd. | 170.122 | 38,14 | 196 | -34,78 | ||||
| 2025-11-14 | 13F | Squarepoint Ops LLC | 0 | -100,00 | 0 | |||||
| 2026-02-17 | 13F | Two Sigma Securities, Llc | 36.553 | 42 | ||||||
| 2026-01-16 | 13F | FNY Investment Advisers, LLC | Call | 0 | -100,00 | 0 | ||||
| 2026-01-27 | 13F | Summit Financial Strategies, Inc. | 14.000 | 0,00 | 16 | -52,94 | ||||
| 2026-02-17 | 13F | Raymond James Financial Inc | 163.077 | 22,38 | 188 | -42,11 | ||||
| 2026-02-17 | 13F | G2 Investment Partners Management LLC | 0 | -100,00 | 0 | |||||
| 2026-01-30 | 13F | Us Bancorp \de\ | 2.692 | -20,89 | 3 | -62,50 | ||||
| 2025-11-12 | 13F | Sand Hill Global Advisors, LLC | 0 | -100,00 | 0 | -100,00 | ||||
| 2026-02-12 | 13F | Dimensional Fund Advisors Lp | 127.228 | -38,96 | 146 | -71,15 | ||||
| 2026-02-13 | 13F | Brown Advisory Inc | 107.603 | -8,50 | 124 | -56,84 | ||||
| 2025-11-14 | 13F | Mirabella Financial Services Llp | 0 | -100,00 | 0 | |||||
| 2026-02-17 | 13F | 683 Capital Management, LLC | 1.400.100 | 19,16 | 1.610 | -43,61 | ||||
| 2025-11-06 | 13F | Ground Swell Capital, LLC | 0 | -100,00 | 0 | -100,00 | ||||
| 2026-02-17 | 13F | D. E. Shaw & Co., Inc. | 26.206 | -71,23 | 30 | -86,43 | ||||
| 2026-02-17 | 13F | Advisor Group Holdings, Inc. | 31.008 | -5,53 | 36 | -59,30 | ||||
| 2026-02-13 | 13F | Citigroup Inc | 0 | -100,00 | 0 | |||||
| 2026-02-11 | 13F | LPL Financial LLC | 445.387 | -5,26 | 512 | -55,17 | ||||
| 2026-02-17 | 13F | Bank Of America Corp /de/ | 1.460.042 | -10,58 | 1.679 | -57,68 | ||||
| 2026-02-17 | 13F | Qube Research & Technologies Ltd | 191.762 | 751,63 | 221 | 307,41 | ||||
| 2026-02-12 | 13F | Jane Street Group, Llc | Put | 0 | -100,00 | 0 | -100,00 | |||
| 2025-10-31 | 13F | Y-Intercept (Hong Kong) Ltd | 0 | -100,00 | 0 | |||||
| 2026-02-03 | 13F | SBI Securities Co., Ltd. | 20 | 0,00 | 0 | |||||
| 2025-11-10 | 13F | Charles Schwab Investment Management Inc | 0 | -100,00 | 0 | -100,00 | ||||
| 2025-11-12 | 13F | Catalyst Funds Management Pty Ltd | 0 | -100,00 | 0 | |||||
| 2026-02-23 | 13F | Virtu Financial LLC | 34.256 | 0 | ||||||
| 2026-02-11 | 13F | Group One Trading, L.p. | Put | 39.000 | -59,16 | 45 | -81,03 | |||
| 2026-02-17 | 13F | Susquehanna International Group, Llp | Put | 143.400 | -18,15 | 165 | -61,41 | |||
| 2026-02-11 | 13F | Group One Trading, L.p. | Call | 388.100 | -16,50 | 446 | -60,50 | |||
| 2026-02-17 | 13F | Susquehanna International Group, Llp | Call | 533.800 | -17,53 | 614 | -61,01 | |||
| 2025-11-07 | 13F | Rialto Wealth Management, LLC | 0 | -100,00 | 0 | |||||
| 2026-02-11 | 13F | Group One Trading, L.p. | 48.334 | -59,01 | 56 | -80,77 | ||||
| 2026-02-17 | 13F | Susquehanna International Group, Llp | 137.867 | 29,52 | 159 | -38,76 | ||||
| 2025-11-14 | 13F | Two Sigma Advisers, Lp | 0 | -100,00 | 0 | |||||
| 2026-02-17 | 13F | Algert Global Llc | 41.330 | 0,00 | 0 | |||||
| 2026-02-17 | 13F | Bridgeway Capital Management Inc | 75.758 | -25,73 | 87 | -64,78 | ||||
| 2026-01-12 | 13F | Thompson Davis & Co., Inc. | 11.321 | -75,05 | 13 | -89,19 | ||||
| 2026-01-16 | 13F | FNY Investment Advisers, LLC | 0 | -100,00 | 0 | |||||
| 2026-02-13 | 13F | Walleye Trading LLC | Call | 0 | -100,00 | 0 | ||||
| 2025-11-13 | 13F | Landscape Capital Management, L.l.c. | 0 | -100,00 | 0 | -100,00 | ||||
| 2026-02-13 | 13F | Worldly Partners Management, Llc | 1.157.989 | 0,00 | 1.332 | -52,68 | ||||
| 2025-10-21 | 13F | True Wealth Design, LLC | 0 | -100,00 | 0 | |||||
| 2026-02-17 | 13F | Anson Funds Management LP | Call | 0 | -100,00 | 0 | ||||
| 2026-02-09 | 13F | Geode Capital Management, Llc | 654.472 | 3,30 | 753 | -51,17 | ||||
| 2026-02-17 | 13F/A | RBF Capital, LLC | 800.103 | 0,00 | 920 | -52,67 | ||||
| 2026-02-17 | 13F | Citadel Advisors Llc | 55.578 | -55,63 | 64 | -79,28 | ||||
| 2026-02-10 | 13F | Goldman Sachs Group Inc | 109.001 | 15,07 | 125 | -45,65 | ||||
| 2026-02-17 | 13F | Citadel Advisors Llc | Call | 259.600 | -29,26 | 299 | -66,55 | |||
| 2026-02-12 | 13F | BlackRock, Inc. | 966.223 | -0,55 | 1.111 | -52,92 | ||||
| 2026-02-17 | 13F | Citadel Advisors Llc | Put | 152.500 | -60,14 | 175 | -81,16 | |||
| 2026-02-19 | 13F | CI Private Wealth, LLC | 11.500 | 15,00 | 12 | -54,17 | ||||
| 2025-11-14 | 13F | Jain Global LLC | 0 | -100,00 | 0 | |||||
| 2026-02-06 | 13F | EverSource Wealth Advisors, LLC | 1.208 | 1 | ||||||
| 2025-11-14 | 13F | Tudor Investment Corp Et Al | 0 | -100,00 | 0 | |||||
| 2026-01-29 | 13F | Vanguard Group Inc | 2.609.787 | 8,68 | 3.001 | -48,57 | ||||
| 2026-02-04 | 13F | Pensionmark Financial Group, Llc | Call | 0 | ||||||
| 2026-02-13 | 13F | MAI Capital Management | 0 | -100,00 | 0 | |||||
| 2026-02-17 | 13F | Optiver Holding B.V. | 0 | -100,00 | 0 | |||||
| 2026-02-17 | 13F | Creative Planning | 18.515 | 0,00 | 21 | -52,27 | ||||
| 2026-01-20 | 13F | Signaturefd, Llc | 524 | 0,00 | 1 | -100,00 | ||||
| 2026-02-09 | 13F | Jefferies Financial Group Inc. | 86.150 | 0,00 | 99 | -52,63 | ||||
| 2025-11-07 | 13F | Brooktree Capital Management | 0 | -100,00 | 0 | |||||
| 2026-02-13 | 13F | Walleye Capital LLC | 10.752 | 12 | ||||||
| 2026-02-17 | 13F | CAS Investment Partners, LLC | 5.198.067 | 0,00 | 5.978 | -52,68 | ||||
| 2026-02-17 | 13F | Two Sigma Investments, Lp | 283.747 | 125,31 | 326 | 6,54 | ||||
| 2026-03-26 | 13F | Leonteq Securities AG | 0 | -100,00 | 0 | |||||
| 2026-02-12 | 13F | Federation des caisses Desjardins du Quebec | 200 | 0,00 | 0 | |||||
| 2026-02-13 | 13F | Morgan Stanley | 3.727 | -99,24 | 4 | -99,66 | ||||
| 2026-01-09 | 13F | Post Resch Tallon Group Inc. | 20.000 | 0,00 | 23 | -52,08 | ||||
| 2025-11-14 | 13F | DRW Securities, LLC | 0 | -100,00 | 0 | -100,00 | ||||
| 2025-10-08 | 13F/A | New York State Common Retirement Fund | 0 | -100,00 | 0 | -100,00 | ||||
| 2026-02-13 | 13F | Destination Wealth Management | 0 | -100,00 | 0 | |||||
| 2026-02-17 | 13F | Royal Bank Of Canada | 442 | -99,77 | 0 | -100,00 | ||||
| 2026-02-06 | 13F | Covestor Ltd | 21 | 0,00 | 0 | |||||
| 2026-02-10 | 13F/A | Northwestern Mutual Wealth Management Co | 10 | 0 | ||||||
| 2026-02-12 | 13F | Jane Street Group, Llc | 658.784 | -17,62 | 758 | -61,04 | ||||
| 2026-02-13 | 13F | Jacobs Levy Equity Management, Inc | 638.617 | 734 | ||||||
| 2026-02-12 | 13F | Jane Street Group, Llc | Call | 67.600 | 397,06 | 78 | 133,33 | |||
| 2026-02-02 | 13F | Wolverine Asset Management Llc | Put | 125.000 | -50,04 | 144 | -76,44 | |||
| 2026-02-13 | 13F | JustInvest LLC | 0 | -100,00 | 0 | |||||
| 2026-02-17 | 13F | Fmr Llc | 9.929 | 23,43 | 11 | -42,11 | ||||
| 2026-02-13 | 13F | Quinn Opportunity Partners LLC | 462.402 | -57,96 | 532 | -80,13 | ||||
| 2025-11-14 | 13F | Price T Rowe Associates Inc /md/ | 0 | -100,00 | 0 | |||||
| 2026-02-17 | 13F | Tower Research Capital LLC (TRC) | 0 | -100,00 | 0 | |||||
| 2026-02-13 | 13F | Wells Fargo & Company/mn | 1.300 | 0,00 | 1 | -66,67 | ||||
| 2026-02-17 | 13F | Millennium Management Llc | 254.737 | -32,74 | 293 | -68,26 | ||||
| 2026-01-23 | 13F | Farther Finance Advisors, LLC | 40 | 0,00 | 0 | |||||
| 2026-02-06 | 13F | Bare Financial Services, Inc | 0 | -100,00 | 0 | |||||
| 2026-02-17 | 13F | Jump Financial, LLC | 12.600 | 14 | ||||||
| 2026-02-13 | 13F | State Street Corp | 227.731 | 0,00 | 262 | -52,80 | ||||
| 2025-11-14 | 13F | Point72 (DIFC) Ltd | 229 | 0,88 | 1 | |||||
| 2026-02-11 | 13F | Hughes Financial Services, LLC | 0 | -100,00 | 0 | |||||
| 2026-02-13 | 13F | Barclays Plc | 55.969 | -3,54 | 64 | -65,41 | ||||
| 2025-11-13 | 13F | Hudson Bay Capital Management LP | 0 | -100,00 | 0 | |||||
| 2026-02-13 | 13F | Centiva Capital, LP | 17.427 | -59,46 | 20 | -80,77 | ||||
| 2026-02-06 | 13F | Global Retirement Partners, LLC | 45.300 | 30,17 | 52 | -38,10 | ||||
| 2026-02-17 | 13F | Lighthouse Investment Partners, LLC | 36.563 | 0,00 | 42 | -52,27 | ||||
| 2026-02-13 | 13F | Walleye Capital LLC | Put | 0 | -100,00 | 0 | -100,00 | |||
| 2026-02-12 | 13F | Federated Hermes, Inc. | 0 | -100,00 | 0 | |||||
| 2025-10-23 | 13F | Nisa Investment Advisors, Llc | 0 | -100,00 | 0 | |||||
| 2026-01-15 | 13F | Fortitude Family Office, LLC | 0 | -100,00 | 0 | |||||
| 2025-11-13 | 13F | Hsbc Holdings Plc | 0 | -100,00 | 0 | -100,00 | ||||
| 2025-11-14 | 13F | Hrt Financial Lp | 0 | -100,00 | 0 | |||||
| 2025-11-13 | 13F | Russell Investments Group, Ltd. | 0 | -100,00 | 0 | -100,00 | ||||
| 2026-02-10 | 13F | Bnp Paribas Arbitrage, Sa | 20 | -91,60 | 0 | |||||
| 2026-03-03 | 13F/A | Caitong International Asset Management Co., Ltd | 70 | 0 | ||||||
| 2026-02-03 | 13F | Acorn Financial Advisory Services Inc /adv | 119.933 | -1,18 | 138 | -53,40 | ||||
| 2026-02-17 | 13F | Scientech Research LLC | 29.207 | 34 | ||||||
| 2026-01-29 | 13F | Warren Street Wealth Advisors, LLC | 12.947 | 0,00 | 15 | -54,84 | ||||
| 2026-01-30 | 13F | Citizens Financial Group Inc/ri | 483.000 | -6,88 | 555 | -55,95 | ||||
| 2026-02-17 | 13F | Engineers Gate Manager LP | 0 | -100,00 | 0 | |||||
| 2026-01-29 | 13F | UBS Group AG | 185.751 | -59,45 | 214 | -80,86 | ||||
| 2025-11-13 | 13F | Deutsche Bank Ag\ | 0 | -100,00 | 0 | |||||
| 2026-02-17 | 13F | XTX Topco Ltd | 12.184 | -59,78 | 14 | -80,82 | ||||
| 2025-11-14 | 13F | Wolverine Trading, Llc | 27.094 | 72 | ||||||
| 2025-11-06 | 13F | Check Capital Management Inc/ca | 0 | -100,00 | 0 | |||||
| 2025-11-14 | 13F | Wolverine Trading, Llc | Call | 68.300 | 180 | |||||
| 2026-02-06 | 13F | GPS Wealth Strategies Group, LLC | 300 | 0,00 | 0 | |||||
| 2025-11-04 | 13F | Lane Generational LLC | 0 | -100,00 | 0 | |||||
| 2025-11-14 | 13F | Wolverine Trading, Llc | Put | 23.500 | 62 | |||||
| 2026-02-17 | 13F | Private Advisor Group, LLC | 0 | -100,00 | 0 | |||||
| 2026-02-12 | 13F | Renaissance Technologies Llc | 54.000 | 62 | ||||||
| 2026-02-17 | 13F | Voleon Capital Management Lp | 0 | -100,00 | 0 | |||||
| 2026-02-13 | 13F | KPS Global Asset Management UK Ltd | 1.218.830 | 0,00 | 1.402 | -52,68 | ||||
| 2026-02-14 | 13F | Rockefeller Capital Management L.P. | 2.250 | -60,18 | 3 | -84,62 | ||||
| 2025-11-03 | 13F | LRI Investments, LLC | 0 | -100,00 | 0 | |||||
| 2026-02-17 | 13F | Boothbay Fund Management, Llc | 0 | -100,00 | 0 | |||||
| 2025-10-15 | 13F | Cwm, Llc | 0 | -100,00 | 0 | |||||
| 2026-02-17 | 13F | Northern Trust Corp | 111.814 | -1,29 | 129 | -53,45 | ||||
| 2026-02-11 | 13F | United Financial Planning Group LLC | 175 | 0 | ||||||
| 2025-11-14 | 13F | Point72 Asia (Singapore) Pte. Ltd. | 14.797 | -49,63 | 36 | -27,08 | ||||
| 2026-02-17 | 13F | Sender Co & Partners, Inc. | 0 | -100,00 | 0 | |||||
| 2025-11-13 | 13F | Marshall Wace, Llp | 0 | -100,00 | 0 |