Grundlæggende statistik
| Institutionelle aktier (lange) | 8.136.242 - 21,69% (ex 13D/G) - change of 1,22MM shares 17,72% MRQ |
| Institutionel værdi (lang) | $ 259.449 USD ($1000) |
Institutionelt ejerskab og aktionærer
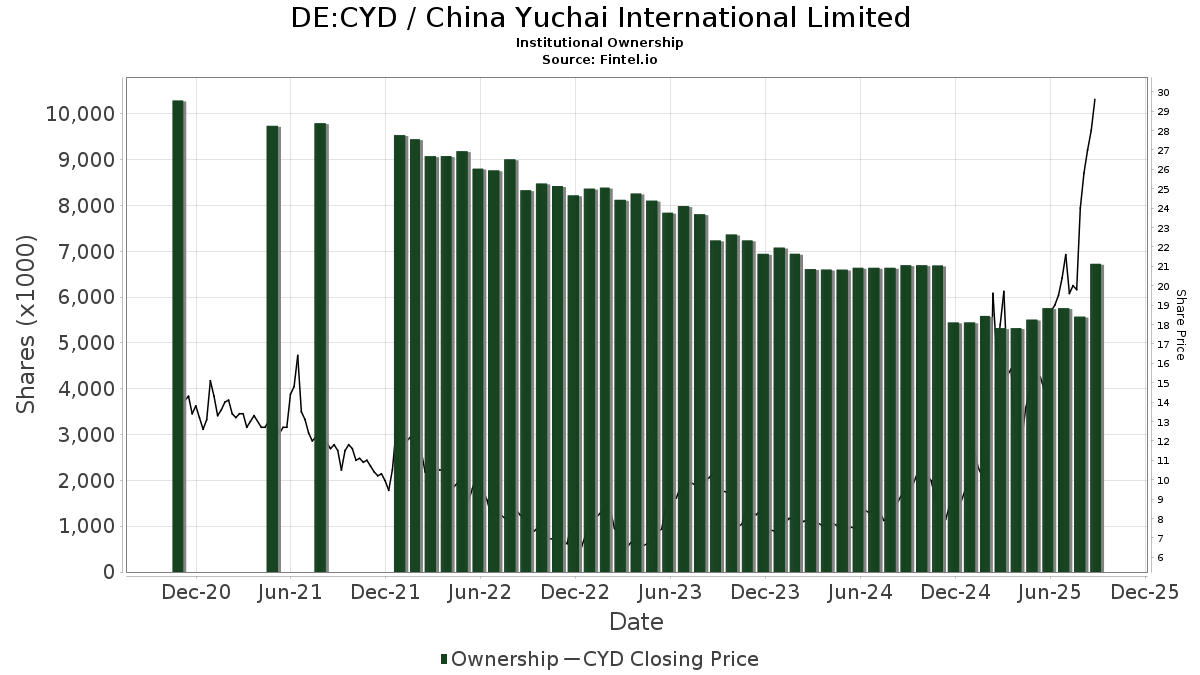
China Yuchai International Limited (DE:CYD) har 109 institutionelle ejere og aktionærer, der har indsendt 13D/G- eller 13F-formularer til Securities Exchange Commission (SEC). Disse institutioner har i alt 8,136,242 aktier. Største aktionærer omfatter Shah Capital Management, Acadian Asset Management Llc, Point72 Asset Management, L.P., Millennium Management Llc, UBS Group AG, Point72 Hong Kong Ltd, Arrowstreet Capital, Limited Partnership, Renaissance Technologies Llc, Connor, Clark & Lunn Investment Management Ltd., and Tudor Investment Corp Et Al .
China Yuchai International Limited (DB:CYD) institutionel ejerskabsstruktur viser aktuelle positioner i virksomheden efter institutioner og fonde, samt seneste ændringer i positionsstørrelse. Større aktionærer kan omfatte individuelle investorer, investeringsforeninger, hedgefonde eller institutioner. Skema 13D angiver, at investoren besidder (eller besidder) mere end 5 % af virksomheden og har til hensigt (eller har til hensigt at) aktivt at forfølge en ændring i forretningsstrategi. Skema 13G indikerer en passiv investering på over 5%.
The share price as of March 27, 2026 is 32,20 / share. Previously, on March 31, 2025, the share price was 15,80 / share. This represents an increase of 103,80% over that period.
Fondens stemningsscore
Fund Sentiment Score (fka Ownership Accumulation Score) finder de aktier, der bliver mest købt af fonde. Det er resultatet af en sofistikeret, multi-faktor kvantitativ model, der identificerer virksomheder med de højeste niveauer af institutionel akkumulering. Scoringsmodellen bruger en kombination af den samlede stigning i oplyste ejere, ændringerne i porteføljeallokeringer i disse ejere og andre målinger. Tallet går fra 0 til 100, hvor højere tal indikerer et højere niveau af akkumulering for sine jævnaldrende, og 50 er gennemsnittet.
Opdateringsfrekvens: Dagligt
Se Ownership Explorer, som giver en liste over højest rangerende virksomheder.
AI+ Ask Fintel’s AI assistant about China Yuchai International Limited.
Select a question to share a public post with an AI-crafted answer.
Thinking of good questions…
13F og NPORT arkivering
Detaljer om 13F-arkivering er gratis. Detaljer om NP-ansøgninger kræver et premium-medlemskab. Grønne rækker angiver nye positioner. Røde rækker angiver lukkede positioner. Klik på linket ikon for at se den fulde transaktionshistorik.
Opgrader
for at låse premium-data op og eksportere til Excel ![]() .
.
| Fil dato | Kilde | Investor | Type | Gennemsnitlig pris (Øst) |
Aktier | Δ Aktier (%) |
Rapporteret Værdi ($1000) |
Δ Værdi (%) |
Port Alloc (%) |
|
|---|---|---|---|---|---|---|---|---|---|---|
| 2026-01-23 | 13F | Farther Finance Advisors, LLC | 250 | 9 | ||||||
| 2026-02-11 | 13F | Jpmorgan Chase & Co | 99.040 | 16.772,23 | 3.516 | 14.545,83 | ||||
| 2026-02-13 | 13F | Y-Intercept (Hong Kong) Ltd | 17.993 | 37,11 | 639 | 17,71 | ||||
| 2026-01-15 | 13F | Burns Matteson Capital Management, LLC | 10.544 | 11,98 | 374 | -3,86 | ||||
| 2026-01-23 | 13F | Robeco Institutional Asset Management B.V. | 17.497 | 0,00 | 621 | -14,11 | ||||
| 2026-02-12 | 13F | Loomis Sayles & Co L P | 600 | 21 | ||||||
| 2026-02-17 | 13F | Royal Bank Of Canada | 25 | 56,25 | 1 | 0,00 | ||||
| 2026-01-22 | 13F | Personal Cfo Solutions, Llc | 10.275 | 5,26 | 365 | -9,68 | ||||
| 2026-02-10 | 13F | Acadian Asset Management Llc | 854.591 | 71,76 | 30 | 50,00 | ||||
| 2026-02-12 | 13F | Quadrant Capital Group Llc | 4.148 | -3,47 | 147 | -16,95 | ||||
| 2026-02-17 | 13F | Citadel Advisors Llc | Put | 0 | -100,00 | 0 | -100,00 | |||
| 2026-02-04 | 13F | Dogwood Wealth Management LLC | 47 | 2 | ||||||
| 2026-01-30 | 13F | Precision Wealth Strategies, LLC | 25.297 | 898 | ||||||
| 2026-02-13 | 13F | Sei Investments Co | 34.623 | 67,16 | 1.229 | 43,57 | ||||
| 2026-02-13 | 13F | Polymer Capital Management (HK) LTD | 0 | -100,00 | 0 | |||||
| 2026-02-17 | 13F | Wiley Bros.-aintree Capital, Llc | 5.744 | 1,02 | 204 | -13,98 | ||||
| 2026-02-13 | 13F | Verition Fund Management LLC | 25.431 | -14,21 | 903 | -26,43 | ||||
| 2026-02-17 | 13F | Advisory Services Network, LLC | 0 | -100,00 | 0 | |||||
| 2026-02-03 | 13F | SBI Securities Co., Ltd. | 31 | -69,31 | 1 | -75,00 | ||||
| 2026-02-05 | 13F | Atria Investments Llc | 15.754 | 0,60 | 559 | -13,60 | ||||
| 2026-02-17 | 13F | Engineers Gate Manager LP | 9.248 | 328 | ||||||
| 2026-02-03 | 13F | Diversify Wealth Management, Llc | 54.107 | 8,00 | 2.340 | 24,73 | ||||
| 2026-02-17 | 13F | Balyasny Asset Management Llc | 93.938 | 8,78 | 3.335 | -6,66 | ||||
| 2026-01-23 | 13F | Ritholtz Wealth Management | 10.113 | 359 | ||||||
| 2026-02-13 | 13F | Wells Fargo & Company/mn | 1 | -99,99 | 0 | -100,00 | ||||
| 2026-02-17 | 13F | Tudor Investment Corp Et Al | 193.555 | 25,34 | 6.871 | 7,56 | ||||
| 2026-02-17 | 13F | Northern Trust Corp | 14.378 | 510 | ||||||
| 2026-01-14 | 13F | ORG Wealth Partners, LLC | 207 | 6,15 | 7 | -12,50 | ||||
| 2025-10-23 | 13F | E Fund Management (Hong Kong) Co., Ltd. | 0 | -100,00 | 0 | |||||
| 2026-02-12 | 13F | Counterpoint Mutual Funds LLC | 0 | -100,00 | 0 | |||||
| 2026-02-13 | 13F | Macquarie Group Ltd | 0 | -100,00 | 0 | |||||
| 2026-02-17 | 13F | Citadel Advisors Llc | 133.913 | 47,84 | 4.754 | 26,85 | ||||
| 2026-02-10 | 13F | Envestnet Asset Management Inc | 77.002 | 0,49 | 2.734 | -13,76 | ||||
| 2026-02-13 | 13F | Quarry LP | 527 | 19 | ||||||
| 2026-02-12 | 13F | New York State Common Retirement Fund | 6.836 | 243 | ||||||
| 2026-02-12 | 13F | Nuveen, LLC | 6.604 | 234 | ||||||
| 2026-02-17 | 13F | Two Sigma Advisers, Lp | 109.700 | 23,68 | 3.894 | 6,13 | ||||
| 2026-02-17 | 13F | Public Employees Retirement System Of Ohio | 34.583 | 20,85 | 1.228 | 3,72 | ||||
| 2026-01-26 | 13F | Cwm, Llc | 10.650 | 0 | ||||||
| 2026-01-20 | 13F | Signaturefd, Llc | 796 | 2,05 | 28 | -12,50 | ||||
| 2026-01-29 | 13F | UBS Group AG | 500.766 | -41,05 | 17.777 | -49,41 | ||||
| 2026-02-13 | 13F | Barclays Plc | 6.646 | -67,61 | 236 | -72,29 | ||||
| 2025-11-12 | 13F | Simplex Trading, Llc | 0 | -100,00 | 0 | |||||
| 2026-01-29 | 13F | Matthews International Capital Management Llc | 61.869 | 12,75 | 2.196 | -3,26 | ||||
| 2026-01-12 | 13F | World Equity Group, Inc. | 0 | -100,00 | 0 | -100,00 | ||||
| 2026-02-17 | 13F | Mangrove Partners | 14.911 | 529 | ||||||
| 2026-02-05 | 13F | Td Private Client Wealth Llc | 399 | 14 | ||||||
| 2026-02-13 | 13F | Centiva Capital, LP | 0 | -100,00 | 0 | |||||
| 2026-02-11 | 13F | Simplex Trading, Llc | Put | 0 | -100,00 | 0 | ||||
| 2025-11-13 | 13F | Monolith Management Ltd | 0 | -100,00 | 0 | |||||
| 2026-02-11 | 13F | Parallel Advisors, LLC | 243 | 4,29 | 9 | -11,11 | ||||
| 2026-02-10 | 13F | State of Wyoming | 4.956 | 9,82 | 176 | -5,91 | ||||
| 2026-03-03 | 13F/A | Caitong International Asset Management Co., Ltd | 2.899 | 391,36 | 103 | 325,00 | ||||
| 2026-02-10 | 13F | Bnp Paribas Arbitrage, Sa | 109.453 | 59,83 | 3.886 | 37,13 | ||||
| 2026-02-17 | 13F | Susquehanna International Group, Llp | Call | 15.600 | -16,58 | 554 | -28,46 | |||
| 2026-01-26 | 13F | Mirae Asset Global Investments Co., Ltd. | 670 | 0,00 | 24 | -14,81 | ||||
| 2026-01-07 | 13F | CWA Asset Management Group, LLC | 66.430 | -1,73 | 2.358 | -15,67 | ||||
| 2026-02-17 | 13F | Schonfeld Strategic Advisors LLC | 6.119 | 217 | ||||||
| 2026-02-17 | 13F | XTX Topco Ltd | 8.887 | 315 | ||||||
| 2026-02-17 | 13F | D. E. Shaw & Co., Inc. | 48.520 | 1.722 | ||||||
| 2026-01-26 | 13F | Private Trust Co Na | 128 | 31,96 | 5 | 0,00 | ||||
| 2026-02-13 | 13F | State Street Corp | 31.504 | 416,46 | 1.118 | 343,65 | ||||
| 2026-01-30 | 13F | Us Bancorp \de\ | 56 | 21,74 | 2 | 0,00 | ||||
| 2026-02-17 | 13F/A | Beverly Hills Private Wealth, LLC | 6.712 | 0,00 | 238 | -14,08 | ||||
| 2026-02-17 | 13F | Man Group plc | 49.383 | 1.753 | 571,65 | |||||
| 2026-02-13 | 13F | Transamerica Financial Advisors, Inc. | 9 | 0 | ||||||
| 2026-02-13 | 13F | Morgan Stanley | 96.322 | -24,48 | 3.419 | -35,20 | ||||
| 2025-11-14 | 13F | Caption Management, LLC | 0 | -100,00 | 0 | |||||
| 2026-02-06 | 13F | Gsa Capital Partners Llp | 0 | -100,00 | 0 | |||||
| 2026-02-06 | 13F | Global Retirement Partners, LLC | 1.052 | 3,14 | 37 | -11,90 | ||||
| 2026-02-13 | 13F | Public Employees Retirement Association Of Colorado | 1.400 | 0 | ||||||
| 2026-02-17 | 13F | Creative Planning | 0 | -100,00 | 0 | |||||
| 2026-02-13 | 13F | Squarepoint Ops LLC | 35.863 | 1.273 | ||||||
| 2026-02-20 | 13F | Dorsey Wright & Associates | 63.726 | 6,94 | 2.262 | -8,24 | ||||
| 2026-02-10 | 13F | Connor, Clark & Lunn Investment Management Ltd. | 241.280 | 2,61 | 8.565 | -11,95 | ||||
| 2026-02-17 | 13F | Tower Research Capital LLC (TRC) | 100 | 4 | ||||||
| 2026-02-13 | 13F | Smartleaf Asset Management LLC | 365 | 13 | ||||||
| 2026-02-06 | 13F | Larson Financial Group LLC | 128 | 0,00 | 5 | -20,00 | ||||
| 2025-11-14 | 13F | Raymond James Financial Inc | 0 | -100,00 | 0 | |||||
| 2026-01-23 | 13F | Diversify Advisory Services, LLC | 19.604 | 9,51 | 841 | 25,52 | ||||
| 2026-02-10 | 13F | AdvisorShares Investments LLC | 43.852 | 1,74 | 1.557 | -12,73 | ||||
| 2026-02-17 | 13F | Point72 Asset Management, L.P. | 600.653 | 126,07 | 21.323 | 94,00 | ||||
| 2025-10-20 | 13F | Shilanski & Associates, Inc. | 9.645 | 399 | ||||||
| 2026-02-11 | 13F | O'shaughnessy Asset Management, Llc | 95.579 | 463,56 | 3.393 | 384,02 | ||||
| 2026-02-11 | 13F | LPL Financial LLC | 54.423 | 14,05 | 1.932 | -2,13 | ||||
| 2026-02-13 | 13F | Chou Associates Management Inc. | 23.364 | 0,00 | 829 | -14,18 | ||||
| 2026-02-13 | 13F | Pinpoint Asset Management (Singapore) Pte. Ltd. | 46.196 | 351,79 | 1.640 | 287,47 | ||||
| 2026-02-17 | 13F | Quadrature Capital Ltd | 14.412 | 512 | ||||||
| 2025-11-14 | 13F | Verity Asset Management, Inc. | 0 | -100,00 | 0 | |||||
| 2026-02-06 | 13F | Vestmark Advisory Solutions, Inc. | 10.570 | 375 | ||||||
| 2025-11-10 | 13F | Citigroup Inc | 0 | -100,00 | 0 | |||||
| 2026-02-11 | 13F | Simplex Trading, Llc | Call | 5.000 | -13,79 | 178 | ||||
| 2026-02-17 | 13F | Jump Financial, LLC | 32.437 | 1.152 | ||||||
| 2026-02-17 | 13F | Symmetry Investments LP | 0 | -100,00 | 0 | -100,00 | ||||
| 2026-02-17 | 13F | Voloridge Investment Management, Llc | 27.007 | 959 | ||||||
| 2026-01-29 | 13F | Cornerstone Investment Partners, LLC | 0 | -100,00 | 0 | |||||
| 2026-02-02 | 13F | Truist Financial Corp | 5.878 | -2,50 | 209 | -16,47 | ||||
| 2026-02-12 | 13F | Jane Street Group, Llc | 142.699 | 24,51 | 5.066 | 6,83 | ||||
| 2026-02-17 | 13F | Russell Investments Group, Ltd. | 17.837 | 91,16 | 631 | 64,49 | ||||
| 2026-02-17 | 13F | Lighthouse Investment Partners, LLC | 157.433 | 1,84 | 5.589 | -12,62 | ||||
| 2026-02-17 | 13F | Susquehanna Portfolio Strategies, LLC | 6.368 | 0,00 | 226 | -14,07 | ||||
| 2026-02-11 | 13F | Deutsche Bank Ag\ | 1.880 | 67 | ||||||
| 2026-02-11 | 13F | Group One Trading, L.p. | Put | 200 | -90,91 | 7 | -92,31 | |||
| 2026-02-11 | 13F | Group One Trading, L.p. | Call | 6.500 | -53,57 | 231 | -60,28 | |||
| 2026-02-05 | 13F | Allworth Financial LP | 108 | 16,13 | 4 | 0,00 | ||||
| 2026-02-17 | 13F | Bank Of America Corp /de/ | 8.608 | -20,12 | 306 | -31,46 | ||||
| 2026-02-17 | 13F | PharVision Advisers, LLC | 7.807 | 277 | ||||||
| 2025-11-14 | 13F | Caption Management, LLC | Put | 0 | -100,00 | 0 | ||||
| 2026-02-13 | 13F | Stifel Financial Corp | 26.095 | 10,37 | 926 | -5,32 | ||||
| 2026-02-12 | 13F | Renaissance Technologies Llc | 278.494 | 3,45 | 9.887 | -11,23 | ||||
| 2026-02-17 | 13F | Citadel Advisors Llc | Call | 0 | -100,00 | 0 | -100,00 | |||
| 2026-02-13 | 13F | Resources Investment Advisors, LLC. | 0 | -100,00 | 0 | |||||
| 2026-02-13 | 13F | Arrowstreet Capital, Limited Partnership | 341.286 | 333,52 | 12.116 | 272,08 | ||||
| 2026-02-13 | 13F | Police & Firemen's Retirement System of New Jersey | 6.948 | 247 | ||||||
| 2026-01-28 | 13F | CAPROCK Group, Inc. | 10.373 | 368 | ||||||
| 2026-02-10 | 13F | Goldman Sachs Group Inc | 20.912 | 23,37 | 742 | 5,85 | ||||
| 2026-02-17 | 13F | Qube Research & Technologies Ltd | 30.398 | 1.079 | ||||||
| 2025-11-14 | 13F | Susquehanna International Group, Llp | Put | 0 | -100,00 | 0 | -100,00 | |||
| 2026-01-29 | 13F | China Universal Asset Management Co., Ltd. | 2.000 | 0,00 | 71 | -13,41 | ||||
| 2025-11-14 | 13F | Susquehanna International Group, Llp | 0 | -100,00 | 0 | -100,00 | ||||
| 2026-02-17 | 13F | Advisor Group Holdings, Inc. | 181 | 1,12 | 6 | -14,29 | ||||
| 2026-02-12 | 13F | Hrt Financial Lp | 46.858 | 2 | ||||||
| 2025-11-14 | 13F | Point72 Asia (Singapore) Pte. Ltd. | 41.519 | -49,57 | 1.718 | -12,75 | ||||
| 2025-11-14 | 13F | Point72 Hong Kong Ltd | 373.962 | 275,22 | 15.471 | 549,18 | ||||
| 2026-02-12 | 13F | BlackRock, Inc. | 123.057 | 193,46 | 4.369 | 151,90 | ||||
| 2026-02-13 | 13F | Integrated Wealth Concepts LLC | 0 | -100,00 | 0 | |||||
| 2026-02-17 | 13F | Cetera Investment Advisers | 14.993 | -1,87 | 532 | -15,82 | ||||
| 2026-02-17 | 13F | Millennium Management Llc | 529.243 | -26,52 | 18.788 | -36,94 | ||||
| 2026-02-13 | 13F | Parkside Financial Bank & Trust | 30 | 0,00 | 1 | 0,00 | ||||
| 2026-01-23 | 13F | Assetmark, Inc | 1.986 | 12.312,50 | 71 | |||||
| 2026-01-15 | 13F | Shah Capital Management | 1.646.397 | -1,57 | 58.447 | -15,54 | ||||
| 2026-01-20 | 13F | Thurston, Springer, Miller, Herd & Titak, Inc. | 1.200 | -40,00 | 43 | -48,78 | ||||
| 2026-02-17 | 13F | Moore Capital Management, Lp | 0 | -100,00 | 0 | |||||
| 2026-02-17 | 13F | Two Sigma Investments, Lp | 61.600 | 1.010,71 | 2.187 | 854,59 | ||||
| 2025-11-10 | 13F | MAI Capital Management | 0 | -100,00 | 0 | |||||
| 2025-09-29 | NP | KCXIX - Knights of Columbus U.S. All Cap Index Fund I Shares | 53 | -14,52 | 1 | |||||
| 2026-02-10 | 13F | Quantbot Technologies LP | 13.453 | 1.291,21 | 478 | 1.092,50 |
Other Listings
| US:CYD | 37,30 $ |