Grundlæggende statistik
| Institutionelle aktier (lange) | 17.824.716 - 25,55% (ex 13D/G) - change of 1,68MM shares 10,39% MRQ |
| Institutionel værdi (lang) | $ 29.968 USD ($1000) |
Institutionelt ejerskab og aktionærer
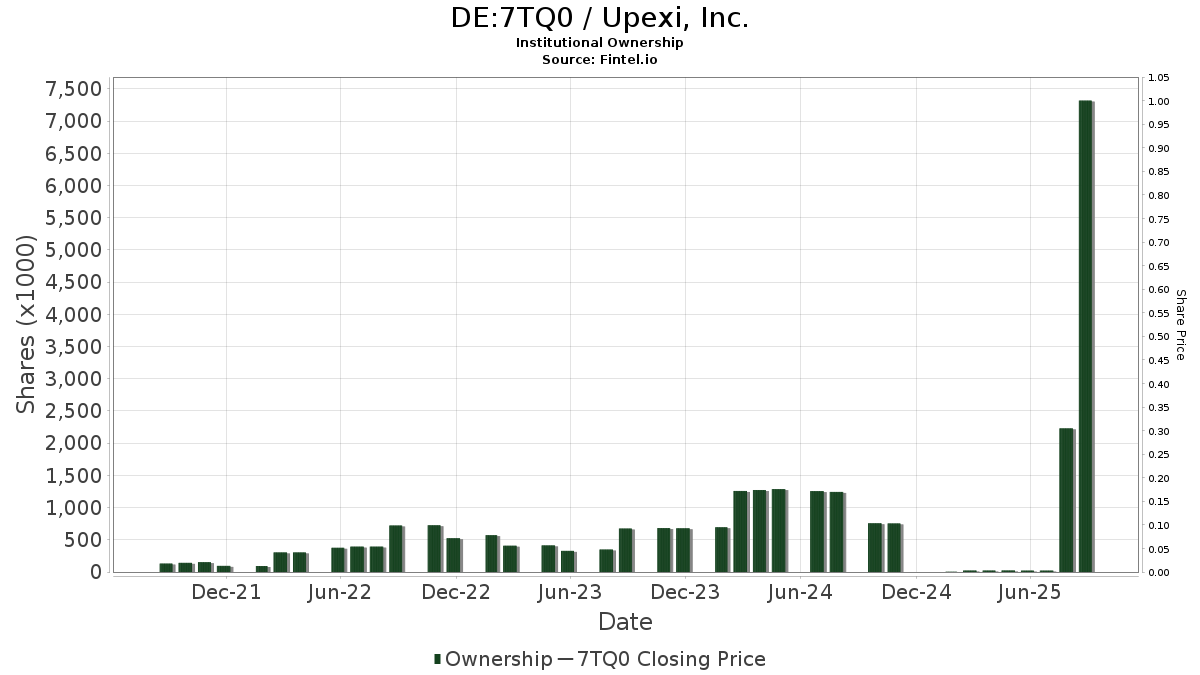
Upexi, Inc. (DE:7TQ0) har 68 institutionelle ejere og aktionærer, der har indsendt 13D/G- eller 13F-formularer til Securities Exchange Commission (SEC). Disse institutioner har i alt 17,824,716 aktier. Største aktionærer omfatter Arrington Capital Management, LLC, Marex Group plc, MMCAP International Inc. SPC, Jane Street Group, Llc, Millennium Management Llc, Jane Street Group, Llc, Susquehanna International Group, Llp, Susquehanna International Group, Llp, Qube Research & Technologies Ltd, and Group One Trading, L.p. .
Upexi, Inc. (DB:7TQ0) institutionel ejerskabsstruktur viser aktuelle positioner i virksomheden efter institutioner og fonde, samt seneste ændringer i positionsstørrelse. Større aktionærer kan omfatte individuelle investorer, investeringsforeninger, hedgefonde eller institutioner. Skema 13D angiver, at investoren besidder (eller besidder) mere end 5 % af virksomheden og har til hensigt (eller har til hensigt at) aktivt at forfølge en ændring i forretningsstrategi. Skema 13G indikerer en passiv investering på over 5%.
The share price as of March 13, 2026 is 0,76 / share. Previously, on March 17, 2025, the share price was 2,92 / share. This represents a decline of 73,80% over that period.
Fondens stemningsscore
Fund Sentiment Score (fka Ownership Accumulation Score) finder de aktier, der bliver mest købt af fonde. Det er resultatet af en sofistikeret, multi-faktor kvantitativ model, der identificerer virksomheder med de højeste niveauer af institutionel akkumulering. Scoringsmodellen bruger en kombination af den samlede stigning i oplyste ejere, ændringerne i porteføljeallokeringer i disse ejere og andre målinger. Tallet går fra 0 til 100, hvor højere tal indikerer et højere niveau af akkumulering for sine jævnaldrende, og 50 er gennemsnittet.
Opdateringsfrekvens: Dagligt
Se Ownership Explorer, som giver en liste over højest rangerende virksomheder.
AI+ Ask Fintel’s AI assistant about Upexi, Inc..
Select a question to share a public post with an AI-crafted answer.
Thinking of good questions…
13F og NPORT arkivering
Detaljer om 13F-arkivering er gratis. Detaljer om NP-ansøgninger kræver et premium-medlemskab. Grønne rækker angiver nye positioner. Røde rækker angiver lukkede positioner. Klik på linket ikon for at se den fulde transaktionshistorik.
Opgrader
for at låse premium-data op og eksportere til Excel ![]() .
.
| Fil dato | Kilde | Investor | Type | Gennemsnitlig pris (Øst) |
Aktier | Δ Aktier (%) |
Rapporteret Værdi ($1000) |
Δ Værdi (%) |
Port Alloc (%) |
|
|---|---|---|---|---|---|---|---|---|---|---|
| 2026-01-13 | 13F | Kathmere Capital Management, LLC | 0 | -100,00 | 0 | |||||
| 2026-02-17 | 13F | Susquehanna International Group, Llp | Call | 591.300 | -71,05 | 993 | -91,57 | |||
| 2026-02-11 | 13F | Winton Capital Group Ltd | 10.581 | 18 | ||||||
| 2026-02-13 | 13F | Barclays Plc | 0 | -100,00 | 0 | -100,00 | ||||
| 2026-02-12 | 13F | BlackRock, Inc. | 681.308 | -0,11 | 1.145 | -70,93 | ||||
| 2026-02-17 | 13F | Susquehanna International Group, Llp | 769.732 | 2,43 | 1.293 | -70,18 | ||||
| 2026-02-17 | 13F | Millennium Management Llc | 846.545 | 131,32 | 1.422 | -32,64 | ||||
| 2026-02-17 | 13F | Susquehanna International Group, Llp | Put | 798.900 | -58,40 | 1.342 | -87,89 | |||
| 2026-02-17 | 13F | Tower Research Capital LLC (TRC) | 33.881 | 1.186,29 | 57 | 273,33 | ||||
| 2026-02-13 | 13F | State Street Corp | 192.022 | 0,00 | 323 | -70,91 | ||||
| 2026-02-13 | 13F | Barclays Plc | Put | 0 | -100,00 | 0 | -100,00 | |||
| 2026-02-17 | 13F | Cetera Investment Advisers | 23.660 | 38,20 | 40 | -60,20 | ||||
| 2026-01-20 | 13F | Signaturefd, Llc | 113 | 0,00 | 0 | |||||
| 2026-02-17 | 13F | Advisor Group Holdings, Inc. | 444.951 | 2.271,68 | 748 | 465,91 | ||||
| 2026-01-14 | 13F | Smith Thornton Advisors LLC | 11.000 | 18 | ||||||
| 2026-02-12 | 13F | CIBC Private Wealth Group, LLC | 4.000 | 7 | ||||||
| 2026-02-17 | 13F | Fmr Llc | 0 | -100,00 | 0 | |||||
| 2026-01-30 | 13F | North Star Investment Management Corp. | 0 | -100,00 | 0 | |||||
| 2026-01-27 | 13F | Aspiring Ventures, LLC | Call | 0 | -100,00 | 0 | -100,00 | |||
| 2026-02-12 | 13F | Jane Street Group, Llc | 899.826 | 46,34 | 1.512 | -57,40 | ||||
| 2026-02-17 | 13F | Parallax Volatility Advisers, L.P. | Call | 0 | -100,00 | 0 | ||||
| 2026-02-17 | 13F | Pinnacle Financial Partners, Inc. | 70.720 | 119 | ||||||
| 2026-02-13 | 13F | Arkadios Wealth Advisors | 0 | -100,00 | 0 | |||||
| 2026-02-12 | 13F | Jane Street Group, Llc | Put | 138.800 | -52,74 | 233 | -86,25 | |||
| 2026-02-12 | 13F | Jane Street Group, Llc | Call | 826.100 | -49,56 | 1.388 | -85,32 | |||
| 2026-02-13 | 13F | National Bank Of Canada /fi/ | 111.300 | 652,03 | 187 | 118,82 | ||||
| 2026-02-12 | 13F | Marex Group plc | 2.507.176 | 289,21 | 4.212 | 13,35 | ||||
| 2026-01-27 | 13F | Aspiring Ventures, LLC | 0 | -100,00 | 0 | -100,00 | ||||
| 2026-02-27 | 13F | Strategic Investment Solutions, Inc. /IL | 0 | -100,00 | 0 | |||||
| 2026-02-17 | 13F | Bank Of America Corp /de/ | 24.913 | 81,52 | 42 | -48,10 | ||||
| 2026-02-17 | 13F | Engineers Gate Manager LP | 120.389 | 808,12 | 202 | 165,79 | ||||
| 2025-09-24 | NP | SWTSX - Schwab Total Stock Market Index Fund This fund is a listed as child fund of Charles Schwab Investment Management Inc and if that institution has disclosed ownership in this security, then these positions will not be double counted when calculating total shares and total value | 15.000 | 70 | ||||||
| 2026-02-17 | 13F | Arrington Capital Management, LLC | 2.760.107 | 4.637 | ||||||
| 2026-02-17 | 13F | Northern Trust Corp | 89.590 | 0,65 | 151 | -70,76 | ||||
| 2026-02-17 | 13F | Private Advisor Group, LLC | 10.725 | 18 | ||||||
| 2026-01-09 | 13F | SG Americas Securities, LLC | 0 | -100,00 | 0 | |||||
| 2026-02-13 | 13F | OMERS ADMINISTRATION Corp | 101.200 | 170 | ||||||
| 2025-09-26 | NP | USMIX - Extended Market Index Fund | 3.336 | 15 | ||||||
| 2025-11-12 | 13F | HAP Trading, LLC | Call | 24.700 | 16 | |||||
| 2026-02-11 | 13F | Jpmorgan Chase & Co | 0 | -100,00 | 0 | -100,00 | ||||
| 2026-02-17 | 13F | Lighthouse Investment Partners, LLC | 18.180 | 31 | ||||||
| 2026-01-05 | 13F | Catherine Avery Investment Management LLC | 250 | 66,67 | 0 | |||||
| 2026-02-10 | 13F | Goldman Sachs Group Inc | 57.455 | 105,73 | 97 | -40,37 | ||||
| 2026-02-13 | 13F | MAI Capital Management | 875 | 0,00 | 1 | -80,00 | ||||
| 2026-02-13 | 13F | Morgan Stanley | 137.788 | -54,24 | 231 | -86,70 | ||||
| 2026-02-27 | 13F/A | Pantera Capital Partners LP | 0 | -100,00 | 0 | -100,00 | ||||
| 2026-01-08 | 13F | Armstrong Advisory Group, Inc | 1.000 | 0,00 | 2 | -80,00 | ||||
| 2026-02-05 | 13F | Phoenix Holdings Ltd. | 52.000 | -25,71 | 87 | -78,47 | ||||
| 2026-02-09 | 13F | Geode Capital Management, Llc | 499.610 | 9,00 | 840 | -68,28 | ||||
| 2026-02-13 | 13F | Citigroup Inc | 0 | -100,00 | 0 | |||||
| 2026-02-09 | 13F | MMCAP International Inc. SPC | 2.326.777 | 203,39 | 3.909 | -11,68 | ||||
| 2026-02-17 | 13F | XTX Topco Ltd | 152.873 | 388,43 | 257 | 42,22 | ||||
| 2026-01-23 | 13F | Farther Finance Advisors, LLC | 32 | -97,90 | 0 | -100,00 | ||||
| 2026-02-13 | 13F | Clear Street Group Inc. | 0 | -100,00 | 0 | |||||
| 2025-12-01 | 13F/A | Cantor Fitzgerald, L. P. | 0 | -100,00 | 0 | -100,00 | ||||
| 2026-01-29 | 13F | Vanguard Group Inc | 710.744 | 0,00 | 1.194 | -70,88 | ||||
| 2026-02-17 | 13F | Quadrature Capital Ltd | 361.657 | 608 | ||||||
| 2026-02-04 | 13F | Ameritas Advisory Services, LLC | 0 | -100,00 | 0 | -100,00 | ||||
| 2026-02-17 | 13F | Warren Averett Asset Management, LLC | 13.725 | 23 | ||||||
| 2026-02-17 | 13F | Cantor Fitzgerald, L. P. | Call | 0 | -100,00 | 0 | ||||
| 2026-02-17 | 13F | Heights Capital Management, Inc | 0 | -100,00 | 0 | |||||
| 2026-02-13 | 13F | Mariner, LLC | 10.000 | 0,00 | 17 | -71,93 | ||||
| 2026-01-27 | 13F | Belpointe Asset Management LLC | 0 | -100,00 | 0 | -100,00 | ||||
| 2026-02-17 | 13F | Balyasny Asset Management Llc | 279.579 | 470 | ||||||
| 2026-02-17 | 13F | Qube Research & Technologies Ltd | 744.441 | 1.251 | ||||||
| 2025-12-17 | 13F | NewGen Asset Management Ltd | 0 | -100,00 | 0 | -100,00 | ||||
| 2026-02-26 | 13F/A | Aristides Capital LLC | 59.342 | 100 | ||||||
| 2026-03-03 | 13F/A | Caitong International Asset Management Co., Ltd | 159.800 | 268 | ||||||
| 2026-01-27 | 13F | Gf Fund Management Co. Ltd. | 1.623 | -19,09 | 3 | -81,82 | ||||
| 2026-02-17 | 13F | BlueCrest Capital Management Ltd | 0 | -100,00 | 0 | -100,00 | ||||
| 2026-02-09 | 13F | Jefferies Financial Group Inc. | 10.131 | 17 | ||||||
| 2026-02-17 | 13F | Royal Bank Of Canada | 71 | -97,16 | 0 | -100,00 | ||||
| 2026-02-11 | 13F | J.w. Cole Advisors, Inc. | 15.100 | -3,21 | 25 | -72,22 | ||||
| 2026-02-13 | 13F | Gts Securities Llc | 16.538 | 28 | ||||||
| 2026-02-09 | 13F | Millington Financial Advisors, LLC | 40.000 | 100,00 | 46 | -65,12 | ||||
| 2026-02-12 | 13F | Bank Of Montreal /can/ | 0 | -100,00 | 0 | |||||
| 2026-02-11 | 13F | LPL Financial LLC | Call | 0 | -100,00 | 0 | -100,00 | |||
| 2026-02-17 | 13F | Capital Fund Management S.a. | 0 | -100,00 | 0 | |||||
| 2026-02-17 | 13F | Price T Rowe Associates Inc /md/ | 20.500 | 0 | ||||||
| 2026-02-11 | 13F | LPL Financial LLC | 24.367 | 50,00 | 41 | -56,99 | ||||
| 2026-01-29 | 13F | UBS Group AG | 479.885 | -36,63 | 806 | -81,55 | ||||
| 2026-02-12 | 13F | Commonwealth Equity Services, Llc | 32.625 | 4,15 | 55 | |||||
| 2026-02-13 | 13F | Squarepoint Ops LLC | 0 | -100,00 | 0 | |||||
| 2026-01-21 | 13F | Shariaportfolio, Inc. | 79.828 | -87,18 | 134 | -96,27 | ||||
| 2026-02-23 | 13F | Virtu Financial LLC | 0 | -100,00 | 0 | |||||
| 2026-01-23 | 13F | Valley National Advisers Inc | 0 | -100,00 | 0 | |||||
| 2026-02-12 | 13F | Bank Of Montreal /can/ | Put | 0 | -100,00 | 0 | ||||
| 2026-02-17 | 13F | nVerses Capital, LLC | 10.045 | 17 | ||||||
| 2025-11-07 | 13F | Synovus Financial Corp | 25.100 | 145 | ||||||
| 2026-02-17 | 13F | Point72 Asset Management, L.P. | 406.258 | 683 | ||||||
| 2025-11-13 | 13F | NewGen Equity Long/Short Fund | 0 | -100,00 | 0 | -100,00 | ||||
| 2026-02-17 | 13F | Citadel Advisors Llc | 197.180 | 219,99 | 331 | -6,76 | ||||
| 2026-02-17 | 13F | Lighthouse Investment Partners, LLC | Call | 0 | -100,00 | 0 | ||||
| 2026-02-17 | 13F | Citadel Advisors Llc | Call | 399.700 | -65,05 | 671 | -89,83 | |||
| 2026-02-17 | 13F | Citadel Advisors Llc | Put | 229.200 | -24,26 | 385 | -77,95 | |||
| 2026-02-06 | 13F | Gsa Capital Partners Llp | 0 | -100,00 | 0 | |||||
| 2026-02-13 | 13F | Charles Schwab Investment Management Inc | 0 | -100,00 | 0 | |||||
| 2026-02-09 | 13F | Hartland & Co., LLC | 16.000 | 27 | ||||||
| 2026-02-17 | 13F | Nomura Holdings Inc | 24.000 | 33,33 | 40 | -61,17 | ||||
| 2025-11-14 | 13F | Wolverine Trading, Llc | Put | 0 | -100,00 | 0 | ||||
| 2026-02-13 | 13F | Alyeska Investment Group, L.P. | 0 | -100,00 | 0 | -100,00 | ||||
| 2026-02-17 | 13F | Wealth Watch Advisors, INC | 0 | -100,00 | 0 | |||||
| 2026-02-03 | 13F | SBI Securities Co., Ltd. | 69.086 | -16,05 | 116 | -75,53 | ||||
| 2026-02-11 | 13F | Simplex Trading, Llc | 87.203 | -67,36 | 147 | 14.500,00 | ||||
| 2026-02-17 | 13F | Two Sigma Investments, Lp | 174.767 | 294 | ||||||
| 2026-02-06 | 13F | Keystone Financial Group | 27.325 | 46 | ||||||
| 2026-02-12 | 13F | Rossby Financial, LCC | 5.100 | -76,61 | 9 | -94,37 | ||||
| 2026-02-10 | 13F | Bnp Paribas Arbitrage, Sa | 0 | -100,00 | 0 | |||||
| 2026-02-12 | 13F | Great Valley Advisor Group, Inc. | 11.700 | 9,35 | 20 | -68,85 | ||||
| 2026-02-17 | 13F | Two Sigma Securities, Llc | 18.154 | 30 | ||||||
| 2026-02-17 | 13F | Polar Asset Management Partners Inc. | Put | 0 | -100,00 | 0 | ||||
| 2026-02-17 | 13F | Polar Asset Management Partners Inc. | 0 | -100,00 | 0 | |||||
| 2026-02-17 | 13F | Schonfeld Strategic Advisors LLC | 0 | -100,00 | 0 | |||||
| 2026-01-16 | 13F | FNY Investment Advisers, LLC | 0 | -100,00 | 0 | |||||
| 2026-02-11 | 13F | Group One Trading, L.p. | 728.927 | 1.225 |
Other Listings
| US:UPXI | 1,08 $ |