Grundlæggende statistik
| Institutionelle ejere | 75 total, 72 long only, 0 short only, 3 long/short - change of -22,68% MRQ |
| Del pris | 1,94 |
| Gennemsnitlig porteføljeallokering | 0.5032 % - change of 17,41% MRQ |
| Institutionelle aktier (lange) | 124.712.808 (ex 13D/G) - change of -14,15MM shares -10,19% MRQ |
| Institutionel værdi (lang) | $ 258.879 USD ($1000) |
Institutionelt ejerskab og aktionærer
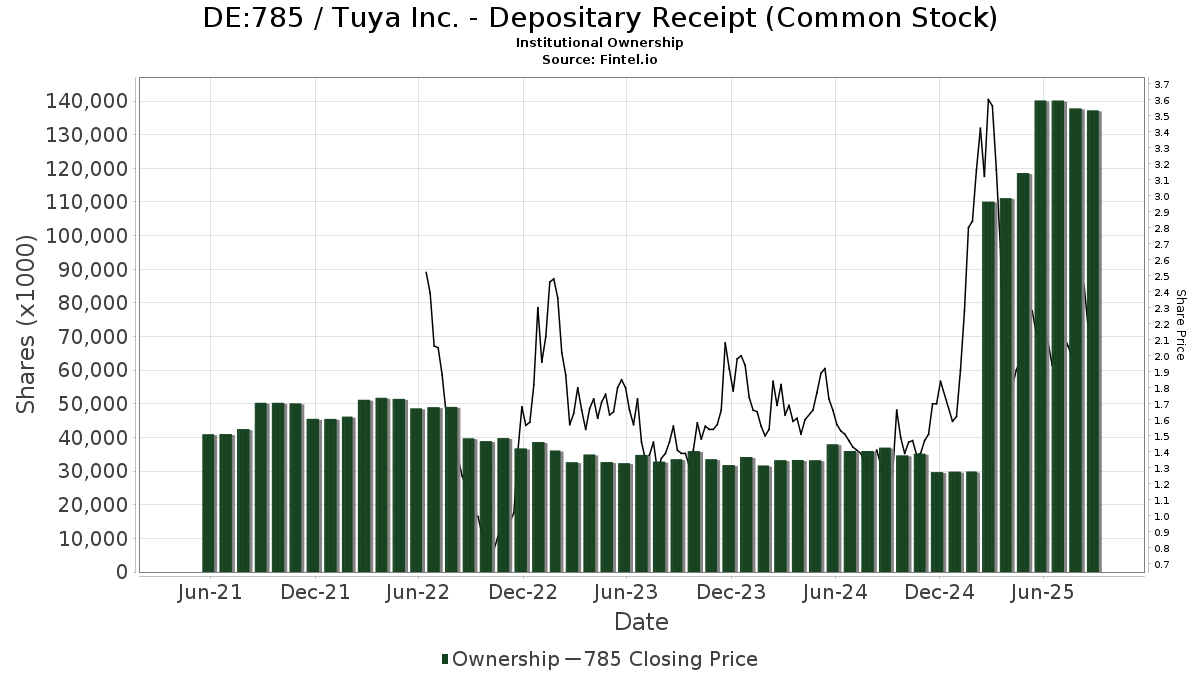
Tuya Inc. - Depositary Receipt (Common Stock) (DE:785) har 75 institutionelle ejere og aktionærer, der har indsendt 13D/G- eller 13F-formularer til Securities Exchange Commission (SEC). Disse institutioner har i alt 124,712,808 aktier. Største aktionærer omfatter Anchor @ 65 Pte. Ltd., FIL Ltd, BlackRock, Inc., Nuveen, LLC, Principal Financial Group Inc, Arrowstreet Capital, Limited Partnership, Connor, Clark & Lunn Investment Management Ltd., D. E. Shaw & Co., Inc., Acadian Asset Management Llc, and State Street Corp .
Tuya Inc. - Depositary Receipt (Common Stock) (DB:785) institutionel ejerskabsstruktur viser aktuelle positioner i virksomheden efter institutioner og fonde, samt seneste ændringer i positionsstørrelse. Større aktionærer kan omfatte individuelle investorer, investeringsforeninger, hedgefonde eller institutioner. Skema 13D angiver, at investoren besidder (eller besidder) mere end 5 % af virksomheden og har til hensigt (eller har til hensigt at) aktivt at forfølge en ændring i forretningsstrategi. Skema 13G indikerer en passiv investering på over 5%.
The share price as of March 31, 2026 is 1,94 / share. Previously, on April 1, 2025, the share price was 2,70 / share. This represents a decline of 28,15% over that period.
Fondens stemningsscore
Fund Sentiment Score (fka Ownership Accumulation Score) finder de aktier, der bliver mest købt af fonde. Det er resultatet af en sofistikeret, multi-faktor kvantitativ model, der identificerer virksomheder med de højeste niveauer af institutionel akkumulering. Scoringsmodellen bruger en kombination af den samlede stigning i oplyste ejere, ændringerne i porteføljeallokeringer i disse ejere og andre målinger. Tallet går fra 0 til 100, hvor højere tal indikerer et højere niveau af akkumulering for sine jævnaldrende, og 50 er gennemsnittet.
Opdateringsfrekvens: Dagligt
Se Ownership Explorer, som giver en liste over højest rangerende virksomheder.
AI+ Ask Fintel’s AI assistant about Tuya Inc. - Depositary Receipt (Common Stock).
Select a question to share a public post with an AI-crafted answer.
Thinking of good questions…
13F og NPORT arkivering
Detaljer om 13F-arkivering er gratis. Detaljer om NP-ansøgninger kræver et premium-medlemskab. Grønne rækker angiver nye positioner. Røde rækker angiver lukkede positioner. Klik på linket ikon for at se den fulde transaktionshistorik.
Opgrader
for at låse premium-data op og eksportere til Excel ![]() .
.
| Fil dato | Kilde | Investor | Type | Gennemsnitlig pris (Øst) |
Aktier | Δ Aktier (%) |
Rapporteret Værdi ($1000) |
Δ Værdi (%) |
Port Alloc (%) |
|
|---|---|---|---|---|---|---|---|---|---|---|
| 2026-02-09 | 13F | Legal & General Group Plc | 60.908 | 0,00 | 128 | -14,67 | ||||
| 2026-02-17 | 13F | Royal Bank Of Canada | 487 | -99,51 | 1 | -99,60 | ||||
| 2026-02-13 | 13F | Caxton Associates Llp | 56.641 | 103,65 | 120 | 75,00 | ||||
| 2026-01-29 | 13F | Matthews International Capital Management Llc | 8.553 | -98,79 | 18 | -98,96 | ||||
| 2026-02-17 | 13F | Tower Research Capital LLC (TRC) | 0 | -100,00 | 0 | |||||
| 2026-01-29 | 13F | UBS Group AG | 543.542 | -38,09 | 1.147 | -47,14 | ||||
| 2026-02-11 | 13F | Krane Funds Advisors LLC | 164.845 | -11,21 | 348 | -16,79 | ||||
| 2026-02-13 | 13F | Police & Firemen's Retirement System of New Jersey | 128.539 | 39,92 | 271 | 19,91 | ||||
| 2026-02-13 | 13F | Morgan Stanley | 1.461.164 | -42,26 | 3.083 | -50,67 | ||||
| 2026-02-17 | 13F | Alliancebernstein L.p. | 39.125 | 0,00 | 83 | -14,58 | ||||
| 2026-02-17 | 13F | Wellington Management Group Llp | 168.360 | 355 | ||||||
| 2026-02-12 | 13F | Nuveen, LLC | 5.345.933 | 2,50 | 11.280 | -12,44 | ||||
| 2026-02-13 | 13F | Ubs Asset Management Americas Inc | 212.700 | 449 | ||||||
| 2026-02-11 | 13F | SmartHarvest Portfolios, LLC | 31.358 | 66 | ||||||
| 2026-02-06 | 13F | EverSource Wealth Advisors, LLC | 202 | -78,49 | 0 | -100,00 | ||||
| 2026-02-12 | 13F | New York State Common Retirement Fund | 0 | -100,00 | 0 | |||||
| 2026-02-13 | 13F | State Street Corp | 1.579.576 | 3,00 | 3.333 | -13,90 | ||||
| 2026-02-17 | 13F | Anchor @ 65 Pte. Ltd. | 74.626.900 | 0,00 | 157.463 | -14,58 | ||||
| 2025-11-14 | 13F | Natixis | 0 | -100,00 | 0 | |||||
| 2026-02-17 | 13F | Engineers Gate Manager LP | 50.997 | 5,19 | 108 | -10,08 | ||||
| 2026-02-13 | 13F | Healthcare Of Ontario Pension Plan Trust Fund | 441.900 | 0,00 | 932 | -14,57 | ||||
| 2026-02-06 | 13F | Profund Advisors Llc | 0 | -100,00 | 0 | |||||
| 2026-02-17 | 13F | Quadrature Capital Ltd | 27.706 | -67,93 | 58 | -72,64 | ||||
| 2026-02-23 | 13F | Virtu Financial LLC | 0 | -100,00 | 0 | |||||
| 2026-02-19 | 13F | Invesco Ltd. | 226.677 | -57,36 | 478 | -63,59 | ||||
| 2026-02-02 | 13F | Principal Financial Group Inc | 3.958.701 | 6,53 | 8.353 | -9,00 | ||||
| 2026-01-26 | 13F | JNBA Financial Advisors | 2.272 | 5 | ||||||
| 2026-02-17 | 13F | FIL Ltd | 8.920.329 | 26,23 | 18.822 | 7,83 | ||||
| 2026-02-17 | 13F | Oddo Bhf Asset Management Sas | 62.100 | 55,25 | 131 | 33,67 | ||||
| 2026-02-13 | 13F | Citigroup Inc | 50.447 | 12,64 | 106 | -3,64 | ||||
| 2026-02-17 | 13F | Hillhouse Capital Advisors, Ltd. | 1.564.400 | 0,00 | 3.301 | -14,60 | ||||
| 2026-03-06 | 13F | Hsbc Holdings Plc | 129.577 | 208,64 | 275 | 166,02 | ||||
| 2026-02-13 | 13F | Manufacturers Life Insurance Company, The | 0 | -100,00 | 0 | |||||
| 2026-02-11 | 13F | Allianz Asset Management GmbH | 131.925 | -88,86 | 278 | -90,49 | ||||
| 2026-02-10 | 13F | Connor, Clark & Lunn Investment Management Ltd. | 2.361.032 | -1,05 | 4.982 | -15,48 | ||||
| 2026-01-29 | 13F | Pictet Asset Management Holding SA | 180.999 | 0,00 | 382 | -14,77 | ||||
| 2025-11-14 | 13F | Two Sigma Investments, Lp | 0 | -100,00 | 0 | |||||
| 2026-02-02 | 13F | Qrg Capital Management, Inc. | 25.857 | 2,36 | 55 | -12,90 | ||||
| 2025-11-13 | 13F | Clear Street Markets Llc | 0 | -100,00 | 0 | -100,00 | ||||
| 2025-11-13 | 13F | Carmignac Gestion | 0 | -100,00 | 0 | |||||
| 2026-02-03 | 13F | SBI Securities Co., Ltd. | 6.082 | -79,37 | 13 | -83,33 | ||||
| 2025-10-30 | 13F | Ridgewood Investments LLC | 0 | -100,00 | 0 | |||||
| 2026-02-11 | 13F | Jpmorgan Chase & Co | 21.394 | -98,86 | 45 | -99,03 | ||||
| 2025-11-12 | 13F/A | Norges Bank | 1.451.880 | 2.396 | ||||||
| 2026-02-10 | 13F | Bank of New York Mellon Corp | 433.789 | -11,63 | 915 | -24,50 | ||||
| 2026-02-09 | 13F | Themes Management Co LLC | 99.800 | 211 | ||||||
| 2026-02-17 | 13F | Verdad Advisers, LP | 31.922 | 67 | ||||||
| 2026-02-13 | 13F | Oasis Management Co Ltd. | 196.841 | 0,00 | 415 | -14,61 | ||||
| 2025-11-14 | 13F | Jane Street Group, Llc | Call | 0 | -100,00 | 0 | -100,00 | |||
| 2026-02-12 | 13F | Loomis Sayles & Co L P | 0 | -100,00 | 0 | |||||
| 2026-02-11 | 13F | Group One Trading, L.p. | 2.131 | -98,93 | 4 | -99,19 | ||||
| 2026-02-17 | 13F/A | RBF Capital, LLC | 0 | -100,00 | 0 | |||||
| 2026-02-17 | 13F | Public Employees Retirement System Of Ohio | 345.619 | 0,03 | 729 | -14,54 | ||||
| 2025-11-13 | 13F | Canada Pension Plan Investment Board | 0 | -100,00 | 0 | |||||
| 2026-02-10 | 13F | Fideuram Asset Management (Ireland) dac | 719.137 | 1.477 | ||||||
| 2026-02-11 | 13F | Simplex Trading, Llc | 37.496 | -79,21 | 79 | |||||
| 2026-02-13 | 13F | Caitong International Asset Management Co., Ltd | 17.958 | 110,26 | 38 | 76,19 | ||||
| 2026-02-17 | 13F | Bank Of America Corp /de/ | 191.560 | 10.116,53 | 404 | 10.000,00 | ||||
| 2025-11-14 | 13F | Lazard Asset Management Llc | 0 | -100,00 | 0 | |||||
| 2025-11-12 | 13F | Commonwealth Of Pennsylvania Public School Empls Retrmt Sys | 0 | -100,00 | 0 | |||||
| 2026-02-13 | 13F | Sei Investments Co | 36.323 | -57,71 | 77 | -64,15 | ||||
| 2026-02-17 | 13F | Millennium Management Llc | 1.394.843 | 1.204,40 | 2.943 | 1.014,77 | ||||
| 2025-11-14 | 13F | Nomura Holdings Inc | 0 | -100,00 | 0 | -100,00 | ||||
| 2025-11-07 | 13F | Shell Asset Management Co | 7.203 | -68,28 | 0 | |||||
| 2026-02-10 | 13F | Bnp Paribas Arbitrage, Sa | 189.011 | 152,11 | 399 | 115,14 | ||||
| 2026-02-13 | 13F | OMERS ADMINISTRATION Corp | 0 | -100,00 | 0 | |||||
| 2026-02-12 | 13F | BlackRock, Inc. | 5.423.056 | 1,13 | 11.443 | -13,61 | ||||
| 2026-02-06 | 13F | Pnc Financial Services Group, Inc. | 136 | -1,45 | 0 | |||||
| 2026-02-13 | 13F | Squarepoint Ops LLC | 101.965 | -8,67 | 215 | -21,82 | ||||
| 2026-02-17 | 13F | Citadel Advisors Llc | Put | 75.200 | -30,82 | 159 | -41,04 | |||
| 2026-02-17 | 13F | Citadel Advisors Llc | Call | 13.300 | 28 | |||||
| 2025-11-14 | 13F | Raymond James Financial Inc | 0 | -100,00 | 0 | |||||
| 2025-11-07 | 13F | BNP Paribas Asset Management Holding S.A. | 0 | -100,00 | 0 | -100,00 | ||||
| 2026-02-17 | 13F | Citadel Advisors Llc | 271.974 | -59,69 | 574 | -65,61 | ||||
| 2026-02-17 | 13F | Leonteq Securities AG | 0 | -100,00 | 0 | |||||
| 2026-02-17 | 13F | Qube Research & Technologies Ltd | 609.868 | 62,08 | 1.287 | 38,43 | ||||
| 2026-02-17 | 13F | Advisor Group Holdings, Inc. | 0 | -100,00 | 0 | |||||
| 2026-02-13 | 13F | Barclays Plc | 6.691 | -97,53 | 14 | -96,86 | ||||
| 2026-02-13 | 13F | Arrowstreet Capital, Limited Partnership | 3.439.029 | -3,68 | 7.256 | -17,71 | ||||
| 2026-02-12 | 13F | Hrt Financial Lp | 71.214 | 0 | ||||||
| 2026-02-10 | 13F | Natixis Advisors, L.p. | 0 | -100,00 | 0 | |||||
| 2026-02-12 | 13F | Renaissance Technologies Llc | 0 | -100,00 | 0 | |||||
| 2025-11-13 | 13F | Banco BTG Pactual S.A. | 0 | -100,00 | 0 | |||||
| 2026-02-14 | 13F | Triata Capital Ltd | 1.145.371 | 784,31 | 2.417 | 657,37 | ||||
| 2026-02-11 | 13F | Hilton Head Capital Partners, LLC | 2.906 | 6 | ||||||
| 2026-02-17 | 13F | Susquehanna International Group, Llp | Call | 43.800 | -62,05 | 92 | -67,72 | |||
| 2026-02-17 | 13F | Capitolis Liquid Global Markets LLC | 0 | -100,00 | 0 | |||||
| 2026-02-17 | 13F | Susquehanna International Group, Llp | 120.476 | 254 | ||||||
| 2026-02-17 | 13F | Susquehanna International Group, Llp | Put | 71.300 | 28,01 | 150 | 9,49 | |||
| 2025-11-14 | 13F | Two Sigma Advisers, Lp | 0 | -100,00 | 0 | -100,00 | ||||
| 2026-02-11 | 13F | IMA Wealth, Inc. | 120 | 0 | ||||||
| 2026-02-10 | 13F/A | Northwestern Mutual Wealth Management Co | 1 | 0,00 | 0 | |||||
| 2026-02-13 | 13F | Rhumbline Advisers | 2.755 | 201,09 | 6 | 150,00 | ||||
| 2026-02-13 | 13F | Walleye Capital LLC | 236.875 | 500 | ||||||
| 2026-02-17 | 13F | Jain Global LLC | 326.956 | 21,53 | 690 | 3,77 | ||||
| 2025-10-23 | 13F | SG Americas Securities, LLC | 0 | -100,00 | 0 | |||||
| 2026-02-10 | 13F | Acadian Asset Management Llc | 1.594.171 | -23,98 | 3 | -40,00 | ||||
| 2026-02-17 | 13F | D. E. Shaw & Co., Inc. | 2.337.112 | -23,74 | 4.931 | -34,85 | ||||
| 2026-02-17 | 13F | Russell Investments Group, Ltd. | 80.653 | 0,00 | 170 | -14,57 | ||||
| 2026-01-26 | 13F | Mirae Asset Global Investments Co., Ltd. | 13.537 | -54,91 | 29 | -62,16 | ||||
| 2026-02-09 | 13F | Geode Capital Management, Llc | 175.630 | 4,52 | 371 | -10,84 | ||||
| 2026-02-17 | 13F | Cresset Asset Management, LLC | 11.785 | 0,40 | 25 | -17,24 | ||||
| 2026-02-17 | 13F | Northern Trust Corp | 499.822 | 0,34 | 1.055 | -14,31 | ||||
| 2026-02-18 | 13F | Mackenzie Financial Corp | 118.931 | 254 | ||||||
| 2026-02-17 | 13F | Schonfeld Strategic Advisors LLC | 43.124 | 91 | ||||||
| 2026-02-06 | 13F | Gsa Capital Partners Llp | 0 | -100,00 | 0 | |||||
| 2026-02-10 | 13F | Goldman Sachs Group Inc | 225.159 | -42,50 | 475 | -50,88 | ||||
| 2026-02-12 | 13F | Jane Street Group, Llc | Put | 14.900 | 31 | |||||
| 2026-02-12 | 13F | Jane Street Group, Llc | 106.750 | 67,86 | 225 | 43,31 | ||||
| 2026-02-13 | 13F | Marshall Wace, Llp | 0 | -100,00 | 0 |
Other Listings
| US:TUYA | 2,31 $ |