Grundlæggende statistik
| Institutionelle aktier (lange) | 61.193.776 - 114,48% (ex 13D/G) - change of -15,56MM shares -20,32% MRQ |
| Institutionel værdi (lang) | $ 812.279 USD ($1000) |
Institutionelt ejerskab og aktionærer
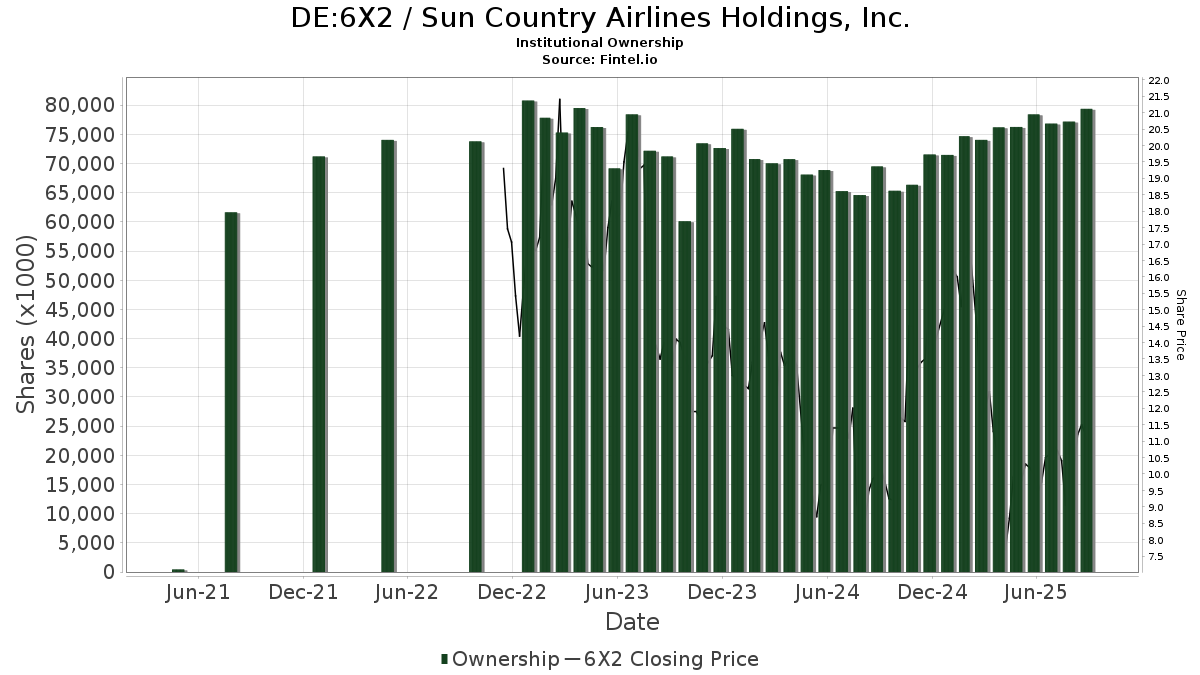
Sun Country Airlines Holdings, Inc. (DE:6X2) har 199 institutionelle ejere og aktionærer, der har indsendt 13D/G- eller 13F-formularer til Securities Exchange Commission (SEC). Disse institutioner har i alt 61,193,776 aktier. Største aktionærer omfatter BlackRock, Inc., Vanguard Group Inc, Frontier Capital Management Co Llc, Dimensional Fund Advisors Lp, Citadel Advisors Llc, Ameriprise Financial Inc, American Century Companies Inc, State Street Corp, Par Capital Management Inc, and U S Global Investors Inc .
Sun Country Airlines Holdings, Inc. (DB:6X2) institutionel ejerskabsstruktur viser aktuelle positioner i virksomheden efter institutioner og fonde, samt seneste ændringer i positionsstørrelse. Større aktionærer kan omfatte individuelle investorer, investeringsforeninger, hedgefonde eller institutioner. Skema 13D angiver, at investoren besidder (eller besidder) mere end 5 % af virksomheden og har til hensigt (eller har til hensigt at) aktivt at forfølge en ændring i forretningsstrategi. Skema 13G indikerer en passiv investering på over 5%.
The share price as of April 27, 2026 is 14,00 / share. Previously, on April 29, 2025, the share price was 8,55 / share. This represents an increase of 63,74% over that period.
Fondens stemningsscore
Fund Sentiment Score (fka Ownership Accumulation Score) finder de aktier, der bliver mest købt af fonde. Det er resultatet af en sofistikeret, multi-faktor kvantitativ model, der identificerer virksomheder med de højeste niveauer af institutionel akkumulering. Scoringsmodellen bruger en kombination af den samlede stigning i oplyste ejere, ændringerne i porteføljeallokeringer i disse ejere og andre målinger. Tallet går fra 0 til 100, hvor højere tal indikerer et højere niveau af akkumulering for sine jævnaldrende, og 50 er gennemsnittet.
Opdateringsfrekvens: Dagligt
Se Ownership Explorer, som giver en liste over højest rangerende virksomheder.
AI+ Ask Fintel’s AI assistant about Sun Country Airlines Holdings, Inc..
Select a question to share a public post with an AI-crafted answer.
Thinking of good questions…
13F og NPORT arkivering
Detaljer om 13F-arkivering er gratis. Detaljer om NP-ansøgninger kræver et premium-medlemskab. Grønne rækker angiver nye positioner. Røde rækker angiver lukkede positioner. Klik på linket ikon for at se den fulde transaktionshistorik.
Opgrader
for at låse premium-data op og eksportere til Excel ![]() .
.
| Fil dato | Kilde | Investor | Type | Gennemsnitlig pris (Øst) |
Aktier | Δ Aktier (%) |
Rapporteret Værdi ($1000) |
Δ Værdi (%) |
Port Alloc (%) |
|
|---|---|---|---|---|---|---|---|---|---|---|
| 2026-02-17 | 13F | MIRAE ASSET GLOBAL ETFS HOLDINGS Ltd. | 23.764 | -1,16 | 342 | 20,49 | ||||
| 2026-02-06 | 13F | Larson Financial Group LLC | 216 | 300,00 | 3 | |||||
| 2026-02-13 | 13F | Thomist Capital Management, LP | 555.935 | 1.864,43 | 8.002 | 2.267,16 | ||||
| 2026-02-18 | 13F | GWM Advisors LLC | 0 | -100,00 | 0 | |||||
| 2026-02-17 | 13F | Susquehanna Fundamental Investments, Llc | 26.206 | 377 | ||||||
| 2025-11-14 | 13F | Centiva Capital, LP | 0 | -100,00 | 0 | |||||
| 2026-02-05 | 13F | Allworth Financial LP | 668 | 56,81 | 10 | 80,00 | ||||
| 2026-04-06 | 13F | GAMMA Investing LLC | 7.781 | 52,30 | 129 | 75,34 | ||||
| 2026-02-02 | 13F | Fifth Third Bancorp | 422 | 9,04 | 6 | 50,00 | ||||
| 2026-04-28 | 13F | Alberta Investment Management Corp | 131.580 | 2.174 | ||||||
| 2026-02-18 | 13F | EP Wealth Advisors, Inc. | 11.993 | -10,25 | 173 | 9,55 | ||||
| 2026-02-09 | 13F | Hartland & Co., LLC | 0 | -100,00 | 0 | |||||
| 2026-02-10 | 13F | Globeflex Capital L P | 7.500 | 0,00 | 108 | 21,59 | ||||
| 2026-02-17 | 13F | Empyrean Capital Partners, LP | 640.000 | -12,57 | 9.210 | 6,52 | ||||
| 2026-02-04 | 13F | Bailard, Inc. | 30.100 | 433 | ||||||
| 2026-02-13 | 13F | Victory Capital Management Inc | 322.507 | -0,47 | 4.641 | 21,28 | ||||
| 2026-02-17 | 13F | Gotham Asset Management, LLC | 128.571 | -35,81 | 1.850 | -21,78 | ||||
| 2026-02-20 | 13F | Sunbelt Securities, Inc. | 138 | 0,00 | 2 | 0,00 | ||||
| 2026-04-13 | 13F | Massmutual Trust Co Fsb/adv | 395 | 3,13 | 7 | 20,00 | ||||
| 2026-02-13 | 13F | Prudential Financial Inc | 177.676 | -6,25 | 2.557 | 14,21 | ||||
| 2026-04-20 | 13F | Louisiana State Employees Retirement System | 23.700 | -1,66 | 392 | 13,01 | ||||
| 2026-02-17 | 13F | J. Goldman & Co LP | 75.435 | 1.086 | ||||||
| 2026-02-17 | 13F | Algert Global Llc | 320.553 | 38,01 | 5 | 100,00 | ||||
| 2026-02-09 | 13F | Atlantic Trust, LLC | 0 | -100,00 | 0 | |||||
| 2026-02-17 | 13F | Canada Pension Plan Investment Board | 20.500 | 295 | ||||||
| 2026-04-21 | 13F | Gilpin Wealth Management, Llc | 15 | 275,00 | 0 | |||||
| 2026-01-22 | 13F | Brookwood Investment Group LLC | 11.707 | 168 | ||||||
| 2026-02-13 | 13F | Charles Schwab Investment Management Inc | 819.740 | 5,71 | 11.796 | 28,82 | ||||
| 2026-04-20 | 13F | State of Alaska, Department of Revenue | 48.413 | 0,00 | 1 | |||||
| 2026-02-13 | 13F | Wells Fargo & Company/mn | 60.062 | 34,23 | 864 | 63,64 | ||||
| 2025-11-06 | 13F | ProShare Advisors LLC | 0 | -100,00 | 0 | |||||
| 2026-04-24 | 13F | SummerHaven Investment Management, LLC | 56.661 | -10,48 | 936 | 2,86 | ||||
| 2026-01-15 | 13F | Nisa Investment Advisors, Llc | 4.891 | 2,02 | 70 | 25,00 | ||||
| 2026-02-13 | 13F | First Trust Advisors Lp | 188.310 | 9,03 | 2.710 | 32,86 | ||||
| 2026-02-11 | 13F | O'shaughnessy Asset Management, Llc | 273.066 | 29,80 | 3.929 | 58,17 | ||||
| 2026-02-17 | 13F | Qube Research & Technologies Ltd | 174.295 | -72,17 | 2.508 | -66,09 | ||||
| 2026-02-11 | 13F | Empowered Funds, LLC | 182.010 | -30,56 | 2.619 | -15,38 | ||||
| 2026-02-13 | 13F | Arrowstreet Capital, Limited Partnership | 1.212.639 | -3,83 | 17.450 | 17,18 | ||||
| 2026-02-11 | 13F | Primecap Management Co/ca/ | 142.915 | -0,14 | 2.057 | 21,66 | ||||
| 2026-02-17 | 13F | Zimmer Partners, LP | 1.051.408 | -49,84 | 15.130 | -38,88 | ||||
| 2025-11-14 | 13F | Cubist Systematic Strategies, LLC | 0 | -100,00 | 0 | -100,00 | ||||
| 2026-02-17 | 13F | Apollo Management Holdings, L.P. | 0 | -100,00 | 0 | |||||
| 2025-11-13 | 13F | Dynamic Technology Lab Private Ltd | 0 | -100,00 | 0 | |||||
| 2026-02-11 | 13F | Illinois Municipal Retirement Fund | 26.741 | 27,44 | 385 | 55,47 | ||||
| 2026-02-17 | 13F | Balyasny Asset Management Llc | 43.300 | -39,21 | 623 | -25,92 | ||||
| 2026-04-24 | 13F | Root Financial Partners, LLC | 67 | 1 | ||||||
| 2025-11-14 | 13F | Petrus Trust Company, LTA | 0 | -100,00 | 0 | |||||
| 2026-02-17 | 13F | Engineers Gate Manager LP | 0 | -100,00 | 0 | |||||
| 2026-02-17 | 13F | Citadel Advisors Llc | Put | 39.600 | 186,96 | 570 | 251,23 | |||
| 2026-02-17 | 13F | Citadel Advisors Llc | Call | 44.000 | -42,71 | 633 | -30,21 | |||
| 2026-01-23 | 13F | Assetmark, Inc | 233 | 0,00 | 3 | 50,00 | ||||
| 2026-04-27 | 13F | Td Private Client Wealth Llc | 52 | 0,00 | 1 | |||||
| 2026-02-09 | 13F | Geode Capital Management, Llc | 1.265.704 | 1,18 | 18.218 | 23,29 | ||||
| 2026-02-06 | 13F | Lsv Asset Management | 1.150.278 | -0,85 | 17 | 23,08 | ||||
| 2026-02-17 | 13F | Sherbrooke Park Advisers Llc | 0 | -100,00 | 0 | |||||
| 2026-01-29 | 13F | Teachers Retirement System Of The State Of Kentucky | 10.059 | 0,00 | 0 | |||||
| 2026-02-05 | 13F | Dana Investment Advisors, Inc. | 685.504 | -0,13 | 9.864 | 21,69 | ||||
| 2026-02-13 | 13F | Boston Partners | 173.138 | -10,78 | 2.491 | 8,73 | ||||
| 2026-02-10 | 13F | Quantbot Technologies LP | 0 | -100,00 | 0 | |||||
| 2026-02-12 | 13F | Wealthspire Advisors, LLC | 0 | -100,00 | 0 | |||||
| 2026-01-28 | 13F | Universal- Beteiligungs- und Servicegesellschaft mbH | 188.000 | 0,00 | 2.705 | 21,85 | ||||
| 2026-02-17 | 13F | Tower Research Capital LLC (TRC) | 5.284 | 4,41 | 76 | 28,81 | ||||
| 2026-04-24 | 13F | UMA Financial Services, Inc. | 200 | 0,00 | 3 | 50,00 | ||||
| 2026-02-05 | 13F | Amalgamated Bank | 15.272 | 1,29 | 0 | |||||
| 2026-02-17 | 13F | Lighthouse Investment Partners, LLC | 0 | -100,00 | 0 | |||||
| 2026-02-13 | 13F | Public Sector Pension Investment Board | 0 | -100,00 | 0 | |||||
| 2026-02-12 | 13F | Campbell & CO Investment Adviser LLC | 0 | -100,00 | 0 | |||||
| 2026-04-24 | 13F | Strs Ohio | 5.200 | 86 | ||||||
| 2026-02-06 | 13F | Pnc Financial Services Group, Inc. | 2.420 | -2,18 | 35 | 17,24 | ||||
| 2026-04-29 | 13F | Police & Firemen's Retirement System of New Jersey | 13.374 | 0,00 | 221 | 14,58 | ||||
| 2026-02-09 | 13F | Royce & Associates Lp | 118.141 | 28,83 | 1.700 | 57,12 | ||||
| 2026-02-17 | 13F | Citadel Advisors Llc | 2.641.992 | -8,48 | 38.018 | 11,51 | ||||
| 2026-02-17 | 13F | Aqr Capital Management Llc | 430.243 | -17,27 | 6.191 | 0,80 | ||||
| 2026-02-11 | 13F | Franklin Resources Inc | 121.498 | -3,62 | 1.748 | 17,47 | ||||
| 2026-02-13 | 13F | Barclays Plc | 81.128 | -40,14 | 1.167 | -27,06 | ||||
| 2026-04-14 | 13F | USA Financial Portformulas Corp | 1.066 | 18 | ||||||
| 2026-02-10 | 13F | Savant Capital, LLC | 0 | -100,00 | 0 | |||||
| 2026-02-17 | 13F | Hancock Whitney Corp | 40.173 | -3,99 | 578 | 17,00 | ||||
| 2026-02-03 | 13F | Privium Fund Management (UK) Ltd | 33.024 | 475 | ||||||
| 2026-02-02 | 13F | Principal Financial Group Inc | 401.854 | 14,67 | 5.783 | 39,73 | ||||
| 2026-02-17 | 13F | Par Capital Management Inc | Put | 18.000 | 259 | |||||
| 2026-02-17 | 13F | Aquatic Capital Management LLC | 0 | -100,00 | 0 | |||||
| 2026-02-17 | 13F | Par Capital Management Inc | 2.000.000 | -3,24 | 28.780 | 17,90 | ||||
| 2026-04-13 | 13F | IFP Advisors, Inc | 6 | 0,00 | 0 | |||||
| 2026-02-17 | 13F | Fmr Llc | 283.621 | -6,95 | 4.081 | 13,39 | ||||
| 2026-02-13 | 13F | Umb Bank N A/mo | 313 | 126,81 | 5 | 300,00 | ||||
| 2026-02-13 | 13F | Bridgewater Associates, LP | 713.667 | -17,16 | 10.270 | 0,93 | ||||
| 2026-02-17 | 13F | Optiver Holding B.V. | 202 | -66,56 | 3 | -71,43 | ||||
| 2026-04-27 | 13F | Sound Income Strategies, LLC | 418 | 0,00 | 7 | 0,00 | ||||
| 2026-02-17 | 13F | Mercer Global Advisors Inc /adv | 14.399 | 207 | ||||||
| 2025-11-14 | 13F | Mount Yale Investment Advisors, LLC | 0 | -100,00 | 0 | -100,00 | ||||
| 2026-02-13 | 13F | Hudson Bay Capital Management LP | 0 | -100,00 | 0 | |||||
| 2026-02-17 | 13F | Hotchkis & Wiley Capital Management Llc | 293.149 | 1,35 | 4.218 | 23,48 | ||||
| 2026-04-22 | 13F | Sterling Capital Management LLC | 920 | -37,03 | 15 | -28,57 | ||||
| 2026-04-15 | 13F | Exchange Traded Concepts, Llc | 0 | -100,00 | 0 | |||||
| 2026-04-24 | 13F | Yousif Capital Management, Llc | 14.074 | 0,67 | 233 | -4,92 | ||||
| 2026-02-17 | 13F | Russell Investments Group, Ltd. | 382.368 | 17,44 | 5.502 | 43,09 | ||||
| 2026-03-16 | 13F/A | Rockefeller Capital Management L.P. | 3.532 | -6,73 | 51 | 13,64 | ||||
| 2026-02-11 | 13F | Deutsche Bank Ag\ | 35.219 | 17,24 | 507 | 42,94 | ||||
| 2026-02-17 | 13F | Raymond James Financial Inc | 46.840 | 26,94 | 674 | 54,94 | ||||
| 2025-11-07 | 13F/A | Merit Financial Group, LLC | 0 | -100,00 | 0 | |||||
| 2026-02-17 | 13F | Aster Capital Management (DIFC) Ltd | 385 | 6 | ||||||
| 2026-02-10 | 13F | Intech Investment Management Llc | 14.730 | -15,71 | 212 | 2,43 | ||||
| 2026-02-13 | 13F | Manufacturers Life Insurance Company, The | 0 | -100,00 | 0 | |||||
| 2026-04-29 | 13F | Oregon Public Employees Retirement Fund | 12.204 | 0,83 | 202 | 15,52 | ||||
| 2026-02-12 | 13F | Ankerstar Wealth, LLC | 10 | 0 | ||||||
| 2025-11-07 | 13F | Gsa Capital Partners Llp | 0 | -100,00 | 0 | |||||
| 2026-02-11 | 13F | Winton Capital Group Ltd | 99.195 | -6,26 | 1.427 | 14,25 | ||||
| 2025-11-14 | 13F | Jain Global LLC | 0 | -100,00 | 0 | |||||
| 2026-02-17 | 13F | Guggenheim Capital Llc | 22.151 | 319 | ||||||
| 2025-11-12 | 13F | Group One Trading, L.p. | 0 | -100,00 | 0 | |||||
| 2025-11-14 | 13F | Brevan Howard Capital Management LP | 0 | -100,00 | 0 | |||||
| 2026-02-09 | 13F | Quest Partners LLC | 3.222 | 14,05 | 46 | 39,39 | ||||
| 2026-02-17 | 13F | SummitTX Capital, L.P. | 875.650 | 180,64 | 12.601 | 242,02 | ||||
| 2026-02-17 | 13F | California State Teachers Retirement System | 3.151 | -1,41 | 45 | 21,62 | ||||
| 2026-02-17 | 13F | Royal Bank Of Canada | 2.912 | -97,69 | 42 | -97,18 | ||||
| 2025-11-06 | 13F | Versor Investments LP | 0 | -100,00 | 0 | |||||
| 2026-02-06 | 13F | HighTower Advisors, LLC | 12.755 | -0,23 | 184 | 22,00 | ||||
| 2026-02-17 | 13F | Bank Of America Corp /de/ | 294.124 | -19,35 | 4.232 | -1,72 | ||||
| 2025-11-12 | 13F | Simplex Trading, Llc | 0 | -100,00 | 0 | |||||
| 2026-01-29 | 13F | Vanguard Group Inc | 4.565.031 | -5,25 | 65.691 | 15,45 | ||||
| 2026-02-05 | 13F | Thrivent Financial For Lutherans | 36.223 | -5,83 | 1 | |||||
| 2025-11-14 | 13F | ISAM Funds (UK) Ltd | 0 | -100,00 | 0 | |||||
| 2026-04-23 | 13F | SJS Investment Consulting Inc. | 4 | 0 | ||||||
| 2026-02-09 | 13F | Huntington National Bank | 0 | -100,00 | 0 | |||||
| 2026-02-03 | 13F | SBI Securities Co., Ltd. | 0 | -100,00 | 0 | |||||
| 2026-02-12 | 13F | Quadrant Capital Group Llc | 869 | 18,55 | 13 | 50,00 | ||||
| 2026-02-13 | 13F | Verition Fund Management LLC | 63.526 | -2,18 | 914 | 19,32 | ||||
| 2026-02-17 | 13F | Price T Rowe Associates Inc /md/ | 1.587.181 | 32,30 | 23 | 57,14 | ||||
| 2026-01-29 | 13F | Comerica Bank | 211.136 | -24,03 | 3.038 | -7,43 | ||||
| 2026-04-16 | 13F | SG Americas Securities, LLC | 205.916 | 896,30 | 3 | |||||
| 2026-02-17 | 13F | Watershed Asset Management, L.L.C. | 30.237 | 435 | ||||||
| 2026-04-24 | 13F | CIBRA Capital Ltd | 22.518 | 372 | ||||||
| 2026-02-10 | 13F | Commonwealth Of Pennsylvania Public School Empls Retrmt Sys | 13.050 | -3,89 | 188 | 16,88 | ||||
| 2026-02-10 | 13F | Acadian Asset Management Llc | 3.141 | -97,85 | 0 | -100,00 | ||||
| 2026-04-20 | 13F | Ritholtz Wealth Management | 10.554 | 174 | ||||||
| 2026-04-07 | 13F | Signaturefd, Llc | 349 | 55,11 | 6 | 66,67 | ||||
| 2026-04-23 | 13F | Farmers & Merchants Investments Inc | 25 | 0,00 | 0 | |||||
| 2026-02-12 | 13F | CIBC Private Wealth Group, LLC | 16.460 | 0,07 | 237 | 21,65 | ||||
| 2026-02-17 | 13F | Advisor Group Holdings, Inc. | 995 | 45,89 | 14 | 75,00 | ||||
| 2026-02-12 | 13F | State Board Of Administration Of Florida Retirement System | 10.760 | 0,00 | 155 | 21,26 | ||||
| 2026-02-13 | 13F | Blueshift Asset Management, LLC | 0 | -100,00 | 0 | |||||
| 2026-02-17 | 13F | Millennium Management Llc | 0 | -100,00 | 0 | |||||
| 2026-04-21 | 13F | Alpine Associates Management Inc. | 1.132.850 | 18.715 | ||||||
| 2026-02-10 | 13F | Bank of New York Mellon Corp | 1.155.679 | -6,37 | 16.630 | 14,08 | ||||
| 2026-02-10 | 13F | Goldman Sachs Group Inc | 1.178.305 | 59,39 | 16.956 | 94,22 | ||||
| 2026-02-18 | 13F | State of Tennessee, Treasury Department | 19.571 | -23,81 | 343 | 13,20 | ||||
| 2026-04-13 | 13F | True Wealth Design, LLC | 109 | 0,00 | 2 | 0,00 | ||||
| 2025-11-14 | 13F | Point72 (DIFC) Ltd | 0 | -100,00 | 0 | -100,00 | ||||
| 2026-02-17 | 13F | Bridgeway Capital Management Inc | 471.810 | -27,40 | 6.789 | -11,54 | ||||
| 2026-02-06 | 13F | EverSource Wealth Advisors, LLC | 1.261 | -2,85 | 18 | 20,00 | ||||
| 2026-02-17 | 13F | Tcw Group Inc | 558.825 | 8.041 | ||||||
| 2026-02-13 | 13F | MAI Capital Management | 95 | 0,00 | 1 | 0,00 | ||||
| 2026-02-17 | 13F | Frontier Capital Management Co Llc | 3.287.513 | -1,29 | 47.307 | 20,28 | ||||
| 2026-02-13 | 13F | Martingale Asset Management L P | 90.649 | 4,86 | 1.304 | 27,84 | ||||
| 2026-02-12 | 13F | MetLife Investment Management, LLC | 31.359 | 0,00 | 451 | 21,89 | ||||
| 2025-10-29 | 13F | Maryland State Retirement & Pension System | 0 | -100,00 | 0 | |||||
| 2026-04-28 | 13F | Harbor Capital Advisors, Inc. | 633 | 76,82 | 0 | |||||
| 2026-01-28 | 13F | Financial Perspectives, Inc | 10 | 0,00 | 0 | |||||
| 2026-02-05 | 13F | Bessemer Group Inc | 216.854 | 102.674,41 | 3 | |||||
| 2026-04-27 | 13F | New York State Teachers Retirement System | 16.263 | -9,53 | 0 | |||||
| 2026-01-28 | 13F | DekaBank Deutsche Girozentrale | 4.451 | 0,00 | 0 | |||||
| 2025-11-07 | 13F | Readystate Asset Management Lp | 0 | -100,00 | 0 | |||||
| 2026-04-14 | 13F | Prospera Financial Services Inc | 26.581 | -2,72 | 439 | 11,70 | ||||
| 2026-02-18 | 13F | Mackenzie Financial Corp | 14.217 | 0,00 | 204 | 22,16 | ||||
| 2026-02-13 | 13F | State Street Corp | 2.023.372 | 7,21 | 29.116 | 30,63 | ||||
| 2026-02-13 | 13F | Quarry LP | 84 | -80,51 | 1 | -80,00 | ||||
| 2026-01-15 | 13F | Fortitude Family Office, LLC | 0 | -100,00 | 0 | |||||
| 2026-01-28 | 13F | U S Global Investors Inc | 1.611.228 | -11,87 | 23.186 | 7,38 | ||||
| 2026-02-13 | 13F | Ieq Capital, Llc | 0 | -100,00 | 0 | |||||
| 2026-02-17 | 13F | Two Sigma Advisers, Lp | 75.400 | 238,12 | 1.085 | 312,55 | ||||
| 2025-11-14 | 13F | Oxford Asset Management Llp | 0 | -100,00 | 0 | -100,00 | ||||
| 2026-02-17 | 13F | Ameriprise Financial Inc | 2.621.812 | -0,58 | 37.728 | 21,14 | ||||
| 2025-11-14 | 13F | Texas Permanent School Fund | 0 | -100,00 | 0 | |||||
| 2026-02-13 | 13F | Smartleaf Asset Management LLC | 210 | 0,48 | 3 | 50,00 | ||||
| 2026-02-11 | 13F | Parallel Advisors, LLC | 81 | 1 | ||||||
| 2026-03-09 | 13F | EMC Capital Management | 7.415 | -15,00 | 0 | |||||
| 2026-02-02 | 13F | Horizon Investments, LLC | 42.446 | 0,55 | 611 | 22,49 | ||||
| 2026-02-12 | 13F | Renaissance Technologies Llc | 121.800 | -38,24 | 1.753 | -24,74 | ||||
| 2026-01-28 | 13F | Salomon & Ludwin, LLC | 336 | -16,00 | 5 | 25,00 | ||||
| 2025-11-13 | 13F | FIL Ltd | 0 | -100,00 | 0 | |||||
| 2026-02-10 | 13F | Rothschild Investment Llc | 120 | 0,00 | 2 | 0,00 | ||||
| 2026-01-29 | 13F | UBS Group AG | 335.482 | -58,00 | 4.828 | -48,83 | ||||
| 2026-02-17 | 13F | Susquehanna International Group, Llp | 128.678 | 357,16 | 1.852 | 457,53 | ||||
| 2025-11-06 | 13F | Ameritas Advisory Services, LLC | 0 | -100,00 | 0 | -100,00 | ||||
| 2026-02-06 | 13F | Global Retirement Partners, LLC | 92 | 0,00 | 1 | 0,00 | ||||
| 2026-03-12 | 13F/A | Peak6 Llc | Call | 17.600 | 19,73 | 253 | 46,24 | |||
| 2026-02-11 | 13F | Ameritas Investment Partners, Inc. | 4.275 | 62 | ||||||
| 2026-02-13 | 13F | Citigroup Inc | 12.606 | -30,72 | 181 | -15,42 | ||||
| 2026-02-11 | 13F | Cedar Mountain Advisors, LLC | 55 | 14,58 | 1 | |||||
| 2026-02-13 | 13F | Sei Investments Co | 17.998 | 11,28 | 259 | 35,08 | ||||
| 2026-02-10 | 13F | Bnp Paribas Arbitrage, Sa | 11.574 | -92,03 | 167 | -90,32 | ||||
| 2026-02-13 | 13F | Parkside Financial Bank & Trust | 109 | 0,00 | 2 | 0,00 | ||||
| 2026-02-12 | 13F | Nuveen, LLC | 623.623 | 537,66 | 8.974 | 676,88 | ||||
| 2026-02-04 | 13F | Valeo Financial Advisors, LLC | 0 | -100,00 | 0 | |||||
| 2026-04-08 | 13F | Wealth Enhancement Advisory Services, Llc | 16.213 | 23,81 | 273 | 35,82 | ||||
| 2026-02-11 | 13F | Jpmorgan Chase & Co | 128.758 | 501,42 | 1.853 | 634,92 | ||||
| 2026-02-05 | 13F | Northwestern Mutual Wealth Management Co | 500 | 267,65 | 2 | 0,00 | ||||
| 2025-12-01 | 13F/A | Polar Asset Management Partners Inc. | 0 | -100,00 | 0 | -100,00 | ||||
| 2026-02-06 | 13F | FourThought Financial Partners, LLC | 20.577 | -29,10 | 296 | -13,45 | ||||
| 2026-02-04 | 13F | Dogwood Wealth Management LLC | 488 | 269,70 | 7 | 600,00 | ||||
| 2026-02-13 | 13F | Segall Bryant & Hamill, Llc | 35.598 | -0,76 | 512 | 21,04 | ||||
| 2026-02-13 | 13F | Y-Intercept (Hong Kong) Ltd | 0 | -100,00 | 0 | |||||
| 2026-02-12 | 13F | BlackRock, Inc. | 7.741.906 | 1,14 | 111.406 | 23,24 | ||||
| 2026-02-13 | 13F | SRS Capital Advisors, Inc. | 213 | -98,35 | 3 | -98,03 | ||||
| 2026-02-12 | 13F | Federated Hermes, Inc. | 93.551 | -67,00 | 1.346 | -59,78 | ||||
| 2026-02-17 | 13F | Boothbay Fund Management, Llc | 0 | -100,00 | 0 | |||||
| 2025-11-13 | 13F | Schroder Investment Management Group | 0 | -100,00 | 0 | |||||
| 2026-01-16 | 13F | Empirical Financial Services, LLC d.b.a. Empirical Wealth Management | 0 | -100,00 | 0 | |||||
| 2026-02-12 | 13F | Voya Investment Management Llc | 51.935 | 20,13 | 747 | 46,47 | ||||
| 2026-02-17 | 13F | Susquehanna International Group, Llp | Call | 0 | -100,00 | 0 | ||||
| 2025-11-12 | 13F | CIBC Bancorp USA Inc. | 21.902 | 259 | ||||||
| 2026-02-13 | 13F | American Century Companies Inc | 2.095.258 | 5,34 | 30.151 | 28,35 | ||||
| 2026-02-13 | 13F | Pinnacle Wealth Planning Services, Inc. | 1.014 | 15 | ||||||
| 2026-02-12 | 13F | Dimensional Fund Advisors Lp | 2.685.524 | 6,41 | 38.645 | 29,66 | ||||
| 2026-02-13 | 13F | Marshall Wace, Llp | 15.124 | 218 | ||||||
| 2026-04-20 | 13F | Assenagon Asset Management S.A. | 726.460 | 995,53 | 12.001 | 1.157,97 | ||||
| 2026-02-12 | 13F | Jane Street Group, Llc | Call | 10.200 | -58,70 | 147 | -49,83 | |||
| 2025-11-14 | 13F | Squarepoint Ops LLC | 0 | -100,00 | 0 | |||||
| 2026-02-12 | 13F | Jane Street Group, Llc | 130.688 | 1.881 | ||||||
| 2026-02-17 | 13F | Quantinno Capital Management LP | 64.991 | 96,44 | 935 | 139,74 | ||||
| 2026-02-17 | 13F | State Of Wisconsin Investment Board | 102.228 | -29,22 | 1.471 | -13,72 | ||||
| 2026-04-06 | 13F | Versant Capital Management, Inc | 4.198 | 0,82 | 69 | 16,95 | ||||
| 2026-02-17 | 13F | Summit Global Investments | 26.556 | -52,86 | 0 | |||||
| 2026-04-16 | 13F | Baron Wealth Management LLC | 12.862 | -1,94 | 212 | 12,77 | ||||
| 2026-02-13 | 13F | Rhumbline Advisers | 150.267 | -6,39 | 2.162 | 14,09 | ||||
| 2025-11-13 | 13F | Macquarie Group Ltd | 0 | -100,00 | 0 | -100,00 | ||||
| 2026-02-13 | 13F | Walleye Capital LLC | 241.493 | 3.475 | ||||||
| 2026-02-04 | 13F | Pacer Advisors, Inc. | 0 | -100,00 | 0 | -100,00 | ||||
| 2026-02-09 | 13F | Annis Gardner Whiting Capital Advisors, LLC | 75 | 0,00 | 1 | |||||
| 2026-02-12 | 13F | New York State Common Retirement Fund | 12.161 | 0,00 | 175 | 21,68 | ||||
| 2026-02-17 | 13F | XTX Topco Ltd | 0 | -100,00 | 0 | -100,00 | ||||
| 2026-01-26 | 13F | Cwm, Llc | 22.933 | -16,98 | 0 | |||||
| 2026-02-17 | 13F | Northern Trust Corp | 586.276 | -5,13 | 8.437 | 15,59 | ||||
| 2026-02-17 | 13F | T. Rowe Price Investment Management, Inc. | 647.474 | -64,88 | 9 | -57,14 | ||||
| 2026-02-09 | 13F | Legal & General Group Plc | 83.750 | -3,90 | 1.205 | 17,10 | ||||
| 2026-02-13 | 13F | Walleye Capital LLC | Put | 3.100 | 45 | |||||
| 2026-02-17 | 13F | Jump Financial, LLC | 0 | -100,00 | 0 | |||||
| 2026-02-17 | 13F | Man Group plc | 45.464 | 25,93 | 654 | 53,52 | ||||
| 2025-11-13 | 13F | Jefferies Financial Group Inc. | 0 | -100,00 | 0 | |||||
| 2026-04-07 | 13F | Farther Finance Advisors, LLC | 2.376 | -10,34 | 40 | 5,26 | ||||
| 2026-02-11 | 13F | Los Angeles Capital Management Llc | 33.404 | -35,30 | 376 | -38,26 | ||||
| 2026-02-17 | 13F | Alliancebernstein L.p. | 49.810 | -12,35 | 717 | 6,71 | ||||
| 2026-02-19 | 13F | Invesco Ltd. | 371.814 | 7,91 | 5.350 | 31,48 | ||||
| 2026-01-30 | 13F | Us Bancorp \de\ | 16.677 | 11,91 | 240 | 36,57 | ||||
| 2026-02-17 | 13F | Two Sigma Investments, Lp | 293.511 | 253,06 | 4.224 | 330,48 | ||||
| 2026-02-02 | 13F | VELA Investment Management, LLC | 239.179 | 14,20 | 3.442 | 39,14 | ||||
| 2026-02-06 | 13F | Covestor Ltd | 678 | 0,30 | 0 | |||||
| 2026-02-11 | 13F | Brandywine Global Investment Management, LLC | 0 | -100,00 | 0 | |||||
| 2026-02-12 | 13F | South Dakota Investment Council | 205.450 | -8,51 | 3 | 0,00 | ||||
| 2026-02-17 | 13F | D. E. Shaw & Co., Inc. | 506.287 | -17,89 | 7.285 | 0,04 | ||||
| 2026-04-29 | 13F | Skopos Labs, Inc. | 180.708 | 487,32 | 2.985 | 575,34 | ||||
| 2026-02-13 | 13F | Meros Investment Management, LP | 79.844 | 1.149 | ||||||
| 2026-02-11 | 13F | Meeder Asset Management Inc | 9.883 | 0,00 | 142 | 22,41 | ||||
| 2026-02-17 | 13F | Creative Planning | 117.827 | 91,21 | 1.696 | 133,15 | ||||
| 2026-02-13 | 13F | Morgan Stanley | 619.081 | -26,95 | 8.909 | -10,99 | ||||
| 2026-02-17 | 13F | Point72 Asset Management, L.P. | 192.989 | -88,69 | 2.777 | -86,22 | ||||
| 2026-02-10 | 13F | State of Wyoming | 0 | -100,00 | 0 | |||||
| 2026-02-13 | 13F | Ubs Asset Management Americas Inc | 59 | 1 | ||||||
| 2026-02-11 | 13F | CSM Advisors, LLC | 567.512 | 11,93 | 8 | 60,00 | ||||
| 2026-02-09 | 13F | Hantz Financial Services, Inc. | 1.501 | 86,23 | 0 | |||||
| 2026-02-13 | 13F | Kilter Group LLC | 9 | 0 |
Other Listings
| US:SNCY | 16,15 $ |