Grundlæggende statistik
| Institutionelle aktier (lange) | 13.818.954 - 66,39% (ex 13D/G) - change of -2,67MM shares -16,17% MRQ |
| Institutionel værdi (lang) | $ 279.310 USD ($1000) |
Institutionelt ejerskab og aktionærer
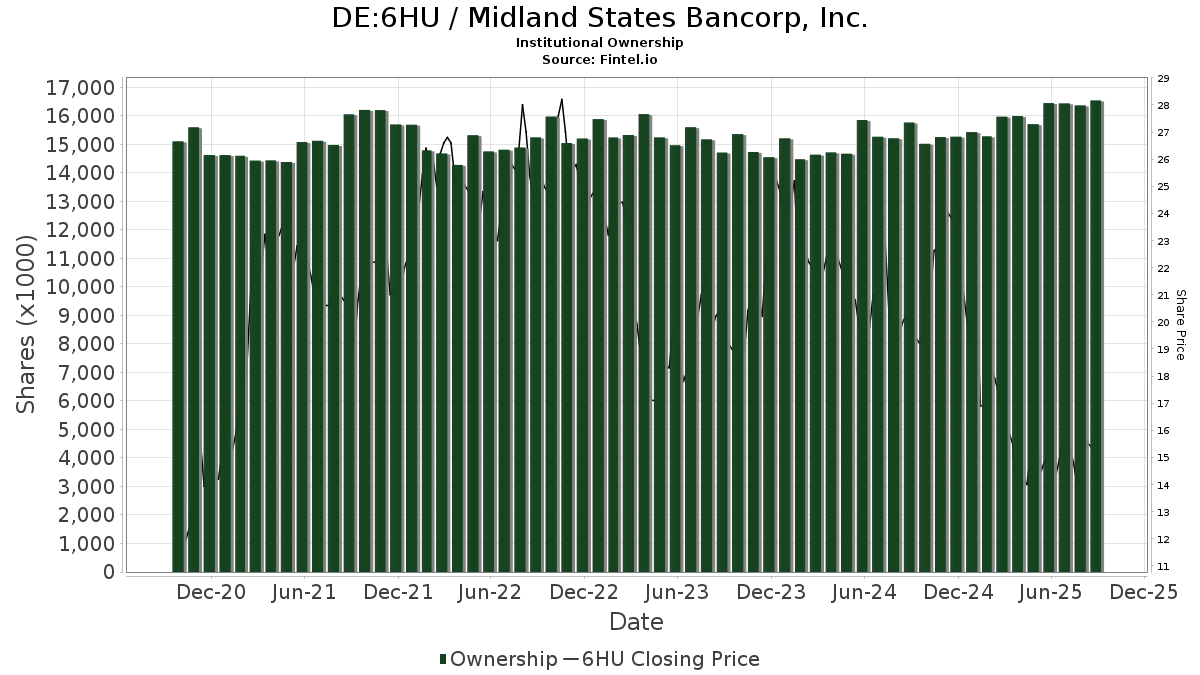
Midland States Bancorp, Inc. (DE:6HU) har 141 institutionelle ejere og aktionærer, der har indsendt 13D/G- eller 13F-formularer til Securities Exchange Commission (SEC). Disse institutioner har i alt 13,818,954 aktier. Største aktionærer omfatter BlackRock, Inc., Vanguard Group Inc, Dimensional Fund Advisors Lp, Busey Wealth Management, State Street Corp, American Century Companies Inc, Geode Capital Management, Llc, Aqr Capital Management Llc, Hotchkis & Wiley Capital Management Llc, and Lsv Asset Management .
Midland States Bancorp, Inc. (DB:6HU) institutionel ejerskabsstruktur viser aktuelle positioner i virksomheden efter institutioner og fonde, samt seneste ændringer i positionsstørrelse. Større aktionærer kan omfatte individuelle investorer, investeringsforeninger, hedgefonde eller institutioner. Skema 13D angiver, at investoren besidder (eller besidder) mere end 5 % af virksomheden og har til hensigt (eller har til hensigt at) aktivt at forfølge en ændring i forretningsstrategi. Skema 13G indikerer en passiv investering på over 5%.
The share price as of April 27, 2026 is 21,00 / share. Previously, on May 2, 2025, the share price was 15,10 / share. This represents an increase of 39,07% over that period.
Fondens stemningsscore
Fund Sentiment Score (fka Ownership Accumulation Score) finder de aktier, der bliver mest købt af fonde. Det er resultatet af en sofistikeret, multi-faktor kvantitativ model, der identificerer virksomheder med de højeste niveauer af institutionel akkumulering. Scoringsmodellen bruger en kombination af den samlede stigning i oplyste ejere, ændringerne i porteføljeallokeringer i disse ejere og andre målinger. Tallet går fra 0 til 100, hvor højere tal indikerer et højere niveau af akkumulering for sine jævnaldrende, og 50 er gennemsnittet.
Opdateringsfrekvens: Dagligt
Se Ownership Explorer, som giver en liste over højest rangerende virksomheder.
AI+ Ask Fintel’s AI assistant about Midland States Bancorp, Inc..
Select a question to share a public post with an AI-crafted answer.
Thinking of good questions…
13F og NPORT arkivering
Detaljer om 13F-arkivering er gratis. Detaljer om NP-ansøgninger kræver et premium-medlemskab. Grønne rækker angiver nye positioner. Røde rækker angiver lukkede positioner. Klik på linket ikon for at se den fulde transaktionshistorik.
Opgrader
for at låse premium-data op og eksportere til Excel ![]() .
.
| Fil dato | Kilde | Investor | Type | Gennemsnitlig pris (Øst) |
Aktier | Δ Aktier (%) |
Rapporteret Værdi ($1000) |
Δ Værdi (%) |
Port Alloc (%) |
|
|---|---|---|---|---|---|---|---|---|---|---|
| 2026-04-13 | 13F | IFP Advisors, Inc | 5.303 | 0,00 | 118 | 5,36 | ||||
| 2026-02-11 | 13F | Parallel Advisors, LLC | 105 | -30,92 | 2 | 0,00 | ||||
| 2025-11-07 | 13F | Shell Asset Management Co | 0 | -100,00 | 0 | |||||
| 2026-04-28 | 13F | SBI Securities Co., Ltd. | 54 | 671,43 | 1 | |||||
| 2026-02-09 | 13F | Hartland & Co., LLC | 2 | -99,56 | 0 | -100,00 | ||||
| 2026-02-10 | 13F | Quantbot Technologies LP | 425 | 9 | ||||||
| 2025-11-04 | 13F | Callan Family Office, LLC | 0 | -100,00 | 0 | |||||
| 2026-02-13 | 13F | Ubs Asset Management Americas Inc | 292 | 6 | ||||||
| 2026-02-13 | 13F | Brown Advisory Inc | 0 | -100,00 | 0 | |||||
| 2026-02-13 | 13F | Charles Schwab Investment Management Inc | 175.471 | -0,08 | 3.715 | 23,39 | ||||
| 2026-02-17 | 13F | Advisor Group Holdings, Inc. | 983 | 1,97 | 21 | 25,00 | ||||
| 2025-11-14 | 13F | Cubist Systematic Strategies, LLC | 23.534 | -56,88 | 403 | -57,35 | ||||
| 2026-02-17 | 13F | Royal Bank Of Canada | 68.555 | 8.633,12 | 1.451 | 10.264,29 | ||||
| 2026-02-09 | 13F | Quest Partners LLC | 17.953 | -5,59 | 380 | 16,92 | ||||
| 2026-04-29 | 13F | Klp Kapitalforvaltning As | 0 | -100,00 | 0 | |||||
| 2026-02-12 | 13F | Voya Investment Management Llc | 0 | -100,00 | 0 | |||||
| 2026-02-10 | 13F | Acadian Asset Management Llc | 158.577 | 23,35 | 3 | 50,00 | ||||
| 2026-02-12 | 13F | New York State Common Retirement Fund | 3.575 | -53,42 | 76 | -42,75 | ||||
| 2026-02-13 | 13F | Great West Life Assurance Co /can/ | 2.022 | 33,11 | 0 | |||||
| 2026-02-13 | 13F | Citigroup Inc | 19.417 | 19,56 | 411 | 47,84 | ||||
| 2026-04-24 | 13F | Root Financial Partners, LLC | 50 | 35,14 | 1 | |||||
| 2026-02-13 | 13F | Morgan Stanley | 173.128 | 14,09 | 3.665 | 40,96 | ||||
| 2026-04-07 | 13F | Farther Finance Advisors, LLC | 60 | 1,69 | 1 | 0,00 | ||||
| 2026-04-07 | 13F | First Financial Corp /in/ | 1.035 | 0,00 | 23 | 9,52 | ||||
| 2026-04-13 | 13F | True Wealth Design, LLC | 209 | 0,48 | 5 | 0,00 | ||||
| 2026-04-22 | 13F | Sterling Capital Management LLC | 673 | -43,35 | 15 | -40,00 | ||||
| 2026-02-17 | 13F | Hotchkis & Wiley Capital Management Llc | 371.784 | 9,95 | 7.871 | 35,81 | ||||
| 2026-04-13 | 13F | Bank & Trust Co | 1.314 | 0,00 | 29 | 7,41 | ||||
| 2026-02-12 | 13F | MetLife Investment Management, LLC | 11.925 | 0,00 | 252 | 23,53 | ||||
| 2026-04-02 | 13F | Ares Financial Consulting, LLC | 69 | 0,00 | 2 | 0,00 | ||||
| 2026-04-17 | 13F | CENTRAL TRUST Co | 1.882 | 0,00 | 42 | 5,13 | ||||
| 2026-02-12 | 13F | CIBC Private Wealth Group, LLC | 0 | -100,00 | 0 | |||||
| 2026-02-11 | 13F | Los Angeles Capital Management Llc | 86.502 | 9,10 | 1.386 | 1,99 | ||||
| 2026-02-17 | 13F | Susquehanna International Group, Llp | 0 | -100,00 | 0 | |||||
| 2026-02-06 | 13F | HighTower Advisors, LLC | 12.071 | 0,07 | 256 | 23,79 | ||||
| 2026-02-17 | 13F | Susquehanna Portfolio Strategies, LLC | 9.573 | 203 | ||||||
| 2026-04-10 | 13F | Brucke Financial, Inc. | 11.744 | 262 | ||||||
| 2026-02-04 | 13F | Valeo Financial Advisors, LLC | 18.951 | -0,65 | 401 | 23,01 | ||||
| 2026-02-12 | 13F | Jane Street Group, Llc | 101.433 | 66,15 | 2.147 | 105,26 | ||||
| 2025-11-14 | 13F | Raymond James Financial Inc | 0 | -100,00 | 0 | |||||
| 2026-02-05 | 13F | Thrivent Financial For Lutherans | 0 | -100,00 | 0 | |||||
| 2026-04-06 | 13F | Versant Capital Management, Inc | 1.855 | 0,00 | 41 | 5,13 | ||||
| 2026-02-13 | 13F | Rafferty Asset Management, LLC | 18.088 | -22,40 | 383 | -4,26 | ||||
| 2026-02-05 | 13F | Amalgamated Bank | 648 | -11,35 | 0 | |||||
| 2026-02-10 | 13F | Bank of New York Mellon Corp | 124.128 | -35,24 | 2.628 | -20,03 | ||||
| 2026-02-10 | 13F | Connor, Clark & Lunn Investment Management Ltd. | 57.512 | 0,41 | 1.218 | 24,06 | ||||
| 2026-02-13 | 13F | Pinnacle Wealth Planning Services, Inc. | 1.687 | 36 | ||||||
| 2026-02-17 | 13F | Two Sigma Investments, Lp | 147.180 | 5,45 | 3.116 | 30,23 | ||||
| 2026-02-17 | 13F | Creative Planning | 46.989 | -42,25 | 995 | -28,69 | ||||
| 2026-02-17 | 13F | Algert Global Llc | 130.921 | 73,06 | 3 | 100,00 | ||||
| 2026-01-29 | 13F | UMA Financial Services, Inc. | 0 | -100,00 | 0 | |||||
| 2026-02-06 | 13F | Gsa Capital Partners Llp | 17.997 | -23,14 | 0 | |||||
| 2026-02-19 | 13F | Invesco Ltd. | 39.722 | -1,76 | 841 | 21,21 | ||||
| 2026-04-28 | 13F | Busey Wealth Management | 759.286 | 0,00 | 16.940 | 5,38 | ||||
| 2025-11-14 | 13F | Point72 Asia (Singapore) Pte. Ltd. | 1.513 | 21,43 | 26 | 19,05 | ||||
| 2026-02-13 | 13F | MAI Capital Management | 6 | 0 | ||||||
| 2026-02-17 | 13F | Engineers Gate Manager LP | 0 | -100,00 | 0 | |||||
| 2026-02-13 | 13F | Rhumbline Advisers | 28.844 | -6,35 | 611 | 15,75 | ||||
| 2026-02-13 | 13F | Quarry LP | 0 | -100,00 | 0 | |||||
| 2026-02-11 | 13F | Empowered Funds, LLC | 67.472 | 10,68 | 1.428 | 36,78 | ||||
| 2026-02-17 | 13F | Point72 Asset Management, L.P. | 22.630 | 479 | ||||||
| 2026-02-17 | 13F | Price T Rowe Associates Inc /md/ | 12.334 | 12,84 | 0 | |||||
| 2026-02-13 | 13F | SRS Capital Advisors, Inc. | 326 | -98,99 | 7 | -98,92 | ||||
| 2026-02-17 | 13F | XTX Topco Ltd | 22.231 | 471 | ||||||
| 2026-01-26 | 13F | Cwm, Llc | 16.546 | -29,87 | 0 | |||||
| 2026-02-13 | 13F | Mariner, LLC | 32.437 | 15,36 | 687 | 42,62 | ||||
| 2026-02-12 | 13F | Commonwealth Equity Services, Llc | 41.792 | 2,43 | 885 | |||||
| 2026-02-17 | 13F | MIRAE ASSET GLOBAL ETFS HOLDINGS Ltd. | 9.567 | -0,65 | 203 | 22,42 | ||||
| 2026-04-30 | 13F | Hsbc Holdings Plc | 49.439 | 5,18 | 1.103 | 11,43 | ||||
| 2026-02-12 | 13F | Moneta Group Investment Advisors Llc | 12.239 | 0,00 | 259 | 23,92 | ||||
| 2026-02-17 | 13F | Schonfeld Strategic Advisors LLC | 10.267 | 217 | ||||||
| 2026-02-17 | 13F | Trexquant Investment LP | 104.638 | 51,49 | 2.215 | 87,24 | ||||
| 2026-02-09 | 13F | Geode Capital Management, Llc | 518.432 | -2,01 | 10.978 | 21,03 | ||||
| 2026-02-17 | 13F | Aqr Capital Management Llc | 407.803 | -39,64 | 8.633 | -25,44 | ||||
| 2026-02-10 | 13F | Bnp Paribas Arbitrage, Sa | 15.941 | -66,86 | 337 | -59,10 | ||||
| 2026-02-13 | 13F | Smartleaf Asset Management LLC | 42 | 0,00 | 1 | |||||
| 2026-04-13 | 13F | Massmutual Trust Co Fsb/adv | 9 | 0,00 | 0 | |||||
| 2026-02-13 | 13F | American Century Companies Inc | 598.637 | 1,58 | 12.673 | 25,48 | ||||
| 2026-02-09 | 13F | Legal & General Group Plc | 1.867 | 0,00 | 40 | 21,88 | ||||
| 2025-11-13 | 13F | Martingale Asset Management L P | 0 | -100,00 | 0 | |||||
| 2026-02-03 | 13F | Sequoia Financial Advisors, LLC | 0 | -100,00 | 0 | |||||
| 2026-02-10 | 13F | Goldman Sachs Group Inc | 174.098 | 10,33 | 3.686 | 36,28 | ||||
| 2026-02-10 | 13F | Rothschild Investment Llc | 55 | -26,67 | 1 | 0,00 | ||||
| 2026-04-20 | 13F | Ronald Blue Trust, Inc. | 1.400 | 0,00 | 31 | 6,90 | ||||
| 2026-04-23 | 13F | SJS Investment Consulting Inc. | 3 | 50,00 | 0 | |||||
| 2026-02-13 | 13F | Walleye Capital LLC | 18.725 | -44,81 | 396 | -31,84 | ||||
| 2026-02-17 | 13F | Occudo Quantitative Strategies Lp | 22.114 | 38,41 | 468 | 71,43 | ||||
| 2026-01-30 | 13F | Us Bancorp \de\ | 1.687 | 18,30 | 36 | 45,83 | ||||
| 2026-02-13 | 13F | Prudential Financial Inc | 71.461 | -55,87 | 1.513 | -45,51 | ||||
| 2026-02-17 | 13F | Bridgeway Capital Management Inc | 110.672 | 6,25 | 2.343 | 31,20 | ||||
| 2026-04-28 | 13F | Harbor Capital Advisors, Inc. | 338 | 5,30 | 0 | |||||
| 2026-02-17 | 13F | Aquatic Capital Management LLC | 301 | -98,19 | 6 | -97,89 | ||||
| 2026-02-17 | 13F | Jump Financial, LLC | 45.300 | 13,51 | 959 | 40,20 | ||||
| 2026-02-17 | 13F | Graham Capital Management, L.P. | 31.621 | -6,40 | 669 | 15,54 | ||||
| 2026-02-17 | 13F | D. E. Shaw & Co., Inc. | 116.193 | 171,38 | 2.460 | 235,47 | ||||
| 2026-02-11 | 13F | Deutsche Bank Ag\ | 14.563 | 145,91 | 308 | 204,95 | ||||
| 2025-11-14 | 13F | Brevan Howard Capital Management LP | 0 | -100,00 | 0 | |||||
| 2026-04-07 | 13F | Signaturefd, Llc | 568 | -2,07 | 13 | 0,00 | ||||
| 2026-01-29 | 13F | Vanguard Group Inc | 1.227.934 | 4,69 | 25.995 | 29,30 | ||||
| 2026-02-17 | 13F | Two Sigma Advisers, Lp | 104.400 | -3,78 | 2.210 | 18,88 | ||||
| 2026-02-06 | 13F | Lsv Asset Management | 296.089 | -9,48 | 6 | 20,00 | ||||
| 2026-04-10 | 13F | Daytona Street Capital LLC | 5.035 | 0,00 | 116 | 8,49 | ||||
| 2026-01-14 | 13F | Hennion & Walsh Asset Management, Inc. | 11.442 | -7,47 | 242 | 14,69 | ||||
| 2026-01-28 | 13F | Universal- Beteiligungs- und Servicegesellschaft mbH | 51.752 | 0,14 | 1.096 | 23,73 | ||||
| 2025-11-13 | 13F | Brandywine Global Investment Management, LLC | 0 | -100,00 | 0 | |||||
| 2026-02-13 | 13F | Fourthstone LLC | 0 | -100,00 | 0 | |||||
| 2026-02-13 | 13F | Marshall Wace, Llp | 0 | -100,00 | 0 | |||||
| 2026-02-17 | 13F | Quantinno Capital Management LP | 43.053 | 29,96 | 911 | 60,67 | ||||
| 2026-04-16 | 13F | SG Americas Securities, LLC | 9.185 | -26,75 | 0 | |||||
| 2026-02-17 | 13F | Mercer Global Advisors Inc /adv | 14.570 | 35,75 | 308 | 68,31 | ||||
| 2026-02-17 | 13F | Citadel Advisors Llc | 65.906 | 20,16 | 1.395 | 48,40 | ||||
| 2026-02-17 | 13F | Numerai GP LLC | 35.295 | -25,66 | 747 | -8,12 | ||||
| 2026-01-23 | 13F | Smith, Moore & Co. | 9.935 | 210 | ||||||
| 2026-04-29 | 13F | Police & Firemen's Retirement System of New Jersey | 6.053 | 0,00 | 135 | 5,47 | ||||
| 2026-02-17 | 13F | Ameriprise Financial Inc | 96.589 | 30,38 | 2.045 | 61,07 | ||||
| 2026-02-10 | 13F | Intech Investment Management Llc | 0 | -100,00 | 0 | |||||
| 2026-02-17 | 13F | Ancora Advisors, LLC | 4.619 | -69,03 | 98 | -61,96 | ||||
| 2026-02-17 | 13F | rhino investment partners, Inc | 261.534 | 5.537 | ||||||
| 2026-01-29 | 13F | Comerica Bank | 12 | 0 | ||||||
| 2026-02-11 | 13F | Jpmorgan Chase & Co | 115.046 | 40,76 | 2.436 | 73,93 | ||||
| 2025-11-14 | 13F | Skopos Labs, Inc. | 0 | -100,00 | 0 | |||||
| 2026-02-12 | 13F | Quadrant Capital Group Llc | 4.599 | 302,71 | 97 | 410,53 | ||||
| 2026-01-29 | 13F | UBS Group AG | 53.270 | 13,87 | 1.128 | 40,70 | ||||
| 2026-02-06 | 13F | Covestor Ltd | 419 | -14,14 | 0 | |||||
| 2026-02-13 | 13F | Dynamic Technology Lab Private Ltd | 0 | -100,00 | 0 | |||||
| 2026-01-26 | 13F | Midland Wealth Advisors Llc | 21.384 | 49,85 | 453 | 85,25 | ||||
| 2026-02-17 | 13F | Susquehanna Fundamental Investments, Llc | 20.171 | 427 | ||||||
| 2025-11-05 | 13F | Bessemer Group Inc | 0 | -100,00 | 0 | |||||
| 2025-11-14 | 13F | Hrt Financial Lp | 0 | -100,00 | 0 | |||||
| 2026-02-06 | 13F | Pnc Financial Services Group, Inc. | 539 | -14,85 | 11 | 10,00 | ||||
| 2026-02-13 | 13F | Sei Investments Co | 14.476 | 14,42 | 306 | 41,67 | ||||
| 2026-04-06 | 13F | GAMMA Investing LLC | 616 | 28,07 | 14 | 30,00 | ||||
| 2026-02-20 | 13F | Sunbelt Securities, Inc. | 18 | -33,33 | 0 | |||||
| 2026-02-13 | 13F | Squarepoint Ops LLC | 43.009 | 12,67 | 911 | 39,14 | ||||
| 2026-04-30 | 13F | Nuveen, LLC | 63.202 | -68,85 | 1.410 | -67,16 | ||||
| 2026-02-05 | 13F | Allworth Financial LP | 576 | 23,08 | 12 | 50,00 | ||||
| 2026-02-13 | 13F | Kilter Group LLC | 8 | 0 | ||||||
| 2026-02-17 | 13F | California State Teachers Retirement System | 1.270 | -16,94 | 27 | 0,00 | ||||
| 2026-02-17 | 13F | Russell Investments Group, Ltd. | 45.971 | 39,59 | 973 | 72,52 | ||||
| 2026-02-17 | 13F | State Of Wisconsin Investment Board | 26.000 | 78,08 | 550 | 120,00 | ||||
| 2026-02-13 | 13F | Barclays Plc | 69.453 | 14,01 | 1.470 | 40,80 | ||||
| 2026-02-17 | 13F | Fmr Llc | 29.301 | 20,66 | 620 | 49,04 | ||||
| 2026-04-30 | 13F | Nisa Investment Advisors, Llc | 3.078 | -76,99 | 69 | -75,97 | ||||
| 2026-04-08 | 13F | Wealth Enhancement Advisory Services, Llc | 13.503 | 8,71 | 311 | 16,54 | ||||
| 2026-02-17 | 13F | Alliancebernstein L.p. | 37.670 | 12,55 | 797 | 39,09 | ||||
| 2026-02-12 | 13F | Federated Hermes, Inc. | 51.799 | 57,97 | 1.097 | 95,02 | ||||
| 2025-11-14 | 13F | Lazard Asset Management Llc | 0 | -100,00 | 0 | |||||
| 2026-02-13 | 13F | Wells Fargo & Company/mn | 30.382 | 59,17 | 643 | 96,64 | ||||
| 2026-02-13 | 13F | Ieq Capital, Llc | 47.618 | -34,56 | 1.008 | -19,17 | ||||
| 2026-02-17 | 13F | Bank Of America Corp /de/ | 168.735 | -20,33 | 3.572 | -1,60 | ||||
| 2026-02-11 | 13F | Ameritas Investment Partners, Inc. | 1.674 | 35 | ||||||
| 2026-02-13 | 13F | State Street Corp | 682.862 | 10,14 | 14.456 | 36,04 | ||||
| 2026-02-13 | 13F | Arrowstreet Capital, Limited Partnership | 181.888 | 30,95 | 3.851 | 61,76 | ||||
| 2026-02-17 | 13F | Millennium Management Llc | 220.912 | -30,12 | 4.677 | -13,70 | ||||
| 2026-02-17 | 13F | Northern Trust Corp | 148.900 | -8,71 | 3.152 | 12,77 | ||||
| 2026-02-13 | 13F | Jacobs Levy Equity Management, Inc | 238.364 | 97,09 | 5.046 | 143,53 | ||||
| 2026-02-17 | 13F | Tower Research Capital LLC (TRC) | 1.949 | 127,95 | 41 | 192,86 | ||||
| 2026-04-30 | 13F | Torren Management, LLC | 1 | -98,11 | 0 | -100,00 | ||||
| 2026-02-03 | 13F | International Assets Investment Management, Llc | 17 | 0 | ||||||
| 2026-02-17 | 13F | Optiver Holding B.V. | 180 | 0,00 | 4 | 0,00 | ||||
| 2026-02-17 | 13F | Qube Research & Technologies Ltd | 0 | -100,00 | 0 | |||||
| 2025-11-12 | 13F | LPL Financial LLC | 0 | -100,00 | 0 | |||||
| 2026-02-06 | 13F | EverSource Wealth Advisors, LLC | 1.389 | -21,75 | 29 | -3,33 | ||||
| 2026-02-11 | 13F | Cerity Partners LLC | 0 | -100,00 | 0 | |||||
| 2026-02-13 | 13F | First Trust Advisors Lp | 0 | -100,00 | 0 | |||||
| 2026-02-17 | 13F | Public Employees Retirement System Of Ohio | 21.034 | 45,48 | 445 | 80,16 | ||||
| 2025-11-14 | 13F | Corton Capital Inc. | 14.685 | 7,26 | 252 | 5,91 | ||||
| 2026-02-17 | 13F | ExodusPoint Capital Management, LP | 0 | -100,00 | 0 | -100,00 | ||||
| 2026-02-12 | 13F | Dimensional Fund Advisors Lp | 1.050.822 | -11,94 | 22.246 | 8,77 | ||||
| 2026-02-12 | 13F | BlackRock, Inc. | 2.939.966 | -2,14 | 62.239 | 20,88 |
Other Listings
| US:MSBI | 26,01 $ |