Grundlæggende statistik
| Institutionelle aktier (lange) | 107.539.610 - 107,16% (ex 13D/G) - change of -8,71MM shares -7,49% MRQ |
| Institutionel værdi (lang) | $ 847.555 USD ($1000) |
Institutionelt ejerskab og aktionærer
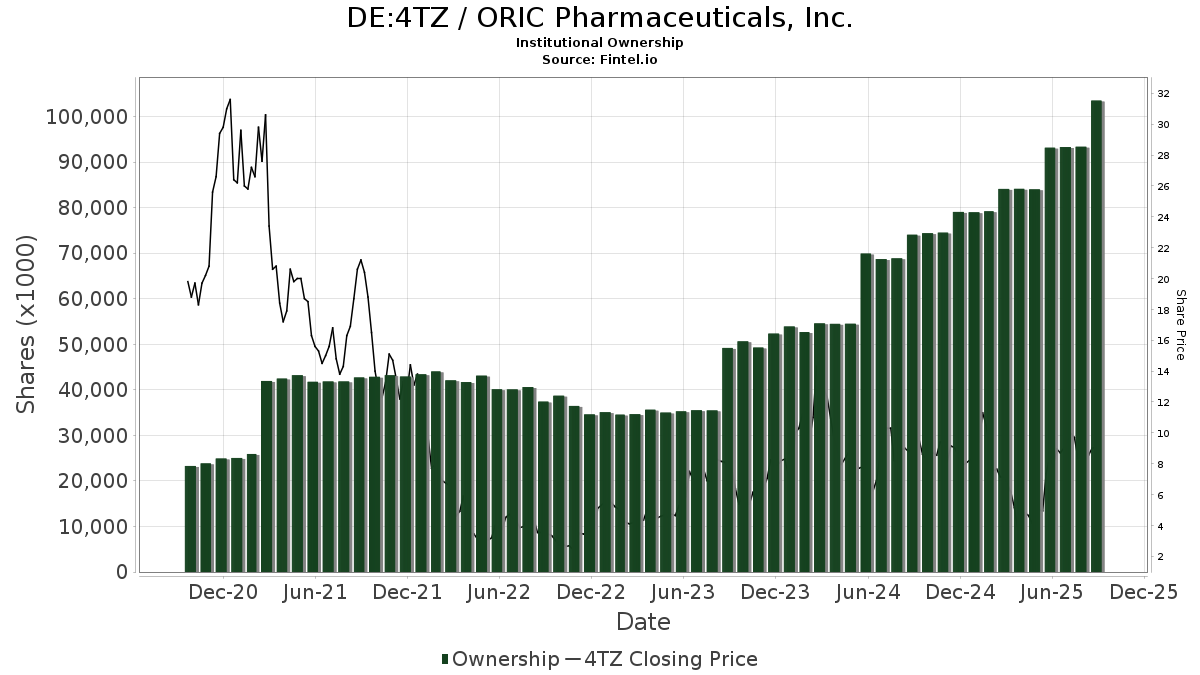
ORIC Pharmaceuticals, Inc. (DE:4TZ) har 163 institutionelle ejere og aktionærer, der har indsendt 13D/G- eller 13F-formularer til Securities Exchange Commission (SEC). Disse institutioner har i alt 107,539,610 aktier. Største aktionærer omfatter EcoR1 Capital, LLC, Viking Global Investors Lp, BlackRock, Inc., VR Adviser, LLC, Pfizer Inc, Vanguard Group Inc, Sr One Capital Management, Lp, Alkeon Capital Management Llc, State Street Corp, and NEA Management Company, LLC .
ORIC Pharmaceuticals, Inc. (DB:4TZ) institutionel ejerskabsstruktur viser aktuelle positioner i virksomheden efter institutioner og fonde, samt seneste ændringer i positionsstørrelse. Større aktionærer kan omfatte individuelle investorer, investeringsforeninger, hedgefonde eller institutioner. Skema 13D angiver, at investoren besidder (eller besidder) mere end 5 % af virksomheden og har til hensigt (eller har til hensigt at) aktivt at forfølge en ændring i forretningsstrategi. Skema 13G indikerer en passiv investering på over 5%.
The share price as of April 14, 2026 is 8,73 / share. Previously, on April 15, 2025, the share price was 4,60 / share. This represents an increase of 89,74% over that period.
Fondens stemningsscore
Fund Sentiment Score (fka Ownership Accumulation Score) finder de aktier, der bliver mest købt af fonde. Det er resultatet af en sofistikeret, multi-faktor kvantitativ model, der identificerer virksomheder med de højeste niveauer af institutionel akkumulering. Scoringsmodellen bruger en kombination af den samlede stigning i oplyste ejere, ændringerne i porteføljeallokeringer i disse ejere og andre målinger. Tallet går fra 0 til 100, hvor højere tal indikerer et højere niveau af akkumulering for sine jævnaldrende, og 50 er gennemsnittet.
Opdateringsfrekvens: Dagligt
Se Ownership Explorer, som giver en liste over højest rangerende virksomheder.
AI+ Ask Fintel’s AI assistant about ORIC Pharmaceuticals, Inc..
Select a question to share a public post with an AI-crafted answer.
Thinking of good questions…
13F og NPORT arkivering
Detaljer om 13F-arkivering er gratis. Detaljer om NP-ansøgninger kræver et premium-medlemskab. Grønne rækker angiver nye positioner. Røde rækker angiver lukkede positioner. Klik på linket ikon for at se den fulde transaktionshistorik.
Opgrader
for at låse premium-data op og eksportere til Excel ![]() .
.
| Fil dato | Kilde | Investor | Type | Gennemsnitlig pris (Øst) |
Aktier | Δ Aktier (%) |
Rapporteret Værdi ($1000) |
Δ Værdi (%) |
Port Alloc (%) |
|
|---|---|---|---|---|---|---|---|---|---|---|
| 2025-11-14 | 13F | Quantessence Capital LLC | 0 | -100,00 | 0 | -100,00 | ||||
| 2026-02-12 | 13F | Jane Street Group, Llc | Call | 0 | -100,00 | 0 | -100,00 | |||
| 2026-02-12 | 13F | New York State Common Retirement Fund | 18.429 | -59,12 | 151 | -72,22 | ||||
| 2025-11-14 | 13F | Point72 (DIFC) Ltd | 0 | -100,00 | 0 | |||||
| 2026-02-17 | 13F | Redmile Group, LLC | 448.110 | 3.666 | ||||||
| 2026-02-17 | 13F | Resolute Capital Asset Partners LLC | 0 | -100,00 | 0 | |||||
| 2026-02-17 | 13F | MPM Oncology Impact Management LP | 1.798.717 | 4,01 | 14.714 | -29,10 | ||||
| 2026-02-17 | 13F | Ishara Investments LP | 160.000 | 1.309 | ||||||
| 2026-04-13 | 13F | E Fund Management Co., Ltd. | 14.517 | 417,91 | 184 | 165,22 | ||||
| 2026-02-10 | 13F | Td Asset Management Inc | 169.830 | 11,95 | 1.389 | -23,68 | ||||
| 2026-02-17 | 13F | Graham Capital Management, L.P. | 81.576 | 667 | ||||||
| 2026-02-17 | 13F | VARCOV Co. | 32.036 | 262 | ||||||
| 2026-02-19 | 13F | Invesco Ltd. | 109.742 | 19,79 | 898 | -18,38 | ||||
| 2026-02-17 | 13F | Superstring Capital Management Lp | 255.370 | 185,82 | 2.089 | 94,78 | ||||
| 2026-02-13 | 13F | Ubs Asset Management Americas Inc | 50.782 | 118,56 | 415 | 49,28 | ||||
| 2025-11-10 | 13F | Monaco Asset Management SAM | 0 | -100,00 | 0 | -100,00 | ||||
| 2026-02-13 | 13F | Sterling Capital Management LLC | 2.838 | -2,44 | 23 | -32,35 | ||||
| 2026-02-10 | 13F | Bnp Paribas Arbitrage, Sa | 40.115 | -83,19 | 328 | -88,54 | ||||
| 2026-02-17 | 13F | NEA Management Company, LLC | 4.118.621 | 0,00 | 33.690 | -31,83 | ||||
| 2026-02-17 | 13F | Euclidean Capital LLC | 989.410 | 0,00 | 8.093 | -31,83 | ||||
| 2026-02-13 | 13F | BNP Paribas Asset Management Holding S.A. | 647 | 18,07 | 0 | |||||
| 2026-02-13 | 13F | Barclays Plc | 718.535 | 290,32 | 5.878 | 166,05 | ||||
| 2026-02-13 | 13F | Morgan Stanley | 1.194.073 | 60,16 | 9.768 | 9,18 | ||||
| 2026-02-13 | 13F | Eventide Asset Management, Llc | 952.371 | 0,09 | 7.790 | -31,77 | ||||
| 2026-02-17 | 13F | Price T Rowe Associates Inc /md/ | 3.295.122 | 14,76 | 27 | -23,53 | ||||
| 2026-01-29 | 13F | Vanguard Group Inc | 4.541.974 | -2,33 | 37.153 | -33,42 | ||||
| 2026-02-09 | 13F | Quest Partners LLC | 44.387 | 186,37 | 363 | 95,16 | ||||
| 2026-02-17 | 13F | MIRAE ASSET GLOBAL ETFS HOLDINGS Ltd. | 41.057 | 30,88 | 335 | -10,70 | ||||
| 2026-02-17 | 13F | Optiver Holding B.V. | 252 | -58,96 | 2 | -71,43 | ||||
| 2026-02-03 | 13F | SBI Securities Co., Ltd. | 2 | -33,33 | 0 | |||||
| 2026-02-13 | 13F | Victory Capital Management Inc | 332.760 | 151,67 | 2.722 | 71,56 | ||||
| 2026-02-17 | 13F | Engineers Gate Manager LP | 10.335 | 85 | ||||||
| 2026-02-09 | 13F | Legal & General Group Plc | 33.839 | 2,15 | 277 | -30,48 | ||||
| 2026-02-17 | 13F | XTX Topco Ltd | 110.565 | 904 | ||||||
| 2025-11-12 | 13F | Group One Trading, L.p. | 0 | -100,00 | 0 | -100,00 | ||||
| 2026-02-13 | 13F | Great West Life Assurance Co /can/ | 5.593 | 0,00 | 0 | |||||
| 2026-02-13 | 13F | NEXTBio Capital Management LP | 615.720 | 5.037 | ||||||
| 2026-02-17 | 13F | Fmr Llc | 2.478.922 | -1,94 | 20.278 | -33,16 | ||||
| 2026-02-17 | 13F | Advisor Group Holdings, Inc. | 683 | 3.494,74 | 6 | |||||
| 2026-01-16 | 13F | Tema Etfs Llc | 27.854 | 228 | ||||||
| 2026-02-13 | 13F | State Street Corp | 4.258.397 | 77,14 | 34.834 | 20,75 | ||||
| 2026-02-12 | 13F | JPL Wealth Management, LLC | 0 | -100,00 | 0 | |||||
| 2026-02-09 | 13F | Sectoral Asset Management Inc | 22.480 | -93,16 | 184 | -95,36 | ||||
| 2026-02-17 | 13F | Susquehanna Fundamental Investments, Llc | 25.518 | 0,00 | 209 | -32,03 | ||||
| 2026-02-06 | 13F | ProShare Advisors LLC | 16.392 | 22,48 | 134 | -16,25 | ||||
| 2026-02-13 | 13F | Squarepoint Ops LLC | 229.383 | 646,37 | 1.876 | 409,78 | ||||
| 2026-02-11 | 13F | Fox Run Management, L.l.c. | 0 | -100,00 | 0 | |||||
| 2026-02-12 | 13F | Voya Investment Management Llc | 10.934 | 89 | ||||||
| 2026-02-17 | 13F | Adage Capital Partners Gp, L.l.c. | 549.000 | 22,72 | 4.491 | -16,36 | ||||
| 2026-02-17 | 13F | DAFNA Capital Management LLC | 141.045 | 34,75 | 1.154 | -8,20 | ||||
| 2025-11-14 | 13F | Ubs Oconnor Llc | 0 | -100,00 | 0 | -100,00 | ||||
| 2026-01-30 | 13F | Us Bancorp \de\ | 0 | -100,00 | 0 | |||||
| 2026-02-17 | 13F | Boothbay Fund Management, Llc | 218.610 | 97,24 | 1.788 | 34,54 | ||||
| 2026-02-11 | 13F | Jpmorgan Chase & Co | 414.786 | -66,24 | 3.393 | -76,99 | ||||
| 2026-02-13 | 13F | Alkeon Capital Management Llc | 4.504.096 | 0,00 | 36.844 | -31,83 | ||||
| 2026-02-13 | 13F | Entropy Technologies, LP | 22.799 | 186 | ||||||
| 2026-02-06 | 13F | Larson Financial Group LLC | 0 | -100,00 | 0 | |||||
| 2026-02-12 | 13F | State Board Of Administration Of Florida Retirement System | 11.310 | 0,00 | 93 | -31,85 | ||||
| 2026-02-17 | 13F | Balyasny Asset Management Llc | 950.214 | -37,46 | 7.773 | -57,37 | ||||
| 2026-02-13 | 13F | Quarry LP | 16.000 | 2.106,90 | 131 | 1.525,00 | ||||
| 2026-02-17 | 13F | Oxford Asset Management Llp | 19.638 | 161 | ||||||
| 2026-02-17 | 13F | CWM Advisors, LLC | 753 | 6 | ||||||
| 2026-04-06 | 13F | Versant Capital Management, Inc | 773 | 7,36 | 10 | 80,00 | ||||
| 2026-02-06 | 13F | Nano Cap New Millennium Growth Fund L P | 15.000 | 123 | ||||||
| 2026-02-17 | 13F | Integral Health Asset Management, LLC | 0 | -100,00 | 0 | -100,00 | ||||
| 2026-01-15 | 13F | Nisa Investment Advisors, Llc | 2.410 | -1,07 | 20 | -34,48 | ||||
| 2026-02-17 | 13F | Orbimed Advisors Llc | 3.641.756 | 0,00 | 29.790 | -31,83 | ||||
| 2026-02-11 | 13F | Ameritas Investment Partners, Inc. | 4.581 | 37 | ||||||
| 2026-02-10 | 13F | Intech Investment Management Llc | 26.606 | 53,06 | 218 | 4,33 | ||||
| 2026-02-17 | 13F | Freestone Grove Partners LP | 24.207 | 198 | ||||||
| 2026-02-06 | 13F | Gsa Capital Partners Llp | 70.634 | 121,23 | 1 | |||||
| 2026-02-17 | 13F | Bellevue Group AG | 9.706 | 79 | ||||||
| 2026-02-17 | 13F | Northern Trust Corp | 885.475 | -0,34 | 7.243 | -32,07 | ||||
| 2026-02-10 | 13F | Rothschild Investment Llc | 45 | 0,00 | 0 | |||||
| 2026-02-06 | 13F | EverSource Wealth Advisors, LLC | 292 | -1,02 | 2 | -33,33 | ||||
| 2026-02-17 | 13F | Polar Capital Holdings Plc | 502.364 | 7,20 | 4.109 | -26,93 | ||||
| 2026-02-13 | 13F | Stifel Financial Corp | 13.490 | 110 | ||||||
| 2026-02-17 | 13F | Nextech Invest, Ltd. | 0 | -100,00 | 0 | |||||
| 2026-02-13 | 13F | Y-Intercept (Hong Kong) Ltd | 341.423 | 2.793 | ||||||
| 2025-11-14 | 13F | Point72 Europe (London) LLP | 113 | 1 | ||||||
| 2026-02-20 | 13F/A | Blue Owl Capital Holdings LP | 515.000 | 4.213 | ||||||
| 2026-02-13 | 13F | Wells Fargo & Company/mn | 82.532 | 61,94 | 675 | 10,47 | ||||
| 2026-02-17 | 13F | Caption Management, LLC | 0 | -100,00 | 0 | |||||
| 2026-02-13 | 13F | Exome Asset Management LLC | 0 | -100,00 | 0 | |||||
| 2026-02-17 | 13F | Scientech Research LLC | 11.533 | 94 | ||||||
| 2026-02-17 | 13F | Woodline Partners LP | 246.534 | 0,00 | 2.017 | -31,85 | ||||
| 2026-02-17 | 13F | Royal Bank Of Canada | 2.344 | -97,57 | 18 | -98,45 | ||||
| 2026-02-17 | 13F | Jain Global LLC | 0 | -100,00 | 0 | |||||
| 2025-11-14 | 13F | Two Sigma Securities, Llc | 0 | -100,00 | 0 | -100,00 | ||||
| 2026-02-17 | 13F | Brevan Howard Capital Management LP | 89.532 | 82,36 | 732 | 24,28 | ||||
| 2026-02-17 | 13F | Atom Investors LP | 289.962 | 103,34 | 2.372 | 38,57 | ||||
| 2026-01-06 | 13F | Sanctuary Advisors, LLC | 0 | -100,00 | 0 | -100,00 | ||||
| 2026-02-17 | 13F | Qube Research & Technologies Ltd | 1.205.429 | 9.860 | ||||||
| 2026-02-13 | 13F/A | Virtus ETF Advisers LLC | 0 | -100,00 | 0 | |||||
| 2026-02-10 | 13F | Axq Capital, Lp | 10.366 | 85 | ||||||
| 2026-02-17 | 13F | Algert Global Llc | 40.510 | 0 | ||||||
| 2026-02-11 | 13F | Franklin Resources Inc | 1.212.547 | 2,64 | 9.919 | -30,03 | ||||
| 2026-02-17 | 13F | Janus Henderson Group Plc | 14.400 | 0,00 | 118 | -31,98 | ||||
| 2026-02-10 | 13F | Clear Harbor Asset Management, LLC | 0 | -100,00 | 0 | |||||
| 2026-01-29 | 13F | UBS Group AG | 734.858 | 116,62 | 6.011 | 47,69 | ||||
| 2026-04-15 | 13F | Gf Fund Management Co. Ltd. | 2.176 | 13,75 | 28 | 80,00 | ||||
| 2026-02-06 | 13F | Legato Capital Management LLC | 0 | -100,00 | 0 | |||||
| 2026-01-28 | 13F | Arizona State Retirement System | 12.163 | 20,95 | 99 | -17,50 | ||||
| 2026-02-17 | 13F | Paradigm Biocapital Advisors LP | 2.401.217 | 19.642 | ||||||
| 2026-02-13 | 13F | Rhumbline Advisers | 77.706 | -5,27 | 636 | -35,47 | ||||
| 2026-01-09 | 13F | SG Americas Securities, LLC | 41.016 | 127,58 | 0 | |||||
| 2026-02-17 | 13F | Dark Forest Capital Management Lp | 0 | -100,00 | 0 | |||||
| 2026-02-17 | 13F | Logos Global Management LP | 450.000 | 3.681 | ||||||
| 2026-04-06 | 13F | GAMMA Investing LLC | 552 | 9,74 | 7 | 50,00 | ||||
| 2026-02-05 | 13F | Amalgamated Bank | 2.078 | -2,44 | 0 | |||||
| 2026-02-17 | 13F | Aqr Capital Management Llc | 174.279 | 1,37 | 1.426 | -30,93 | ||||
| 2026-02-13 | 13F | Lord, Abbett & Co. Llc | 564.253 | 5 | ||||||
| 2026-02-17 | 13F | VR Adviser, LLC | 5.676.230 | -13,96 | 46.432 | -41,35 | ||||
| 2026-01-26 | 13F | Mirae Asset Global Investments Co., Ltd. | 4.732 | 26,02 | 39 | -15,56 | ||||
| 2025-11-14 | 13F | Raymond James Financial Inc | 0 | -100,00 | 0 | |||||
| 2026-02-13 | 13F | Kalehua Capital Management LLC | 267.059 | 2.185 | ||||||
| 2026-02-11 | 13F | Parallel Advisors, LLC | 83 | 0,00 | 1 | |||||
| 2026-02-13 | 13F | Nicholas Investment Partners, LP | 0 | -100,00 | 0 | |||||
| 2026-02-17 | 13F | Point72 Asset Management, L.P. | 2.923.077 | 11,57 | 23.911 | -23,95 | ||||
| 2025-11-14 | 13F | Fred Alger Management, Llc | 0 | -100,00 | 0 | |||||
| 2026-02-12 | 13F | Sr One Capital Management, Lp | 4.514.929 | 0,00 | 37.754 | -30,32 | ||||
| 2025-11-14 | 13F | Frazier Life Sciences Management, L.P. | 0 | -100,00 | 0 | |||||
| 2026-02-12 | 13F | Silverarc Capital Management, Llc | 1.116.604 | -42,70 | 9.134 | -60,95 | ||||
| 2026-02-17 | 13F | State Of Wisconsin Investment Board | 124.345 | 38,54 | 1.017 | -5,57 | ||||
| 2026-02-17 | 13F | Susquehanna International Group, Llp | Put | 0 | -100,00 | 0 | -100,00 | |||
| 2026-02-13 | 13F | First Turn Management, LLC | 2.010.307 | -6,91 | 16.444 | -36,54 | ||||
| 2026-02-17 | 13F | Susquehanna International Group, Llp | 0 | -100,00 | 0 | -100,00 | ||||
| 2026-01-26 | 13F | Cwm, Llc | 12.037 | -2,08 | 0 | |||||
| 2026-02-17 | 13F | D. E. Shaw & Co., Inc. | 16.022 | 131 | ||||||
| 2026-02-17 | 13F | Millennium Management Llc | 97.432 | -30,62 | 797 | -52,76 | ||||
| 2025-11-14 | 13F | Tudor Investment Corp Et Al | 0 | -100,00 | 0 | |||||
| 2025-11-14 | 13F | Point72 Asia (Singapore) Pte. Ltd. | 0 | -100,00 | 0 | -100,00 | ||||
| 2026-01-23 | 13F | Assetmark, Inc | 3.000 | -2,88 | 25 | -35,14 | ||||
| 2026-02-09 | 13F | Royce & Associates Lp | 1.507.301 | 3,35 | 12.330 | -29,55 | ||||
| 2026-02-12 | 13F | DRW Securities, LLC | 19.194 | 157 | ||||||
| 2026-02-12 | 13F | BlackRock, Inc. | 5.875.053 | 11,34 | 48.058 | -24,10 | ||||
| 2026-02-12 | 13F | Jasper Ridge Partners, L.P. | 20.870 | 0,00 | 171 | -32,00 | ||||
| 2026-02-10 | 13F | Daiwa Securities Group Inc. | 249 | 0,00 | 0 | |||||
| 2026-02-12 | 13F | MetLife Investment Management, LLC | 33.970 | 0,00 | 278 | -31,94 | ||||
| 2025-11-10 | 13F | Hartland & Co., LLC | 0 | -100,00 | 0 | |||||
| 2025-11-14 | 13F | Ally Bridge Group (NY) LLC | 0 | -100,00 | 0 | |||||
| 2025-11-14 | 13F | Ieq Capital, Llc | 0 | -100,00 | 0 | |||||
| 2026-02-12 | 13F | Pfizer Inc | 5.376.344 | 0,00 | 43.978 | -31,83 | ||||
| 2026-01-28 | 13F | Klp Kapitalforvaltning As | 9.300 | 30,99 | 76 | -10,59 | ||||
| 2026-02-05 | 13F | ANTIPODES PARTNERS Ltd | 2.399 | -17,30 | 20 | -44,12 | ||||
| 2026-02-13 | 13F | SRS Capital Advisors, Inc. | 286 | -92,68 | 2 | -95,65 | ||||
| 2026-02-06 | 13F | Pnc Financial Services Group, Inc. | 9.056 | -1,22 | 74 | -32,73 | ||||
| 2026-02-17 | 13F | Citadel Advisors Llc | Call | 14.900 | -32,58 | 122 | -54,34 | |||
| 2026-02-12 | 13F | Jane Street Group, Llc | 244.033 | 289,34 | 1.996 | 165,43 | ||||
| 2026-02-17 | 13F | Citadel Advisors Llc | 2.434.710 | 103,23 | 19.916 | 38,53 | ||||
| 2026-02-17 | 13F/A | Boxer Capital Management, LLC | 0 | -100,00 | 0 | |||||
| 2026-02-17 | 13F | Creative Planning | 14.774 | -16,50 | 121 | -43,40 | ||||
| 2026-02-17 | 13F | Prelude Capital Management, Llc | 0 | -100,00 | 0 | |||||
| 2026-01-14 | 13F | Hennion & Walsh Asset Management, Inc. | 170.072 | 15,66 | 1.391 | -21,15 | ||||
| 2025-11-14 | 13F | Skopos Labs, Inc. | 0 | -100,00 | 0 | |||||
| 2026-02-12 | 13F | Federation des caisses Desjardins du Quebec | 4.000 | 100,00 | 33 | 33,33 | ||||
| 2026-03-03 | 13F/A | Caitong International Asset Management Co., Ltd | 84 | -94,72 | 1 | -100,00 | ||||
| 2026-02-11 | 13F | Simplex Trading, Llc | 496 | 4 | ||||||
| 2026-02-11 | 13F | Simplex Trading, Llc | Call | 400 | -81,82 | 3 | ||||
| 2026-02-17 | 13F | Sphera Funds Management Ltd. | 1.004.378 | 132,66 | 8.216 | 58,59 | ||||
| 2026-02-06 | 13F | Profund Advisors Llc | 65.160 | 248,08 | 533 | 137,95 | ||||
| 2026-02-17 | 13F | Susquehanna Portfolio Strategies, LLC | 0 | -100,00 | 0 | |||||
| 2026-02-13 | 13F | American Century Companies Inc | 134.930 | 3,33 | 1.104 | -29,57 | ||||
| 2026-04-07 | 13F | Signaturefd, Llc | 83 | 0,00 | 1 | |||||
| 2026-02-17 | 13F | Driehaus Capital Management Llc | 0 | -100,00 | 0 | -100,00 | ||||
| 2025-11-14 | 13F | Ameriprise Financial Inc | 0 | -100,00 | 0 | |||||
| 2026-02-17 | 13F | Virtus Investment Advisers, Inc. | 28.361 | 141,02 | 232 | 63,83 | ||||
| 2026-02-13 | 13F | Citigroup Inc | 154.149 | 1.349,59 | 1.261 | 892,13 | ||||
| 2026-02-17 | 13F | Viking Global Investors Lp | 6.572.691 | -0,00 | 53.765 | -31,83 | ||||
| 2026-02-12 | 13F | Renaissance Technologies Llc | 572.724 | 3.849,82 | 4.685 | 2.591,95 | ||||
| 2026-02-13 | 13F | Siren, L.L.C. | 1.007.575 | 0,00 | 8.242 | -31,84 | ||||
| 2026-02-13 | 13F | Police & Firemen's Retirement System of New Jersey | 15.643 | 0,00 | 128 | -32,09 | ||||
| 2026-02-17 | 13F | Schonfeld Strategic Advisors LLC | 14.349 | 117 | ||||||
| 2026-02-12 | 13F | Campbell & CO Investment Adviser LLC | 0 | -100,00 | 0 | |||||
| 2026-02-13 | 13F | Column Group LLC | 0 | -100,00 | 0 | |||||
| 2026-02-17 | 13F | Russell Investments Group, Ltd. | 207.037 | 4.062,38 | 1.694 | 2.769,49 | ||||
| 2026-02-11 | 13F | Deutsche Bank Ag\ | 44.937 | 5,74 | 368 | -27,90 | ||||
| 2026-02-17 | 13F | Wellington Management Group Llp | 191.823 | 27,38 | 1.569 | -13,17 | ||||
| 2026-04-07 | 13F | Farther Finance Advisors, LLC | 50 | 150,00 | 0 | |||||
| 2026-02-17 | 13F | NEOS Investment Management LLC | 28.269 | 231 | ||||||
| 2026-02-17 | 13F | Tower Research Capital LLC (TRC) | 443 | -86,81 | 4 | -92,50 | ||||
| 2026-02-09 | 13F | Optimize Financial Inc | 39.612 | 1,45 | 324 | -30,77 | ||||
| 2026-02-10 | 13F | Goldman Sachs Group Inc | 1.939.285 | 114,33 | 15.863 | 46,11 | ||||
| 2026-01-21 | 13F | Palumbo Wealth Management LLC | 27.322 | -37,94 | 223 | -57,77 | ||||
| 2026-02-10 | 13F | Connor, Clark & Lunn Investment Management Ltd. | 350.884 | 2.034,72 | 2.870 | 1.356,85 | ||||
| 2025-11-14 | 13F | Hrt Financial Lp | 0 | -100,00 | 0 | |||||
| 2026-02-17 | 13F | ArrowMark Colorado Holdings LLC | 1.063.769 | -3,07 | 8.702 | -33,93 | ||||
| 2026-02-17 | 13F | EcoR1 Capital, LLC | 6.728.116 | 0,00 | 55.036 | -31,83 | ||||
| 2026-02-17 | 13F | Susquehanna International Group, Llp | Call | 31.500 | 258 | |||||
| 2026-02-13 | 13F | Charles Schwab Investment Management Inc | 621.086 | 2,96 | 5.080 | -29,81 | ||||
| 2026-02-17 | 13F | Quantinno Capital Management LP | 23.356 | 90,46 | 191 | 29,93 | ||||
| 2026-02-13 | 13F | Manufacturers Life Insurance Company, The | 0 | -100,00 | 0 | |||||
| 2026-02-10 | 13F | Bank of New York Mellon Corp | 187.921 | 6,95 | 1.537 | -27,09 | ||||
| 2025-11-17 | 13F | Jacobs Levy Equity Management, Inc | 0 | -100,00 | 0 | |||||
| 2026-02-19 | 13F | CI Private Wealth, LLC | 12.512 | 102 | ||||||
| 2026-02-17 | 13F | California State Teachers Retirement System | 33.959 | 3,89 | 278 | -29,34 | ||||
| 2025-11-14 | 13F | Caption Management, LLC | Call | 0 | -100,00 | 0 | -100,00 | |||
| 2026-02-05 | 13F | Allworth Financial LP | 0 | -100,00 | 0 | |||||
| 2026-02-11 | 13F | Group One Trading, L.p. | Put | 0 | -100,00 | 0 | -100,00 | |||
| 2026-04-13 | 13F | IFP Advisors, Inc | 297 | 0,00 | 4 | 50,00 | ||||
| 2026-01-27 | 13F | Zurcher Kantonalbank (Zurich Cantonalbank) | 16.546 | 135 | ||||||
| 2026-02-12 | 13F | Nuveen, LLC | 144.403 | 4,87 | 1.181 | -28,51 | ||||
| 2026-02-17 | 13F | Bank Of America Corp /de/ | 507.510 | 390,58 | 4.151 | 234,49 | ||||
| 2025-11-07 | 13F | Shell Asset Management Co | 0 | -100,00 | 0 | |||||
| 2026-02-12 | 13F | Swiss National Bank | 86.200 | 30,41 | 705 | -11,10 | ||||
| 2026-02-17 | 13F | Caption Management, LLC | Put | 0 | -100,00 | 0 | ||||
| 2026-02-17 | 13F | StemPoint Capital LP | 0 | -100,00 | 0 | |||||
| 2026-01-29 | 13F | China Universal Asset Management Co., Ltd. | 15.870 | -41,27 | 130 | -60,19 | ||||
| 2026-02-13 | 13F | Vivo Capital, LLC | 2.118.384 | -32,25 | 17.328 | -53,82 | ||||
| 2026-04-08 | 13F | Wealth Enhancement Advisory Services, Llc | 11.747 | 104 | ||||||
| 2026-02-13 | 13F | Rafferty Asset Management, LLC | 177.179 | 107,00 | 1.449 | 41,09 | ||||
| 2026-02-17 | 13F | Alliancebernstein L.p. | 63.810 | 0,00 | 522 | -31,90 | ||||
| 2026-02-09 | 13F | Geode Capital Management, Llc | 1.750.694 | 7,36 | 14.323 | -26,82 | ||||
| 2026-02-12 | 13F | Dimensional Fund Advisors Lp | 1.227.230 | 54,59 | 10.038 | 5,40 | ||||
| 2026-02-17 | 13F | LMR Partners LLP | 35.267 | 0,00 | 288 | -31,91 |
Other Listings
| US:ORIC | 10,53 $ |