Grundlæggende statistik
| Institutionelle aktier (lange) | 104.333.337 - 77,80% (ex 13D/G) - change of 7,66MM shares 7,92% MRQ |
| Institutionel værdi (lang) | $ 849.143 USD ($1000) |
Institutionelt ejerskab og aktionærer
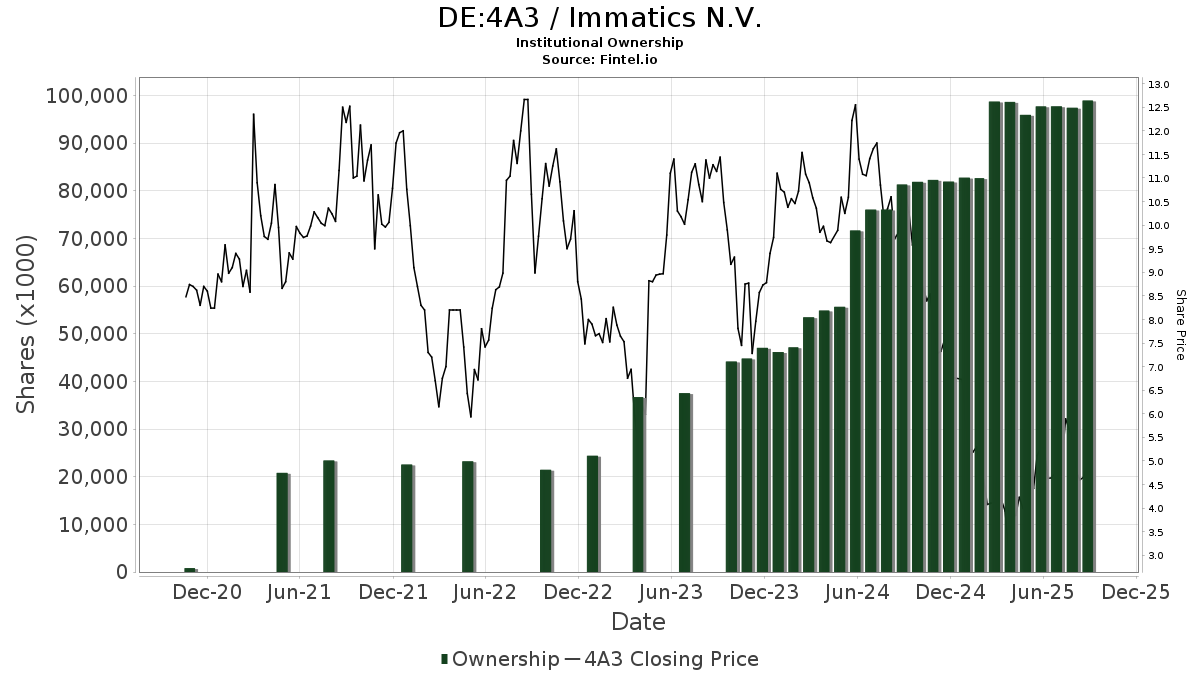
Immatics N.V. (DE:4A3) har 79 institutionelle ejere og aktionærer, der har indsendt 13D/G- eller 13F-formularer til Securities Exchange Commission (SEC). Disse institutioner har i alt 104,333,337 aktier. Største aktionærer omfatter T. Rowe Price Investment Management, Inc., Baker Bros. Advisors Lp, Rtw Investments, Lp, Suvretta Capital Management, Llc, Perceptive Advisors Llc, Vestal Point Capital, LP, Jefferies Financial Group Inc., Sofinnova Investments, Inc., VEXPX - VANGUARD EXPLORER FUND Investor Shares, and Morgan Stanley .
Immatics N.V. (DB:4A3) institutionel ejerskabsstruktur viser aktuelle positioner i virksomheden efter institutioner og fonde, samt seneste ændringer i positionsstørrelse. Større aktionærer kan omfatte individuelle investorer, investeringsforeninger, hedgefonde eller institutioner. Skema 13D angiver, at investoren besidder (eller besidder) mere end 5 % af virksomheden og har til hensigt (eller har til hensigt at) aktivt at forfølge en ændring i forretningsstrategi. Skema 13G indikerer en passiv investering på over 5%.
The share price as of March 18, 2026 is 8,42 / share. Previously, on March 20, 2025, the share price was 5,00 / share. This represents an increase of 68,30% over that period.
Fondens stemningsscore
Fund Sentiment Score (fka Ownership Accumulation Score) finder de aktier, der bliver mest købt af fonde. Det er resultatet af en sofistikeret, multi-faktor kvantitativ model, der identificerer virksomheder med de højeste niveauer af institutionel akkumulering. Scoringsmodellen bruger en kombination af den samlede stigning i oplyste ejere, ændringerne i porteføljeallokeringer i disse ejere og andre målinger. Tallet går fra 0 til 100, hvor højere tal indikerer et højere niveau af akkumulering for sine jævnaldrende, og 50 er gennemsnittet.
Opdateringsfrekvens: Dagligt
Se Ownership Explorer, som giver en liste over højest rangerende virksomheder.
AI+ Ask Fintel’s AI assistant about Immatics N.V..
Select a question to share a public post with an AI-crafted answer.
Thinking of good questions…
13F og NPORT arkivering
Detaljer om 13F-arkivering er gratis. Detaljer om NP-ansøgninger kræver et premium-medlemskab. Grønne rækker angiver nye positioner. Røde rækker angiver lukkede positioner. Klik på linket ikon for at se den fulde transaktionshistorik.
Opgrader
for at låse premium-data op og eksportere til Excel ![]() .
.
| Fil dato | Kilde | Investor | Type | Gennemsnitlig pris (Øst) |
Aktier | Δ Aktier (%) |
Rapporteret Værdi ($1000) |
Δ Værdi (%) |
Port Alloc (%) |
|
|---|---|---|---|---|---|---|---|---|---|---|
| 2026-02-10 | 13F | Bnp Paribas Arbitrage, Sa | 116.646 | -4,79 | 1.225 | 17,35 | ||||
| 2026-02-03 | 13F | SBI Securities Co., Ltd. | 25 | 0,00 | 0 | |||||
| 2025-11-12 | 13F | Intellectus Partners, LLC | 0 | -100,00 | 0 | |||||
| 2026-02-17 | 13F | Balyasny Asset Management Llc | 592.428 | 6.220 | ||||||
| 2026-02-17 | 13F | Wellington Management Group Llp | 1.635.231 | 8,13 | 17.170 | 33,26 | ||||
| 2025-11-14 | 13F | Raymond James Financial Inc | 0 | -100,00 | 0 | |||||
| 2026-02-09 | 13F | Hartland & Co., LLC | 25 | 0 | ||||||
| 2025-11-14 | 13F | Tower Research Capital LLC (TRC) | 0 | -100,00 | 0 | |||||
| 2026-02-13 | 13F | Barclays Plc | 28.185 | 11,35 | 296 | 37,21 | ||||
| 2025-11-14 | 13F | Engineers Gate Manager LP | 0 | -100,00 | 0 | -100,00 | ||||
| 2026-02-13 | 13F | State Street Corp | 444.658 | 103,50 | 4.669 | 150,83 | ||||
| 2026-02-17 | 13F | Advisor Group Holdings, Inc. | 5.175 | -3,04 | 54 | 100,00 | ||||
| 2026-02-17 | 13F | Ishara Investments LP | 80.000 | 840 | ||||||
| 2026-02-03 | 13F | Mitsubishi UFJ Kokusai Asset Management Co., Ltd. | 16.955 | -46,95 | 177 | -34,93 | ||||
| 2025-11-14 | 13F | Squarepoint Ops LLC | 0 | -100,00 | 0 | |||||
| 2026-02-17 | 13F | Logos Global Management LP | Call | 850.000 | 8.925 | |||||
| 2025-10-08 | 13F/A | New York State Common Retirement Fund | 0 | -100,00 | 0 | -100,00 | ||||
| 2026-02-17 | 13F | Millennium Management Llc | 83.122 | -88,49 | 873 | -85,82 | ||||
| 2026-02-17 | 13F | Lynx1 Capital Management LP | 921.950 | 9.680 | ||||||
| 2026-02-17 | 13F | Graham Capital Management, L.P. | 19.630 | 206 | ||||||
| 2026-02-17 | 13F | Vestal Point Capital, LP | 6.125.000 | -3,54 | 64.312 | 18,87 | ||||
| 2026-02-11 | 13F | Fox Run Management, L.l.c. | 12.307 | 129 | ||||||
| 2026-02-17 | 13F | J. Goldman & Co LP | 22.788 | 0,00 | 239 | 23,20 | ||||
| 2026-02-12 | 13F | Hrt Financial Lp | 0 | -100,00 | 0 | |||||
| 2026-02-10 | 13F | Td Asset Management Inc | 500.724 | 30,46 | 5.258 | 60,76 | ||||
| 2026-02-13 | 13F | Sofinnova Investments, Inc. | 3.435.542 | 54,21 | 36.073 | 90,05 | ||||
| 2026-02-17 | 13F | XTX Topco Ltd | 11.234 | -1,82 | 118 | 20,62 | ||||
| 2026-02-19 | 13F/A | T. Rowe Price Investment Management, Inc. | 21.459.156 | 10,71 | 225 | 36,36 | ||||
| 2026-02-17 | 13F | Suvretta Capital Management, Llc | 11.190.129 | -6,98 | 117.496 | 14,63 | ||||
| 2026-02-17 | 13F | Orbimed Advisors Llc | 0 | -100,00 | 0 | |||||
| 2026-02-09 | 13F | Sectoral Asset Management Inc | 63.015 | -88,76 | 662 | -86,16 | ||||
| 2026-02-13 | 13F/A | Virtus ETF Advisers LLC | 0 | -100,00 | 0 | |||||
| 2025-11-12 | 13F | Simplex Trading, Llc | 0 | -100,00 | 0 | |||||
| 2025-09-29 | NP | SUNAMERICA SERIES TRUST - SA Small Cap Index Portfolio Class 1 | 0 | -100,00 | 0 | |||||
| 2026-02-17 | 13F | Qube Research & Technologies Ltd | 147.328 | -4,80 | 1.547 | 17,30 | ||||
| 2026-02-17 | 13F | Ikarian Capital, LLC | 48.569 | -1,67 | 510 | 21,19 | ||||
| 2026-02-17 | 13F | Aquatic Capital Management LLC | 20.220 | 212 | ||||||
| 2026-02-17 | 13F | Rtw Investments, Lp | 11.433.354 | 29,69 | 120.050 | 59,83 | ||||
| 2026-02-17 | 13F | Bank Of America Corp /de/ | 13.546 | 68,86 | 142 | 108,82 | ||||
| 2025-11-14 | 13F | Paradigm Biocapital Advisors LP | 0 | -100,00 | 0 | |||||
| 2026-02-17 | 13F | 683 Capital Management, LLC | 0 | -100,00 | 0 | |||||
| 2026-02-17 | 13F | Guggenheim Capital Llc | 16.402 | 0,76 | 172 | 24,64 | ||||
| 2026-02-17 | 13F | Sphera Funds Management Ltd. | 861.105 | 47,68 | 9.042 | 81,98 | ||||
| 2026-02-09 | 13F | Jefferies Financial Group Inc. | 5.059.551 | 323,42 | 53.125 | 421,86 | ||||
| 2026-02-17 | 13F | Tudor Investment Corp Et Al | 54.720 | 575 | ||||||
| 2025-11-14 | 13F | Royal Bank Of Canada | 0 | -100,00 | 0 | -100,00 | ||||
| 2026-02-13 | 13F | Manufacturers Life Insurance Company, The | 0 | -100,00 | 0 | |||||
| 2026-02-17 | 13F | Burkehill Global Management, LP | 150.000 | 1.575 | ||||||
| 2025-11-14 | 13F | D. E. Shaw & Co., Inc. | 0 | -100,00 | 0 | |||||
| 2026-02-13 | 13F | Verition Fund Management LLC | 206.568 | 356,99 | 2.169 | 463,12 | ||||
| 2026-02-09 | 13F | Huntington National Bank | 1 | 0,00 | 0 | |||||
| 2026-02-17 | 13F | Northern Trust Corp | 203.449 | -5,18 | 2.136 | 16,85 | ||||
| 2026-01-09 | 13F | SG Americas Securities, LLC | 208.456 | 2 | ||||||
| 2026-02-13 | 13F | Quarry LP | 8.001 | 84 | ||||||
| 2026-02-13 | 13F | Pale Fire Capital SE | 16.272 | -52,52 | 171 | -41,58 | ||||
| 2025-11-07 | 13F | Gsa Capital Partners Llp | 0 | -100,00 | 0 | |||||
| 2026-02-17 | 13F | Point72 Asset Management, L.P. | 1.754.181 | 1.384,22 | 18.419 | 1.730,82 | ||||
| 2025-11-14 | 13F | Lazard Asset Management Llc | 0 | -100,00 | 0 | |||||
| 2025-09-29 | NP | BBC - Virtus LifeSci Biotech Clinical Trials ETF | 19.817 | -10,58 | 128 | 15,45 | ||||
| 2026-02-17 | 13F | StemPoint Capital LP | 610.308 | 6.408 | ||||||
| 2026-02-13 | 13F | University Of Texas/texas Am Investment Managment Co | 697.431 | 0,00 | 7.323 | 23,24 | ||||
| 2026-01-16 | 13F | Standard Life Aberdeen plc | 714.569 | -9,48 | 7.503 | 11,54 | ||||
| 2026-02-17 | 13F | Susquehanna International Group, Llp | Call | 0 | -100,00 | 0 | ||||
| 2026-02-17 | 13F | Readystate Asset Management Lp | 0 | -100,00 | 0 | |||||
| 2026-02-13 | 13F | Morgan Stanley | 2.089.796 | -5,24 | 21.943 | 16,78 | ||||
| 2026-02-17 | 13F | Price T Rowe Associates Inc /md/ | 748.035 | 3,20 | 8 | 16,67 | ||||
| 2026-02-13 | 13F | Alyeska Investment Group, L.P. | 789.163 | 163,05 | 8.286 | 224,18 | ||||
| 2026-02-17 | 13F | Perceptive Advisors Llc | 10.383.456 | 10,66 | 109.026 | 36,37 | ||||
| 2026-02-17 | 13F | DAFNA Capital Management LLC | 261.138 | 11,12 | 2.742 | 36,91 | ||||
| 2026-02-17 | 13F | Woodline Partners LP | 1.000.597 | -45,67 | 10.506 | -33,04 | ||||
| 2025-11-14 | 13F/A | Skopos Labs, Inc. | 0 | -100,00 | 0 | -100,00 | ||||
| 2026-02-17 | 13F | Longaeva Partners L.P. | 44.601 | 468 | ||||||
| 2026-02-17 | 13F | Baker Bros. Advisors Lp | 12.094.094 | 0,00 | 126.988 | 23,24 | ||||
| 2026-02-13 | 13F | MYDA Advisors LLC | 120.000 | 0,00 | 1.260 | 23,29 | ||||
| 2026-02-17 | 13F | Citadel Advisors Llc | Call | 11.300 | -69,13 | 119 | -62,06 | |||
| 2026-02-09 | 13F | Geode Capital Management, Llc | 134.763 | 96,07 | 1.415 | 141,88 | ||||
| 2026-02-12 | 13F | Alps Advisors Inc | 110.082 | 1.156 | ||||||
| 2026-02-17 | 13F | Citadel Advisors Llc | 1.714.961 | 184,33 | 18.007 | 250,47 | ||||
| 2026-02-17 | 13F | Jump Financial, LLC | 50.868 | 534 | ||||||
| 2026-02-18 | 13F | GWM Advisors LLC | 100 | 0,00 | 1 | |||||
| 2026-01-29 | 13F | UBS Group AG | 563.463 | 61,28 | 5.916 | 98,79 | ||||
| 2026-02-10 | 13F | Goldman Sachs Group Inc | 323.023 | 69,34 | 3.392 | 108,68 | ||||
| 2026-02-17 | 13F | Mercer Global Advisors Inc /adv | 29.987 | 0,00 | 315 | 23,14 | ||||
| 2026-02-17 | 13F | SummitTX Capital, L.P. | 96.784 | 117,66 | 1.016 | 168,78 | ||||
| 2026-02-12 | 13F | Monashee Investment Management LLC | 160.336 | 1.684 | ||||||
| 2025-09-25 | NP | VINEX - Vanguard International Explorer Fund Investor Shares | 297.837 | 15,88 | 1.921 | 49,49 | ||||
| 2025-11-14 | 13F | J. Goldman & Co LP | Call | 0 | -100,00 | 0 | ||||
| 2026-02-12 | 13F | Insigneo Advisory Services, Llc | 0 | -100,00 | 0 | |||||
| 2026-02-13 | 13F | Schroder Investment Management Group | 402.352 | -5,99 | 4.052 | 19,68 | ||||
| 2026-02-13 | 13F | Caitong International Asset Management Co., Ltd | 17 | 0 | ||||||
| 2026-02-17 | 13F | Caption Management, LLC | 550.891 | 5.784 | ||||||
| 2026-02-13 | 13F | Vontobel Holding Ltd. | 0 | -100,00 | 0 | |||||
| 2026-02-13 | 13F | Mariner, LLC | 13.405 | -1,07 | 141 | 21,74 | ||||
| 2025-09-25 | NP | VEXPX - VANGUARD EXPLORER FUND Investor Shares | 2.402.791 | -35,85 | 15.498 | -17,24 | ||||
| 2026-02-12 | 13F | Wasatch Advisors Inc | 515.128 | -28,34 | 5.409 | -11,71 | ||||
| 2026-02-12 | 13F | Jane Street Group, Llc | 104.929 | 1.102 | ||||||
| 2026-02-17 | 13F | Caption Management, LLC | Call | 850.000 | 8.925 | |||||
| 2026-02-13 | 13F | JustInvest LLC | 49.374 | 3,65 | 518 | 27,90 | ||||
| 2026-02-12 | 13F | BlackRock, Inc. | 25.554 | -89,20 | 268 | -86,70 | ||||
| 2026-01-23 | 13F | Farther Finance Advisors, LLC | 528 | 57,61 | 6 | 150,00 | ||||
| 2026-02-13 | 13F | Citigroup Inc | 56.367 | 592 | ||||||
| 2026-02-11 | 13F | Jpmorgan Chase & Co | 146.972 | 8,10 | 1.543 | 33,25 | ||||
| 2026-02-17 | 13F | Susquehanna International Group, Llp | Put | 34.200 | 359 | |||||
| 2026-02-17 | 13F | Susquehanna International Group, Llp | 17.024 | -2,46 | 179 | 20,27 | ||||
| 2026-02-13 | 13F | Wells Fargo & Company/mn | 651 | 4.550,00 | 7 | |||||
| 2026-02-17 | 13F | Toronto Dominion Bank | 0 | -100,00 | 0 | |||||
| 2026-02-17 | 13F | Virtus Investment Advisers, Inc. | 26.497 | 42,98 | 278 | 77,07 |
Other Listings
| US:IMTX | 9,71 $ |