Grundlæggende statistik
| Institutionelle aktier (lange) | 20.681.426 - 68,74% (ex 13D/G) - change of -2,35MM shares -10,21% MRQ |
| Institutionel værdi (lang) | $ 251.045 USD ($1000) |
Institutionelt ejerskab og aktionærer
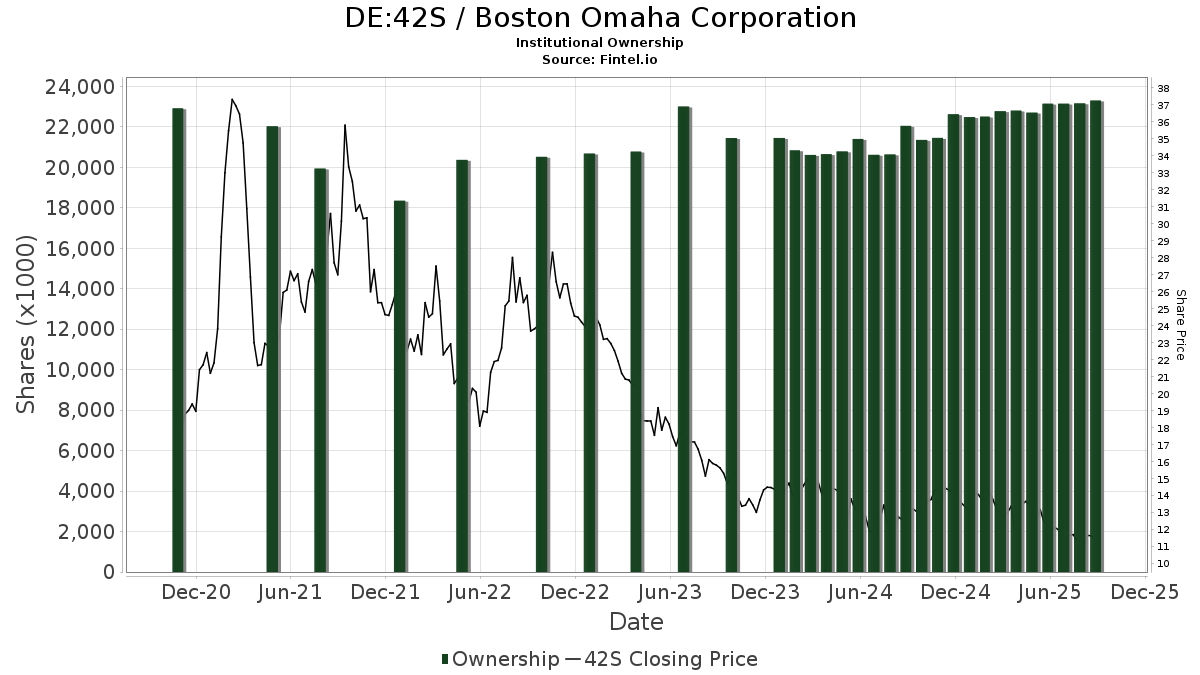
Boston Omaha Corporation (DE:42S) har 124 institutionelle ejere og aktionærer, der har indsendt 13D/G- eller 13F-formularer til Securities Exchange Commission (SEC). Disse institutioner har i alt 20,681,426 aktier. Største aktionærer omfatter Magnolia Group, Llc, Massachusetts Institute Of Technology, BlackRock, Inc., Dimensional Fund Advisors Lp, Elgethun Capital Management, Vanguard Group Inc, Fenimore Asset Management Inc, Private Management Group Inc, Geode Capital Management, Llc, and State Street Corp .
Boston Omaha Corporation (DB:42S) institutionel ejerskabsstruktur viser aktuelle positioner i virksomheden efter institutioner og fonde, samt seneste ændringer i positionsstørrelse. Større aktionærer kan omfatte individuelle investorer, investeringsforeninger, hedgefonde eller institutioner. Skema 13D angiver, at investoren besidder (eller besidder) mere end 5 % af virksomheden og har til hensigt (eller har til hensigt at) aktivt at forfølge en ændring i forretningsstrategi. Skema 13G indikerer en passiv investering på over 5%.
The share price as of April 24, 2026 is 10,50 / share. Previously, on April 28, 2025, the share price was 13,38 / share. This represents a decline of 21,52% over that period.
Fondens stemningsscore
Fund Sentiment Score (fka Ownership Accumulation Score) finder de aktier, der bliver mest købt af fonde. Det er resultatet af en sofistikeret, multi-faktor kvantitativ model, der identificerer virksomheder med de højeste niveauer af institutionel akkumulering. Scoringsmodellen bruger en kombination af den samlede stigning i oplyste ejere, ændringerne i porteføljeallokeringer i disse ejere og andre målinger. Tallet går fra 0 til 100, hvor højere tal indikerer et højere niveau af akkumulering for sine jævnaldrende, og 50 er gennemsnittet.
Opdateringsfrekvens: Dagligt
Se Ownership Explorer, som giver en liste over højest rangerende virksomheder.
AI+ Ask Fintel’s AI assistant about Boston Omaha Corporation.
Select a question to share a public post with an AI-crafted answer.
Thinking of good questions…
13F og NPORT arkivering
Detaljer om 13F-arkivering er gratis. Detaljer om NP-ansøgninger kræver et premium-medlemskab. Grønne rækker angiver nye positioner. Røde rækker angiver lukkede positioner. Klik på linket ikon for at se den fulde transaktionshistorik.
Opgrader
for at låse premium-data op og eksportere til Excel ![]() .
.
| Fil dato | Kilde | Investor | Type | Gennemsnitlig pris (Øst) |
Aktier | Δ Aktier (%) |
Rapporteret Værdi ($1000) |
Δ Værdi (%) |
Port Alloc (%) |
|
|---|---|---|---|---|---|---|---|---|---|---|
| 2026-04-23 | 13F | Farmers & Merchants Investments Inc | 509 | 6 | ||||||
| 2026-02-13 | 13F | Ubs Asset Management Americas Inc | 1.766 | 22 | ||||||
| 2026-04-15 | 13F | Compagnie Lombard Odier SCmA | 75 | 0,00 | 1 | |||||
| 2026-02-10 | 13F | Goldman Sachs Group Inc | 88.420 | 54,79 | 1.094 | 46,32 | ||||
| 2026-02-17 | 13F | Royal Bank Of Canada | 3.119 | -43,32 | 39 | -45,83 | ||||
| 2026-02-05 | 13F | Amalgamated Bank | 684 | -14,29 | 0 | |||||
| 2026-02-13 | 13F | Kilter Group LLC | 772 | 0,00 | 10 | -10,00 | ||||
| 2025-11-14 | 13F | Northwestern Mutual Wealth Management Co | 0 | -100,00 | 0 | |||||
| 2026-01-29 | 13F | Vanguard Group Inc | 1.433.906 | -2,82 | 17.737 | -8,09 | ||||
| 2026-04-15 | 13F | Sarver Vrooman Wealth Advisors | 0 | -100,00 | 0 | |||||
| 2026-02-17 | 13F | Aquatic Capital Management LLC | 8.422 | -64,60 | 104 | -66,56 | ||||
| 2025-11-14 | 13F | Concorde Financial Corp | 0 | -100,00 | 0 | |||||
| 2026-02-09 | 13F | Geode Capital Management, Llc | 519.999 | 0,86 | 6.434 | -4,63 | ||||
| 2026-01-15 | 13F | Nisa Investment Advisors, Llc | 850 | 949,38 | 11 | 900,00 | ||||
| 2026-02-17 | 13F | California State Teachers Retirement System | 1.336 | -25,24 | 17 | -30,43 | ||||
| 2026-02-13 | 13F | Arrowstreet Capital, Limited Partnership | 118.311 | -41,53 | 1.464 | -44,71 | ||||
| 2026-01-30 | 13F | American Capital Advisory, LLC | 100 | 0,00 | 1 | 0,00 | ||||
| 2026-02-12 | 13F | MetLife Investment Management, LLC | 12.826 | 38,66 | 159 | 31,67 | ||||
| 2026-04-06 | 13F | GAMMA Investing LLC | 547 | 205,59 | 6 | 200,00 | ||||
| 2025-11-14 | 13F | Zurcher Kantonalbank (Zurich Cantonalbank) | 0 | -100,00 | 0 | |||||
| 2026-02-12 | 13F | BlackRock, Inc. | 1.579.404 | 0,67 | 19.537 | -4,80 | ||||
| 2026-01-28 | 13F | Geneos Wealth Management Inc. | 75 | 0,00 | 1 | |||||
| 2026-02-13 | 13F | Meixler Investment Management, Ltd. | 105.472 | -2,83 | 1.305 | -8,10 | ||||
| 2026-02-06 | 13F | Global Retirement Partners, LLC | 17.053 | 127,31 | 211 | 114,29 | ||||
| 2026-02-09 | 13F | Quest Partners LLC | 16.164 | -41,33 | 200 | -44,72 | ||||
| 2026-02-17 | 13F | Fmr Llc | 1.432 | 152,11 | 18 | 142,86 | ||||
| 2026-02-13 | 13F | State Street Corp | 468.665 | 0,30 | 5.797 | -5,14 | ||||
| 2026-02-02 | 13F | Pittenger & Anderson Inc | 4.250 | 53 | ||||||
| 2025-10-27 | 13F | Versant Capital Management, Inc | 0 | -100,00 | 0 | |||||
| 2026-02-17 | 13F | Alliancebernstein L.p. | 23.270 | 0,00 | 288 | -5,59 | ||||
| 2026-04-24 | 13F | Vision Financial Markets Llc | 70 | 0,00 | 1 | |||||
| 2026-02-17 | 13F | D. E. Shaw & Co., Inc. | 29.484 | 51,17 | 365 | 42,75 | ||||
| 2026-02-11 | 13F | Simplex Trading, Llc | 5.102 | 4,57 | 63 | |||||
| 2026-02-17 | 13F | First Manhattan Co | 333.967 | 4.131 | ||||||
| 2026-02-10 | 13F | Tidemark, LLC | 215 | 0,00 | 3 | 0,00 | ||||
| 2026-02-12 | 13F | EntryPoint Capital, LLC | 28.378 | 33,81 | 351 | 26,71 | ||||
| 2026-04-23 | 13F | Global Trust Asset Management, LLC | 28 | 0 | ||||||
| 2026-02-13 | 13F | Charles Schwab Investment Management Inc | 62.806 | -0,24 | 777 | -5,71 | ||||
| 2026-02-06 | 13F | Gsa Capital Partners Llp | 16.666 | -21,46 | 0 | |||||
| 2026-02-17 | 13F | Nitor Capital Management LLC | 370.350 | 4.581 | ||||||
| 2026-02-17 | 13F | Optiver Holding B.V. | 340 | 0,00 | 4 | 0,00 | ||||
| 2025-11-17 | 13F | Great West Life Assurance Co /can/ | 0 | -100,00 | 0 | |||||
| 2026-02-02 | 13F | Fenimore Asset Management Inc | 926.624 | -2,73 | 11.462 | -8,01 | ||||
| 2025-11-14 | 13F | Hrt Financial Lp | 0 | -100,00 | 0 | |||||
| 2026-02-10 | 13F | George Kaiser Family Foundation | 140.932 | 0,00 | 1.743 | -5,43 | ||||
| 2026-04-17 | 13F | AdvisorNet Financial, Inc | 40 | 0,00 | 0 | |||||
| 2026-02-17 | 13F | Millennium Management Llc | 41.101 | 110,29 | 508 | 99,22 | ||||
| 2026-02-03 | 13F | Bokf, Na | 10.000 | -0,11 | 124 | -5,38 | ||||
| 2026-02-13 | 13F | Wells Fargo & Company/mn | 27.224 | 31,46 | 337 | 24,44 | ||||
| 2025-11-14 | 13F | Tudor Investment Corp Et Al | 0 | -100,00 | 0 | |||||
| 2026-02-13 | 13F | Barclays Plc | 33.975 | 10,68 | 420 | 4,74 | ||||
| 2026-02-13 | 13F | Citigroup Inc | 4.312 | -24,85 | 53 | -29,33 | ||||
| 2026-04-24 | 13F | Magnolia Group, Llc | 5.589.253 | 0,00 | 65.282 | -5,58 | ||||
| 2026-04-07 | 13F | Farther Finance Advisors, LLC | 33 | 0 | ||||||
| 2026-02-11 | 13F | Parallel Advisors, LLC | 0 | -100,00 | 0 | |||||
| 2026-02-17 | 13F | Creative Planning | 14.221 | 176 | ||||||
| 2025-11-04 | 13F | State of Wyoming | 0 | -100,00 | 0 | |||||
| 2026-04-20 | 13F | Ronald Blue Trust, Inc. | 50 | 1 | ||||||
| 2026-02-17 | 13F | ArrowMark Colorado Holdings LLC | 27.890 | -13,07 | 345 | -17,90 | ||||
| 2026-02-19 | 13F | Invesco Ltd. | 0 | -100,00 | 0 | |||||
| 2026-02-17 | 13F | Northern Trust Corp | 165.457 | -2,78 | 2.047 | -8,09 | ||||
| 2026-02-12 | 13F | Massachusetts Institute Of Technology | 2.444.473 | 0,00 | 30.238 | -5,43 | ||||
| 2026-02-17 | 13F | Tower Research Capital LLC (TRC) | 1.758 | 6,80 | 22 | 0,00 | ||||
| 2026-02-11 | 13F | Deutsche Bank Ag\ | 17.157 | 593,21 | 212 | 562,50 | ||||
| 2026-04-10 | 13F | Abound Wealth Management | 71 | 0,00 | 1 | |||||
| 2026-04-20 | 13F | State of Alaska, Department of Revenue | 972 | 0,00 | 0 | |||||
| 2026-02-17 | 13F | Guardian Wealth Advisors, Llc / Nc | 11.000 | 4,76 | 136 | -0,73 | ||||
| 2026-02-17 | 13F | Susquehanna International Group, Llp | 11.628 | -13,18 | 144 | -18,29 | ||||
| 2026-01-26 | 13F | Cwm, Llc | 1.083 | 1.253,75 | 0 | |||||
| 2026-02-17 | 13F | Advisor Group Holdings, Inc. | 3.444 | -17,15 | 43 | -22,22 | ||||
| 2026-02-06 | 13F | EverSource Wealth Advisors, LLC | 608 | 8 | ||||||
| 2026-02-09 | 13F | Legal & General Group Plc | 1.992 | 0,00 | 25 | -7,69 | ||||
| 2026-02-17 | 13F | Jones Financial Companies Lllp | 1.550 | 148,00 | 19 | 137,50 | ||||
| 2026-02-17 | 13F | Cetera Investment Advisers | 43.371 | 536 | ||||||
| 2026-02-13 | 13F | American Century Companies Inc | 60.038 | -3,04 | 743 | -8,28 | ||||
| 2026-01-29 | 13F | Cornerstone Investment Partners, LLC | 0 | -100,00 | 0 | |||||
| 2026-02-17 | 13F | Susquehanna International Group, Llp | Call | 0 | -100,00 | 0 | ||||
| 2026-02-03 | 13F | SBI Securities Co., Ltd. | 394 | -0,25 | 5 | -20,00 | ||||
| 2026-04-24 | 13F | My Purposeful Wealth Corp. | 456.551 | 4,78 | 5.333 | -1,08 | ||||
| 2026-02-17 | 13F | Citadel Advisors Llc | 207.684 | 17,47 | 2.569 | 11,12 | ||||
| 2026-02-09 | 13F | Huntington National Bank | 1 | 0,00 | 0 | |||||
| 2026-02-17 | 13F | Citadel Advisors Llc | Call | 18.400 | 228 | |||||
| 2026-02-12 | 13F | Insigneo Advisory Services, Llc | 15.270 | 0,00 | 189 | -5,53 | ||||
| 2026-03-12 | 13F | Nalls Sherbakoff Group, Llc | 0 | -100,00 | 0 | |||||
| 2026-02-12 | 13F | Federation des caisses Desjardins du Quebec | 369 | 0,00 | 5 | 0,00 | ||||
| 2026-02-10 | 13F | Rothschild Investment Llc | 0 | -100,00 | 0 | |||||
| 2026-02-12 | 13F | Dimensional Fund Advisors Lp | 1.565.459 | -0,09 | 19.364 | -5,51 | ||||
| 2026-04-16 | 13F | Security National Bank | 2.800 | 0,00 | 33 | -5,88 | ||||
| 2026-02-06 | 13F | Covestor Ltd | 12.081 | -7,54 | 0 | |||||
| 2026-02-17 | 13F | Russell Investments Group, Ltd. | 2.034 | 8,65 | 25 | 4,17 | ||||
| 2026-02-17 | 13F | Raymond James Financial Inc | 14.926 | 3,12 | 185 | -2,65 | ||||
| 2026-01-20 | 13F | Lawson Kroeker Investment Management Inc/ne | 0 | -100,00 | 0 | -100,00 | ||||
| 2025-11-13 | 13F | Cove Street Capital, LLC | 860 | 0,00 | 11 | -8,33 | ||||
| 2026-04-13 | 13F | IFP Advisors, Inc | 52 | 0,00 | 1 | |||||
| 2026-02-17 | 13F | Quantinno Capital Management LP | 35.744 | 119,26 | 442 | 107,51 | ||||
| 2026-02-05 | 13F | HighMark Wealth Management LLC | 0 | -100,00 | 0 | -100,00 | ||||
| 2026-02-13 | 13F | Aptus Capital Advisors, LLC | 11.000 | 4,76 | 136 | -0,73 | ||||
| 2026-02-11 | 13F | Jpmorgan Chase & Co | 8.701 | -3,49 | 108 | -8,55 | ||||
| 2026-02-17 | 13F | MIRAE ASSET GLOBAL ETFS HOLDINGS Ltd. | 10.129 | -1,18 | 125 | -6,72 | ||||
| 2025-11-12 | 13F | Intech Investment Management Llc | 0 | -100,00 | 0 | -100,00 | ||||
| 2026-02-13 | 13F | Caitong International Asset Management Co., Ltd | 0 | -100,00 | 0 | |||||
| 2026-02-05 | 13F | Allworth Financial LP | 93 | -92,04 | 1 | -93,33 | ||||
| 2026-02-11 | 13F | Ameritas Investment Partners, Inc. | 2.278 | 28 | ||||||
| 2026-01-16 | 13F | Abacus Planning Group, Inc. | 0 | -100,00 | 0 | |||||
| 2026-02-11 | 13F | Rise Advisors, LLC | 0 | -100,00 | 0 | |||||
| 2026-02-17 | 13F | Equitable Holdings, Inc. | 20.829 | 0,02 | 258 | -5,51 | ||||
| 2026-02-13 | 13F | MAI Capital Management | 52 | 0,00 | 1 | |||||
| 2026-02-13 | 13F | Parkside Financial Bank & Trust | 0 | -100,00 | 0 | |||||
| 2026-04-23 | 13F | North Star Investment Management Corp. | 295 | 59,46 | 3 | 50,00 | ||||
| 2025-10-30 | 13F | Ridgewood Investments LLC | 0 | -100,00 | 0 | |||||
| 2026-02-18 | 13F | EP Wealth Advisors, Inc. | 0 | -100,00 | 0 | |||||
| 2026-02-11 | 13F | Franklin Resources Inc | 0 | -100,00 | 0 | |||||
| 2026-02-13 | 13F | Missouri Trust & Investment Co | 37 | 0,00 | 0 | |||||
| 2026-02-17 | 13F | Balyasny Asset Management Llc | 19.659 | 243 | ||||||
| 2026-04-22 | 13F | Spire Wealth Management | 0 | -100,00 | 0 | |||||
| 2026-04-13 | 13F | True Wealth Design, LLC | 2 | -50,00 | 0 | |||||
| 2026-02-11 | 13F | Private Management Group Inc | 712.608 | -2,70 | 8.815 | -7,99 | ||||
| 2026-02-11 | 13F | Los Angeles Capital Management Llc | 206 | 3 | ||||||
| 2026-02-13 | 13F | Morgan Stanley | 47.203 | -8,70 | 584 | -13,76 | ||||
| 2026-02-17 | 13F | Two Sigma Advisers, Lp | 62.400 | -24,73 | 772 | -28,87 | ||||
| 2026-02-17 | 13F | Two Sigma Investments, Lp | 110.512 | 14,85 | 1.367 | 8,66 | ||||
| 2026-04-22 | 13F | Sterling Capital Management LLC | 680 | -42,23 | 8 | -50,00 | ||||
| 2026-03-16 | 13F/A | Rockefeller Capital Management L.P. | 80 | 0,00 | 1 | -100,00 | ||||
| 2026-02-17 | 13F | Susquehanna Portfolio Strategies, LLC | 35.069 | 106,12 | 434 | 95,05 | ||||
| 2026-02-10 | 13F | Elgethun Capital Management | 1.453.842 | 1,91 | 17.984 | -3,47 | ||||
| 2026-01-22 | 13F | Bfsg, Llc | 5.795 | 0,00 | 72 | -5,33 | ||||
| 2026-01-30 | 13F | Us Bancorp \de\ | 0 | -100,00 | 0 | |||||
| 2026-02-12 | 13F | Jane Street Group, Llc | 22.833 | -53,23 | 282 | -55,80 | ||||
| 2026-04-13 | 13F | Massmutual Trust Co Fsb/adv | 300 | 0,00 | 4 | 0,00 | ||||
| 2026-04-23 | 13F | SJS Investment Consulting Inc. | 86 | 1 | ||||||
| 2026-01-30 | 13F | Torren Management, LLC | 29 | 0 | ||||||
| 2026-02-17 | 13F | Mercer Global Advisors Inc /adv | 10.112 | 125 | ||||||
| 2026-01-29 | 13F | UBS Group AG | 80.891 | -24,82 | 1.001 | -28,93 | ||||
| 2026-02-09 | 13F | Flagstone Financial Management | 24.215 | 7,55 | 300 | 1,70 | ||||
| 2026-02-10 | 13F | Pecaut & Co. | 0 | -100,00 | 0 | |||||
| 2025-11-14 | 13F | Mariner, LLC | 0 | -100,00 | 0 | |||||
| 2026-02-13 | 13F | Smartleaf Asset Management LLC | 24 | 0 | ||||||
| 2026-02-17 | 13F | ExodusPoint Capital Management, LP | 0 | -100,00 | 0 | -100,00 | ||||
| 2026-02-11 | 13F | Brandywine Global Investment Management, LLC | 124.790 | -3,78 | 1.544 | -9,02 | ||||
| 2026-02-17 | 13F | Trexquant Investment LP | 71.956 | 121,97 | 890 | 109,91 | ||||
| 2026-02-12 | 13F | Quadrant Capital Group Llc | 290 | 0,00 | 4 | 0,00 | ||||
| 2026-02-10 | 13F | Bnp Paribas Arbitrage, Sa | 12.238 | -18,22 | 151 | -22,56 | ||||
| 2026-02-12 | 13F | New York State Common Retirement Fund | 1.943 | 0,00 | 24 | -4,00 | ||||
| 2026-02-17 | 13F | Bank Of America Corp /de/ | 19.213 | -68,68 | 238 | -70,45 | ||||
| 2026-02-17 | 13F | Occudo Quantitative Strategies Lp | 0 | -100,00 | 0 | |||||
| 2026-02-13 | 13F | Verition Fund Management LLC | 0 | -100,00 | 0 | |||||
| 2026-02-13 | 13F | SRS Capital Advisors, Inc. | 0 | -100,00 | 0 | |||||
| 2026-01-16 | 13F | West Branch Capital LLC | 0 | -100,00 | 0 | |||||
| 2026-02-10 | 13F | Bank of New York Mellon Corp | 59.778 | -1,35 | 739 | -6,69 | ||||
| 2026-04-07 | 13F | Signaturefd, Llc | 58 | 0,00 | 1 | |||||
| 2025-11-13 | 13F | Swiss National Bank | 0 | -100,00 | 0 | |||||
| 2026-02-10 | 13F | Private Wealth Asset Management, LLC | 150 | 0,00 | 2 | 0,00 | ||||
| 2026-02-17 | 13F | Advisory Services Network, LLC | 0 | -100,00 | 0 | |||||
| 2025-10-29 | 13F | Compass Ion Advisors, LLC | 0 | -100,00 | 0 | |||||
| 2026-02-12 | 13F | Nuveen, LLC | 38.804 | 0,00 | 480 | -5,33 | ||||
| 2026-02-13 | 13F | Rhumbline Advisers | 29.827 | -12,41 | 369 | -17,30 | ||||
| 2026-02-17 | 13F | Jump Financial, LLC | 11.164 | 138 | ||||||
| 2026-02-17 | 13F | Price T Rowe Associates Inc /md/ | 13.117 | 16,59 | 0 | |||||
| 2026-02-13 | 13F | Ironvine Capital Partners, LLC | 451.714 | -3,78 | 5.588 | -9,01 | ||||
| 2025-11-13 | 13F | Acadian Asset Management Llc | 0 | -100,00 | 0 | |||||
| 2026-02-04 | 13F | Atlantic Union Bankshares Corp | 120 | 1 | ||||||
| 2026-02-13 | 13F | Police & Firemen's Retirement System of New Jersey | 5.581 | 0,00 | 69 | -4,17 | ||||
| 2026-02-03 | 13F | Alpha Cubed Investments, LLC | 51.408 | -1,28 | 636 | -6,75 | ||||
| 2026-02-12 | 13F | Renaissance Technologies Llc | 0 | -100,00 | 0 |
Other Listings
| US:BOC | 12,32 $ |