Grundlæggende statistik
| Institutionelle aktier (lange) | 33.813.739 - 40,53% (ex 13D/G) - change of -0,61MM shares -1,78% MRQ |
| Institutionel værdi (lang) | $ 181.051 USD ($1000) |
Institutionelt ejerskab og aktionærer
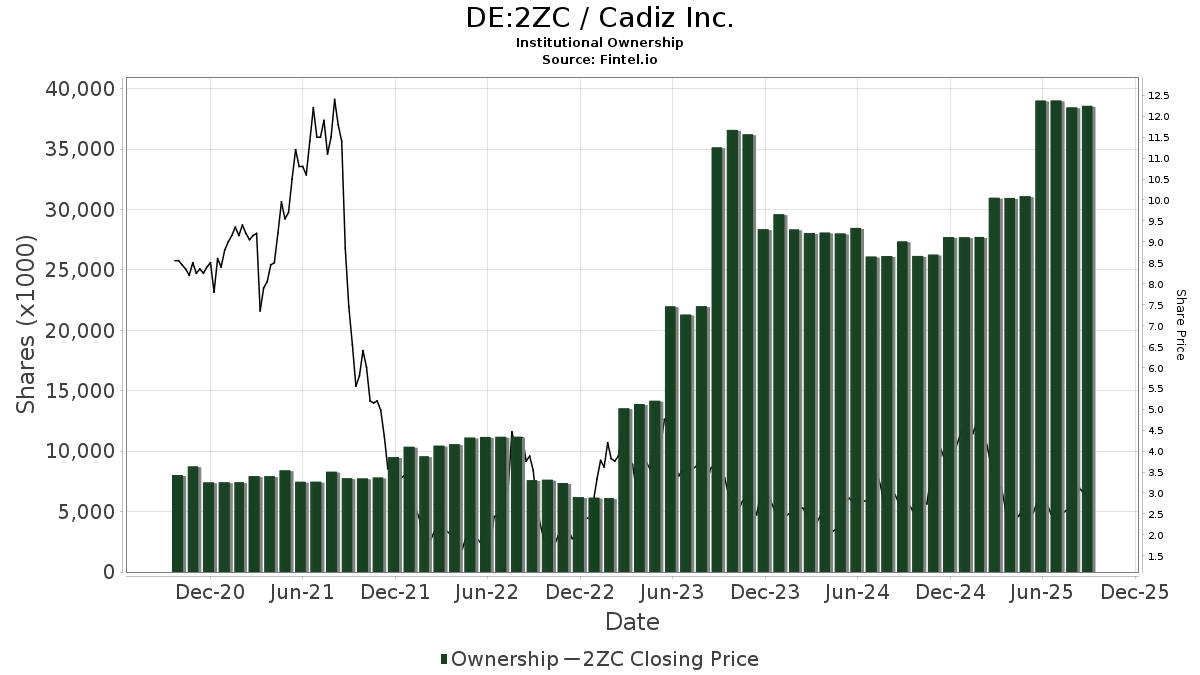
Cadiz Inc. (DE:2ZC) har 125 institutionelle ejere og aktionærer, der har indsendt 13D/G- eller 13F-formularer til Securities Exchange Commission (SEC). Disse institutioner har i alt 33,813,739 aktier. Største aktionærer omfatter BlackRock, Inc., Levin Capital Strategies, L.p., Bank Of America Corp /de/, Barclays Plc, Vanguard Group Inc, Gratia Capital, Llc, Geode Capital Management, Llc, Morgan Stanley, State Street Corp, and Susquehanna International Group, Llp .
Cadiz Inc. (DB:2ZC) institutionel ejerskabsstruktur viser aktuelle positioner i virksomheden efter institutioner og fonde, samt seneste ændringer i positionsstørrelse. Større aktionærer kan omfatte individuelle investorer, investeringsforeninger, hedgefonde eller institutioner. Skema 13D angiver, at investoren besidder (eller besidder) mere end 5 % af virksomheden og har til hensigt (eller har til hensigt at) aktivt at forfølge en ændring i forretningsstrategi. Skema 13G indikerer en passiv investering på over 5%.
The share price as of April 24, 2026 is 3,96 / share. Previously, on April 28, 2025, the share price was 2,50 / share. This represents an increase of 58,40% over that period.
Fondens stemningsscore
Fund Sentiment Score (fka Ownership Accumulation Score) finder de aktier, der bliver mest købt af fonde. Det er resultatet af en sofistikeret, multi-faktor kvantitativ model, der identificerer virksomheder med de højeste niveauer af institutionel akkumulering. Scoringsmodellen bruger en kombination af den samlede stigning i oplyste ejere, ændringerne i porteføljeallokeringer i disse ejere og andre målinger. Tallet går fra 0 til 100, hvor højere tal indikerer et højere niveau af akkumulering for sine jævnaldrende, og 50 er gennemsnittet.
Opdateringsfrekvens: Dagligt
Se Ownership Explorer, som giver en liste over højest rangerende virksomheder.
AI+ Ask Fintel’s AI assistant about Cadiz Inc..
Select a question to share a public post with an AI-crafted answer.
Thinking of good questions…
13F og NPORT arkivering
Detaljer om 13F-arkivering er gratis. Detaljer om NP-ansøgninger kræver et premium-medlemskab. Grønne rækker angiver nye positioner. Røde rækker angiver lukkede positioner. Klik på linket ikon for at se den fulde transaktionshistorik.
Opgrader
for at låse premium-data op og eksportere til Excel ![]() .
.
| Fil dato | Kilde | Investor | Type | Gennemsnitlig pris (Øst) |
Aktier | Δ Aktier (%) |
Rapporteret Værdi ($1000) |
Δ Værdi (%) |
Port Alloc (%) |
|
|---|---|---|---|---|---|---|---|---|---|---|
| 2026-02-12 | 13F | Jane Street Group, Llc | Put | 11.100 | 62 | |||||
| 2026-02-12 | 13F | Jane Street Group, Llc | Call | 445.400 | 254,90 | 2.499 | 321,96 | |||
| 2026-02-17 | 13F | Northern Trust Corp | 454.835 | -3,23 | 2.552 | 15,01 | ||||
| 2026-02-17 | 13F | XTX Topco Ltd | 53.522 | 300 | ||||||
| 2026-02-10 | 13F | Bnp Paribas Arbitrage, Sa | 12.191 | 10,21 | 68 | 30,77 | ||||
| 2026-04-07 | 13F | Farther Finance Advisors, LLC | 704 | 21,59 | 4 | 0,00 | ||||
| 2026-04-16 | 13F | SG Americas Securities, LLC | 218.094 | 1.511,57 | 1 | |||||
| 2026-02-26 | 13F/A | Alpine Global Management, LLC | 50.004 | 281 | ||||||
| 2025-11-14 | 13F | Wolverine Trading, Llc | 77.244 | 127,63 | 367 | 248,57 | ||||
| 2026-04-06 | 13F | Versant Capital Management, Inc | 42 | 0 | ||||||
| 2026-02-17 | 13F | Hartree Partners, LP | 0 | -100,00 | 0 | |||||
| 2025-11-14 | 13F | 272 Capital LP | 0 | -100,00 | 0 | |||||
| 2025-11-14 | 13F | Wolverine Trading, Llc | Call | 28.200 | 107,35 | 134 | 216,67 | |||
| 2026-01-30 | 13F | Pekin Hardy Strauss, Inc. | 66.500 | 373 | ||||||
| 2026-04-06 | 13F | GAMMA Investing LLC | 695 | 411,03 | 3 | |||||
| 2026-02-17 | 13F | California State Teachers Retirement System | 3.384 | 10,81 | 19 | 28,57 | ||||
| 2026-02-17 | 13F | Jones Financial Companies Lllp | 1.000 | 0,00 | 6 | 25,00 | ||||
| 2026-02-13 | 13F | Alyeska Investment Group, L.P. | 0 | -100,00 | 0 | -100,00 | ||||
| 2026-02-05 | 13F | Allworth Financial LP | 153 | 750,00 | 1 | |||||
| 2026-02-13 | 13F | Squarepoint Ops LLC | 91.032 | 511 | ||||||
| 2026-02-17 | 13F | Tower Research Capital LLC (TRC) | 2.249 | -16,98 | 13 | 0,00 | ||||
| 2026-02-06 | 13F | ProShare Advisors LLC | 10.048 | 56 | ||||||
| 2026-02-17 | 13F | Gratia Capital, Llc | 1.496.494 | 80,59 | 8.395 | 114,65 | ||||
| 2026-03-06 | 13F | Hsbc Holdings Plc | 127.071 | 719 | ||||||
| 2026-02-11 | 13F | Jpmorgan Chase & Co | 21.975 | -0,78 | 123 | 18,27 | ||||
| 2026-02-11 | 13F | Los Angeles Capital Management Llc | 178.251 | 92,28 | 941 | 115,33 | ||||
| 2026-01-30 | 13F | Levin Capital Strategies, L.p. | 3.666.323 | 0,13 | 20.568 | 19,01 | ||||
| 2026-02-12 | 13F | Hrt Financial Lp | 559.400 | 3 | ||||||
| 2026-02-11 | 13F | Parallel Advisors, LLC | 22 | 0,00 | 0 | |||||
| 2026-02-11 | 13F | Deutsche Bank Ag\ | 39.927 | 4.890,88 | 224 | 7.333,33 | ||||
| 2026-02-10 | 13F | Intech Investment Management Llc | 37.429 | 40,58 | 210 | 67,20 | ||||
| 2026-02-03 | 13F | B. Riley Financial, Inc. | 0 | -100,00 | 0 | -100,00 | ||||
| 2025-11-14 | 13F | Nokomis Capital, L.L.C. | 0 | -100,00 | 0 | |||||
| 2026-02-11 | 13F | Simplex Trading, Llc | 135.949 | -44,76 | 763 | 76.100,00 | ||||
| 2026-02-11 | 13F | Simplex Trading, Llc | Call | 89.300 | 247,47 | 501 | ||||
| 2026-02-10 | 13F | Axq Capital, Lp | 13.558 | 76 | ||||||
| 2026-04-13 | 13F | Loring Wolcott & Coolidge Fiduciary Advisors Llp/ma | 5.000 | 0,00 | 25 | -25,00 | ||||
| 2026-02-11 | 13F | Simplex Trading, Llc | Put | 31.300 | 31.200,00 | 176 | ||||
| 2026-02-13 | 13F | Diametric Capital, LP | 109.480 | -25,57 | 614 | -11,53 | ||||
| 2026-02-09 | 13F | Legal & General Group Plc | 5.661 | -7,61 | 32 | 10,71 | ||||
| 2026-04-13 | 13F | IFP Advisors, Inc | 430 | 21.400,00 | 2 | |||||
| 2026-02-11 | 13F | Group One Trading, L.p. | 0 | -100,00 | 0 | -100,00 | ||||
| 2026-01-30 | 13F | Delta Investment Management, LLC | 146.181 | -5,50 | 820 | 12,33 | ||||
| 2026-02-17 | 13F | Brevan Howard Capital Management LP | 197.905 | 1.110 | ||||||
| 2026-02-17 | 13F | Optiver Holding B.V. | 2.714 | 196,94 | 15 | 275,00 | ||||
| 2026-02-11 | 13F | Franklin Resources Inc | 19.087 | 0,70 | 107 | 20,22 | ||||
| 2026-02-17 | 13F | Massar Capital Management, LP | 225.612 | 1.266 | ||||||
| 2026-02-12 | 13F | Jane Street Group, Llc | 570.895 | 354,20 | 3.203 | 439,97 | ||||
| 2026-02-12 | 13F | Voya Investment Management Llc | 10.850 | 0,00 | 61 | 17,65 | ||||
| 2026-02-17 | 13F | Elkhorn Partners Limited Partnership | 652.000 | -4,57 | 3.658 | 13,43 | ||||
| 2026-02-12 | 13F | State Board Of Administration Of Florida Retirement System | 28.430 | 0,00 | 159 | 18,66 | ||||
| 2026-04-15 | 13F | FNY Investment Advisers, LLC | 0 | -100,00 | 0 | |||||
| 2026-04-22 | 13F | Mindset Wealth Management, Llc | 40.000 | 5,26 | 196 | -7,98 | ||||
| 2026-02-23 | 13F | Virtu Financial LLC | 10.247 | 0 | ||||||
| 2026-01-30 | 13F | Us Bancorp \de\ | 358 | -81,90 | 2 | -77,78 | ||||
| 2026-02-17 | 13F | Sherbrooke Park Advisers Llc | 0 | -100,00 | 0 | |||||
| 2025-11-13 | 13F | Renaissance Technologies Llc | 0 | -100,00 | 0 | |||||
| 2026-02-17 | 13F | PharVision Advisers, LLC | 0 | -100,00 | 0 | -100,00 | ||||
| 2026-02-12 | 13F | Wealthspire Advisors, LLC | 35.340 | 175,23 | 198 | 230,00 | ||||
| 2026-02-19 | 13F | Invesco Ltd. | 24.673 | 30,97 | 138 | 56,82 | ||||
| 2026-02-17 | 13F | Raymond James Financial Inc | 192.487 | 6,39 | 1.080 | 26,49 | ||||
| 2026-02-17 | 13F | Advisor Group Holdings, Inc. | 900 | -42,86 | 5 | 0,00 | ||||
| 2026-02-17 | 13F | Russell Investments Group, Ltd. | 73.659 | -17,07 | 413 | -1,43 | ||||
| 2026-03-09 | 13F | Flax Pond Capital, Llc | 53.815 | 302 | ||||||
| 2026-01-22 | 13F | Brookwood Investment Group LLC | 21.000 | 0,00 | 118 | 18,18 | ||||
| 2026-02-12 | 13F | New York State Common Retirement Fund | 1.042 | 0,00 | 6 | 25,00 | ||||
| 2026-03-12 | 13F/A | Peak6 Llc | 169.833 | 953 | ||||||
| 2026-02-17 | 13F | Ancora Advisors, LLC | 48.800 | 0,00 | 274 | 18,70 | ||||
| 2026-02-13 | 13F | Manufacturers Life Insurance Company, The | 0 | -100,00 | 0 | |||||
| 2025-11-12 | 13F | Neuberger Berman Group LLC | 0 | -100,00 | 0 | |||||
| 2026-01-29 | 13F | UBS Group AG | 168.810 | -14,11 | 947 | 2,16 | ||||
| 2026-02-17 | 13F | MIRAE ASSET GLOBAL ETFS HOLDINGS Ltd. | 25.554 | -1,15 | 143 | 17,21 | ||||
| 2026-02-17 | 13F | Stonehill Capital Management Llc | 331.305 | 2 | ||||||
| 2026-02-11 | 13F | LPL Financial LLC | 10.050 | 56 | ||||||
| 2026-02-10 | 13F | Lido Advisors, LLC | 37.081 | 0,00 | 193 | 9,71 | ||||
| 2026-01-15 | 13F | Nisa Investment Advisors, Llc | 11.264 | 0,00 | 63 | 18,87 | ||||
| 2026-04-22 | 13F | Sterling Capital Management LLC | 357 | 0,00 | 2 | -50,00 | ||||
| 2026-02-17 | 13F | Bridgeway Capital Management Inc | 77.568 | 0,00 | 435 | 18,85 | ||||
| 2026-02-13 | 13F | SRS Capital Advisors, Inc. | 8 | -99,72 | 0 | -100,00 | ||||
| 2026-02-13 | 13F | Ingalls & Snyder Llc | 98.600 | 0,00 | 1 | |||||
| 2026-02-05 | 13F | 1620 Investment Advisors, Inc. | 0 | -100,00 | 0 | |||||
| 2026-02-11 | 13F | Ameritas Investment Partners, Inc. | 3.349 | 19 | ||||||
| 2026-02-13 | 13F | Verition Fund Management LLC | 45.210 | -24,66 | 254 | -10,60 | ||||
| 2026-02-03 | 13F | SBI Securities Co., Ltd. | 0 | -100,00 | 0 | |||||
| 2026-02-13 | 13F | Marshall Wace, Llp | 0 | -100,00 | 0 | |||||
| 2026-04-13 | 13F | True Wealth Design, LLC | 44 | 175,00 | 0 | |||||
| 2026-02-12 | 13F | BlackRock, Inc. | 3.828.327 | 6,14 | 21.477 | 26,15 | ||||
| 2026-02-17 | 13F | GAM Holding AG | 230.000 | -53,08 | 1.290 | -44,23 | ||||
| 2026-02-09 | 13F | Geode Capital Management, Llc | 1.325.245 | 1,31 | 7.437 | 20,42 | ||||
| 2026-01-26 | 13F | Cwm, Llc | 1.462 | 47,53 | 0 | |||||
| 2026-02-17 | 13F | State Of Wisconsin Investment Board | 212.117 | 81,96 | 1.190 | 116,18 | ||||
| 2026-04-21 | 13F | HCR Wealth Advisors | 138.000 | 69,46 | 678 | 48,46 | ||||
| 2026-02-13 | 13F | Rhumbline Advisers | 88.427 | -1,60 | 496 | 16,98 | ||||
| 2026-02-17 | 13F | Crawford Fund Management, LLC | Put | 99.300 | 557 | |||||
| 2026-02-10 | 13F | Goldman Sachs Group Inc | 357.572 | 135,28 | 2.006 | 179,64 | ||||
| 2026-01-07 | 13F | Permanent Capital Management, LP | 496.519 | 0,00 | 2.785 | 18,86 | ||||
| 2026-02-13 | 13F | Police & Firemen's Retirement System of New Jersey | 17.959 | 71,36 | 101 | 104,08 | ||||
| 2026-02-17 | 13F | Boothbay Fund Management, Llc | 0 | -100,00 | 0 | |||||
| 2025-11-04 | 13F | American Assets Capital Advisers, LLC | 601.113 | -38,63 | 2.837 | -3,11 | ||||
| 2026-02-17 | 13F | Bank Of America Corp /de/ | 3.518.821 | 0,79 | 19.741 | 19,80 | ||||
| 2026-02-17 | 13F | Royal Bank Of Canada | 2.407 | -99,13 | 13 | -99,01 | ||||
| 2026-02-17 | 13F | Cinctive Capital Management LP | 193.002 | 85,77 | 1.083 | 120,82 | ||||
| 2026-02-17 | 13F | Prelude Capital Management, Llc | 17.528 | -56,93 | 98 | -48,96 | ||||
| 2026-02-17 | 13F | Credit Agricole S A | 0 | -100,00 | 0 | -100,00 | ||||
| 2026-02-17 | 13F | Price T Rowe Associates Inc /md/ | 75.920 | 9,60 | 0 | |||||
| 2026-02-13 | 13F | Citigroup Inc | 66.687 | 2.564,28 | 374 | 3.300,00 | ||||
| 2026-02-12 | 13F | Nuveen, LLC | 302.482 | 35,98 | 1.697 | 61,68 | ||||
| 2026-02-13 | 13F | Charles Schwab Investment Management Inc | 161.235 | 0,01 | 905 | 18,95 | ||||
| 2026-02-10 | 13F | Bank of New York Mellon Corp | 198.442 | 8,35 | 1.113 | 28,82 | ||||
| 2026-02-17 | 13F | Aqr Capital Management Llc | 38.235 | 33,68 | 214 | 59,70 | ||||
| 2026-02-12 | 13F | Financial Engines Advisors L.L.C. | 0 | -100,00 | 0 | |||||
| 2026-04-23 | 13F | SJS Investment Consulting Inc. | 15 | 0 | ||||||
| 2026-02-13 | 13F | Morgan Stanley | 1.270.970 | 65,21 | 7.130 | 96,36 | ||||
| 2026-02-17 | 13F | Susquehanna International Group, Llp | Put | 66.500 | 415,50 | 373 | 521,67 | |||
| 2026-02-17 | 13F | Susquehanna International Group, Llp | Call | 955.000 | 230,91 | 5.358 | 293,32 | |||
| 2026-02-17 | 13F | Susquehanna International Group, Llp | 141.223 | -68,89 | 792 | -63,03 | ||||
| 2026-02-06 | 13F | EverSource Wealth Advisors, LLC | 79 | 0,00 | 0 | |||||
| 2026-01-29 | 13F | Vanguard Group Inc | 3.063.430 | 0,91 | 17.186 | 19,93 | ||||
| 2026-02-17 | 13F | Rangeley Capital, LLC | 249.000 | -51,74 | 1.397 | -42,67 | ||||
| 2026-04-21 | 13F | Morton Capital Management LLC/CA | 24.887 | 49,25 | 122 | 31,18 | ||||
| 2026-04-08 | 13F | Wealth Enhancement Advisory Services, Llc | 11.573 | 57 | ||||||
| 2026-02-17 | 13F/A | Cantor Fitzgerald, L. P. | 0 | -100,00 | 0 | -100,00 | ||||
| 2026-01-29 | 13F | IMC-Chicago, LLC | Call | 99.700 | 559 | |||||
| 2026-02-17 | 13F | Caption Management, LLC | 262.345 | 67,09 | 1.472 | 98,52 | ||||
| 2026-02-17 | 13F | Whitefort Capital Management, LP | 0 | -100,00 | 0 | |||||
| 2026-02-17 | 13F | Caption Management, LLC | Call | 225.000 | 0,00 | 1.262 | 18,83 | |||
| 2026-02-13 | 13F | Evelyn Partners Investment Management LLP | 1.366 | 0,00 | 8 | 16,67 | ||||
| 2026-02-11 | 13F | Group One Trading, L.p. | Call | 335.100 | 11.455,17 | 1.880 | 14.353,85 | |||
| 2026-02-11 | 13F | Group One Trading, L.p. | Put | 28.300 | 28.200,00 | 159 | ||||
| 2026-02-17 | 13F | Alliancebernstein L.p. | 88.590 | 11,73 | 497 | 32,62 | ||||
| 2026-02-13 | 13F | Wells Fargo & Company/mn | 60.140 | 68,44 | 337 | 100,60 | ||||
| 2026-02-17 | 13F | Citadel Advisors Llc | 89.295 | -63,12 | 501 | -56,22 | ||||
| 2026-02-17 | 13F | Citadel Advisors Llc | Call | 33.700 | 55,30 | 189 | 85,29 | |||
| 2026-02-10 | 13F/A | Northwestern Mutual Wealth Management Co | 650 | 4 | ||||||
| 2026-02-17 | 13F | Fmr Llc | 16.467 | 134,04 | 92 | 178,79 | ||||
| 2026-02-12 | 13F | Quadrant Capital Group Llc | 474 | 3 | ||||||
| 2026-02-05 | 13F | Amalgamated Bank | 1.727 | 26,34 | 0 | |||||
| 2026-02-13 | 13F | State Street Corp | 1.270.020 | 2,42 | 7.125 | 21,74 | ||||
| 2026-02-13 | 13F | Barclays Plc | 3.185.700 | -3,13 | 17.872 | 15,13 | ||||
| 2026-02-13 | 13F | Ubs Asset Management Americas Inc | 398 | 2 | ||||||
| 2026-02-13 | 13F | Barclays Plc | Call | 700.000 | 0,00 | 3.927 | 18,86 | |||
| 2026-04-24 | 13F | CHICAGO TRUST Co NA | 0 | -100,00 | 0 | |||||
| 2026-02-05 | 13F | Gabelli Funds Llc | 10.000 | 0,00 | 56 | 19,15 | ||||
| 2026-02-17 | 13F | Equitec Proprietary Markets, Llc | 0 | -100,00 | 0 | |||||
| 2026-02-13 | 13F | Quarry LP | 0 | -100,00 | 0 | |||||
| 2026-02-02 | 13F | Breakwater Investment Management | 96 | 1 | ||||||
| 2026-02-17 | 13F | Dba Trading, Llc | 138.040 | 774 | ||||||
| 2026-02-06 | 13F | Pnc Financial Services Group, Inc. | 6.785 | 0,07 | 38 | 18,75 | ||||
| 2026-02-17 | 13F | Citadel Advisors Llc | Put | 54.500 | 303,70 | 306 | 384,13 | |||
| 2026-02-12 | 13F | Great Lakes Advisors, Llc | 14.065 | 79 | ||||||
| 2026-02-10 | 13F | Rothschild Investment Llc | 9 | 0 | ||||||
| 2026-04-22 | 13F | Matauro, Llc | 143.088 | 33,17 | 703 | 16,61 | ||||
| 2026-02-12 | 13F | MetLife Investment Management, LLC | 21.718 | -29,57 | 122 | -16,55 | ||||
| 2025-11-14 | 13F | Capstone Investment Advisors, Llc | 437.038 | 0,00 | 2.063 | 57,89 | ||||
| 2026-04-15 | 13F | Exchange Traded Concepts, Llc | 4.696 | 23 | ||||||
| 2026-02-17 | 13F | Gratia Capital, Llc | Call | 0 | -100,00 | 0 | ||||
| 2026-02-11 | 13F | Potomac Capital Management, Inc. | 335.000 | 1.879 | ||||||
| 2026-02-17 | 13F | Mirabella Financial Services Llp | 0 | -100,00 | 0 | |||||
| 2026-02-06 | 13F/A | Rathbone Brothers plc | 34.858 | 0,00 | 196 | 18,90 | ||||
| 2026-01-22 | 13F | LDR Capital Management LLC | 0 | -100,00 | 0 | |||||
| 2025-11-14 | 13F | Wolverine Trading, Llc | Put | 0 | -100,00 | 0 | -100,00 | |||
| 2026-02-09 | 13F | Parkshore Wealth Management, Inc. | 255.618 | 0,00 | 1.434 | 18,91 | ||||
| 2026-02-10 | 13F | Close Asset Management Ltd | 1.000 | 0,00 | 0 | |||||
| 2026-02-17 | 13F | FourWorld Capital Management LLC | 28.184 | -12,04 | 158 | 4,64 |