Grundlæggende statistik
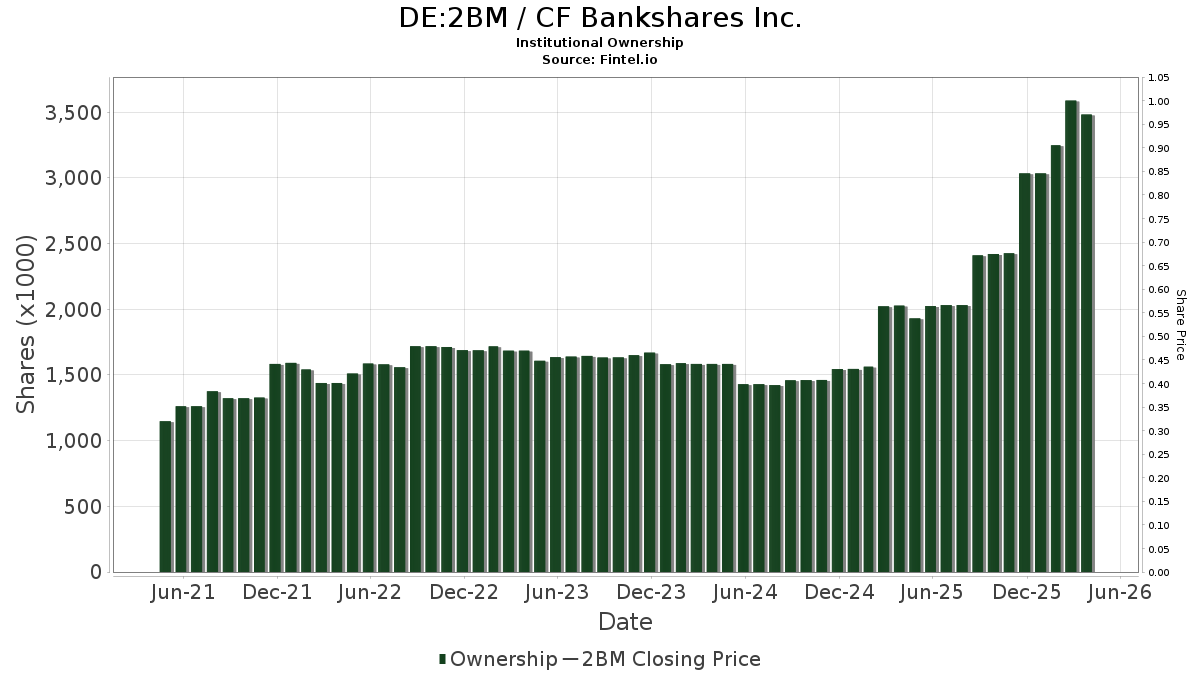
| Institutionelle aktier (lange) | 3.480.532 - 54,10% (ex 13D/G) - change of 0,28MM shares 8,61% MRQ |
| Institutionel værdi (lang) | $ 85.549 USD ($1000) |
Institutionelt ejerskab og aktionærer
CF Bankshares Inc. (DE:2BM) har 82 institutionelle ejere og aktionærer, der har indsendt 13D/G- eller 13F-formularer til Securities Exchange Commission (SEC). Disse institutioner har i alt 3,480,532 aktier. Største aktionærer omfatter Fourthstone LLC, Alliancebernstein L.p., BlackRock, Inc., Vanguard Group Inc, First Manhattan Co, Graham Capital Wealth Management, Llc, Daytona Street Capital LLC, Fifth Third Bancorp, Geode Capital Management, Llc, and Renaissance Technologies Llc .
CF Bankshares Inc. (DB:2BM) institutionel ejerskabsstruktur viser aktuelle positioner i virksomheden efter institutioner og fonde, samt seneste ændringer i positionsstørrelse. Større aktionærer kan omfatte individuelle investorer, investeringsforeninger, hedgefonde eller institutioner. Skema 13D angiver, at investoren besidder (eller besidder) mere end 5 % af virksomheden og har til hensigt (eller har til hensigt at) aktivt at forfølge en ændring i forretningsstrategi. Skema 13G indikerer en passiv investering på over 5%.
Fondens stemningsscore
Fund Sentiment Score (fka Ownership Accumulation Score) finder de aktier, der bliver mest købt af fonde. Det er resultatet af en sofistikeret, multi-faktor kvantitativ model, der identificerer virksomheder med de højeste niveauer af institutionel akkumulering. Scoringsmodellen bruger en kombination af den samlede stigning i oplyste ejere, ændringerne i porteføljeallokeringer i disse ejere og andre målinger. Tallet går fra 0 til 100, hvor højere tal indikerer et højere niveau af akkumulering for sine jævnaldrende, og 50 er gennemsnittet.
Opdateringsfrekvens: Dagligt
Se Ownership Explorer, som giver en liste over højest rangerende virksomheder.
AI+ Ask Fintel’s AI assistant about CF Bankshares Inc..
Select a question to share a public post with an AI-crafted answer.
Thinking of good questions…
13F og NPORT arkivering
Detaljer om 13F-arkivering er gratis. Detaljer om NP-ansøgninger kræver et premium-medlemskab. Grønne rækker angiver nye positioner. Røde rækker angiver lukkede positioner. Klik på linket ikon for at se den fulde transaktionshistorik.
Opgrader
for at låse premium-data op og eksportere til Excel ![]() .
.
| Fil dato | Kilde | Investor | Type | Gennemsnitlig pris (Øst) |
Aktier | Δ Aktier (%) |
Rapporteret Værdi ($1000) |
Δ Værdi (%) |
Port Alloc (%) |
|
|---|---|---|---|---|---|---|---|---|---|---|
| 2026-01-21 | 13F | Graham Capital Wealth Management, Llc | 152.885 | 6,62 | 3.814 | 11,07 | ||||
| 2026-02-17 | 13F | Jump Financial, LLC | 14.000 | 349 | ||||||
| 2026-04-20 | 13F | State of Alaska, Department of Revenue | 414 | 0,00 | 0 | |||||
| 2026-02-02 | 13F | Fifth Third Bancorp | 114.914 | 0,00 | 2.867 | 4,18 | ||||
| 2025-11-13 | 13F | Deutsche Bank Ag\ | 0 | -100,00 | 0 | |||||
| 2026-02-09 | 13F | Geode Capital Management, Llc | 99.447 | 14,27 | 2.481 | 19,05 | ||||
| 2026-02-12 | 13F | New York State Common Retirement Fund | 3.200 | 0,00 | 80 | 3,95 | ||||
| 2026-04-24 | 13F | Strs Ohio | 19.000 | -14,41 | 530 | -4,16 | ||||
| 2026-02-06 | 13F | Covestor Ltd | 21 | 50,00 | 0 | |||||
| 2026-02-17 | 13F | California State Teachers Retirement System | 287 | 19,09 | 7 | 40,00 | ||||
| 2026-02-09 | 13F | Legal & General Group Plc | 344 | 0,00 | 9 | 0,00 | ||||
| 2026-02-13 | 13F | Marshall Wace, Llp | 13.054 | 326 | ||||||
| 2026-02-13 | 13F | American Century Companies Inc | 14.677 | 366 | ||||||
| 2026-02-10 | 13F | Rothschild Investment Llc | 14 | 366,67 | 0 | |||||
| 2026-02-17 | 13F | Advisor Group Holdings, Inc. | 1.467 | 0,00 | 37 | 2,86 | ||||
| 2026-02-11 | 13F | Ameritas Investment Partners, Inc. | 392 | 10 | ||||||
| 2026-02-17 | 13F | United Capital Financial Advisers, Llc | 10.532 | -24,87 | 263 | -21,79 | ||||
| 2026-02-17 | 13F | Citadel Advisors Llc | 34.673 | 39,32 | 865 | 45,13 | ||||
| 2026-02-10 | 13F | Acadian Asset Management Llc | 59.859 | 61,74 | 1 | |||||
| 2026-02-17 | 13F | Man Group plc | 9.494 | 237 | ||||||
| 2026-04-17 | 13F | Krilogy Financial LLC | 15.709 | -0,15 | 449 | -0,88 | ||||
| 2026-02-05 | 13F | Allworth Financial LP | 32 | 6,67 | 1 | |||||
| 2026-04-06 | 13F | GAMMA Investing LLC | 50 | 42,86 | 1 | |||||
| 2026-04-10 | 13F | Daytona Street Capital LLC | 151.386 | 0,66 | 4.277 | 13,99 | ||||
| 2026-02-17 | 13F | Northern Trust Corp | 48.703 | -0,61 | 1.215 | 3,58 | ||||
| 2026-04-09 | 13F | Everhart Financial Group, Inc. | 9.090 | 0,00 | 254 | 11,95 | ||||
| 2026-02-09 | 13F | Harbour Investments, Inc. | 0 | -100,00 | 0 | |||||
| 2026-02-13 | 13F | Segall Bryant & Hamill, Llc | 0 | -100,00 | 0 | |||||
| 2026-04-22 | 13F | Sterling Capital Management LLC | 170 | -35,85 | 5 | -33,33 | ||||
| 2026-02-05 | 13F | Amalgamated Bank | 147 | 12,21 | 0 | |||||
| 2026-02-06 | 13F | EverSource Wealth Advisors, LLC | 54 | 80,00 | 1 | |||||
| 2026-02-12 | 13F | Renaissance Technologies Llc | 86.079 | 54,60 | 2.148 | 61,07 | ||||
| 2026-02-13 | 13F | De Lisle Partners LLP | 41.276 | -19,85 | 1.029 | -16,61 | ||||
| 2026-01-29 | 13F | Vanguard Group Inc | 252.432 | 22,37 | 6.298 | 27,49 | ||||
| 2026-02-13 | 13F | Panagora Asset Management Inc | 9.093 | 227 | ||||||
| 2026-04-13 | 13F | True Wealth Design, LLC | 7 | 0,00 | 0 | |||||
| 2026-02-10 | 13F | Bank of New York Mellon Corp | 14.151 | 41,03 | 353 | 47,08 | ||||
| 2026-02-17 | 13F | Millennium Management Llc | 18.005 | -6,34 | 449 | -2,39 | ||||
| 2026-02-19 | 13F | CI Private Wealth, LLC | 9.391 | -20,52 | 234 | -17,02 | ||||
| 2026-02-17 | 13F | First Manhattan Co | 187.022 | 5,65 | 4.666 | 10,07 | ||||
| 2026-02-17 | 13F | MIRAE ASSET GLOBAL ETFS HOLDINGS Ltd. | 2.150 | 16,59 | 54 | 20,45 | ||||
| 2026-02-10 | 13F | Goldman Sachs Group Inc | 47.685 | 9,46 | 1.190 | 14,00 | ||||
| 2026-02-17 | 13F | Trexquant Investment LP | 14.302 | 357 | ||||||
| 2026-02-06 | 13F | Pnc Financial Services Group, Inc. | 770 | 2,26 | 19 | 5,56 | ||||
| 2026-02-13 | 13F | Kestra Advisory Services, LLC | 3.636 | 91 | ||||||
| 2026-02-13 | 13F | Charles Schwab Investment Management Inc | 14.025 | 16,42 | 350 | 21,18 | ||||
| 2026-02-13 | 13F | Wells Fargo & Company/mn | 8.762 | 28,46 | 219 | 33,74 | ||||
| 2026-02-13 | 13F | Rhumbline Advisers | 5.130 | -13,39 | 128 | -9,93 | ||||
| 2026-02-17 | 13F | Tower Research Capital LLC (TRC) | 1.048 | -38,57 | 26 | -35,00 | ||||
| 2025-11-14 | 13F | Susquehanna International Group, Llp | 0 | -100,00 | 0 | |||||
| 2026-02-12 | 13F | BlackRock, Inc. | 345.189 | 40,30 | 8.612 | 46,16 | ||||
| 2026-02-13 | 13F | Police & Firemen's Retirement System of New Jersey | 1.428 | 0,00 | 36 | 2,94 | ||||
| 2026-02-13 | 13F | State Street Corp | 50.723 | 10,34 | 1.266 | 15,00 | ||||
| 2026-02-17 | 13F | Royal Bank Of Canada | 423 | 33,86 | 11 | 37,50 | ||||
| 2025-11-06 | 13F | Truffle Hound Capital, LLC | 0 | -100,00 | 0 | |||||
| 2026-01-26 | 13F | Cwm, Llc | 1.443 | 20,96 | 0 | |||||
| 2026-02-17 | 13F | Aqr Capital Management Llc | 25.892 | 62,72 | 646 | 69,55 | ||||
| 2026-02-10 | 13F | Hillsdale Investment Management Inc. | 0 | -100,00 | 0 | |||||
| 2026-02-10 | 13F | Bnp Paribas Arbitrage, Sa | 2.679 | 8,59 | 67 | 11,86 | ||||
| 2026-02-13 | 13F | Morgan Stanley | 25.553 | 32,90 | 638 | 38,48 | ||||
| 2026-02-02 | 13F | Mcdonald Partners Llc | 59.427 | -7,36 | 1.483 | -3,52 | ||||
| 2026-02-05 | 13F | Cambridge Investment Research Advisors, Inc. | 14.133 | 0 | ||||||
| 2026-02-09 | 13F | Hartland & Co., LLC | 0 | -100,00 | 0 | |||||
| 2026-02-13 | 13F | Barclays Plc | 36.875 | 41,12 | 920 | 47,20 | ||||
| 2026-04-13 | 13F | IFP Advisors, Inc | 44 | 0,00 | 1 | 0,00 | ||||
| 2026-04-07 | 13F | Farther Finance Advisors, LLC | 33 | 0,00 | 1 | |||||
| 2026-02-12 | 13F | Dimensional Fund Advisors Lp | 62.077 | 35,78 | 1.549 | 41,37 | ||||
| 2026-02-17 | 13F | Bank Of America Corp /de/ | 9.252 | 172,28 | 231 | 183,95 | ||||
| 2026-02-17 | 13F | Russell Investments Group, Ltd. | 948 | -20,67 | 24 | -17,86 | ||||
| 2026-01-27 | 13F | Aspiring Ventures, LLC | 9.850 | -30,14 | 246 | -27,30 | ||||
| 2026-01-27 | 13F | Retirement Income Solutions, Inc | 11.843 | 0,00 | 295 | 4,24 | ||||
| 2026-02-17 | 13F | Fmr Llc | 323 | -14,10 | 8 | 0,00 | ||||
| 2026-02-20 | 13F | Sunbelt Securities, Inc. | 3 | 0 | ||||||
| 2026-02-17 | 13F | Bridgeway Capital Management Inc | 35.671 | 11,37 | 890 | 15,91 | ||||
| 2026-02-13 | 13F | MAI Capital Management | 5 | 0 | ||||||
| 2026-02-17 | 13F | Quadrature Capital Ltd | 31.548 | 45,26 | 787 | 51,06 | ||||
| 2026-02-02 | 13F | Salzhauer Michael | 26.764 | 0,00 | 668 | 4,22 | ||||
| 2026-02-12 | 13F | Jane Street Group, Llc | 0 | -100,00 | 0 | |||||
| 2026-02-12 | 13F | Integrated Quantitative Investments LLC | 13.499 | 337 | ||||||
| 2026-02-13 | 13F | Fourthstone LLC | 634.535 | 6,42 | 15.832 | 10,86 | ||||
| 2026-03-06 | 13F | Hsbc Holdings Plc | 35.916 | 72,92 | 896 | 79,20 | ||||
| 2026-04-23 | 13F | SJS Investment Consulting Inc. | 6 | 20,00 | 0 | |||||
| 2026-02-13 | 13F | Prudential Financial Inc | 10.280 | 256 | ||||||
| 2026-02-11 | 13F | Jpmorgan Chase & Co | 2.044 | -7,64 | 51 | -5,66 | ||||
| 2026-02-13 | 13F | Citigroup Inc | 107 | 132,61 | 3 | 100,00 | ||||
| 2026-04-24 | 13F | Root Financial Partners, LLC | 15 | 0 | ||||||
| 2026-02-18 | 13F | GWM Advisors LLC | 11.811 | -11,76 | 295 | -8,12 | ||||
| 2026-01-29 | 13F | UBS Group AG | 2.531 | -32,79 | 63 | -30,00 | ||||
| 2026-02-17 | 13F | Alliancebernstein L.p. | 509.667 | 10,25 | 12.716 | 14,86 | ||||
| 2026-02-13 | 13F | Arrowstreet Capital, Limited Partnership | 19.016 | 474 | ||||||
| 2026-02-13 | 13F | SRS Capital Advisors, Inc. | 0 | -100,00 | 0 |
Other Listings
| US:CFBK | 29,41 $ |