Grundlæggende statistik
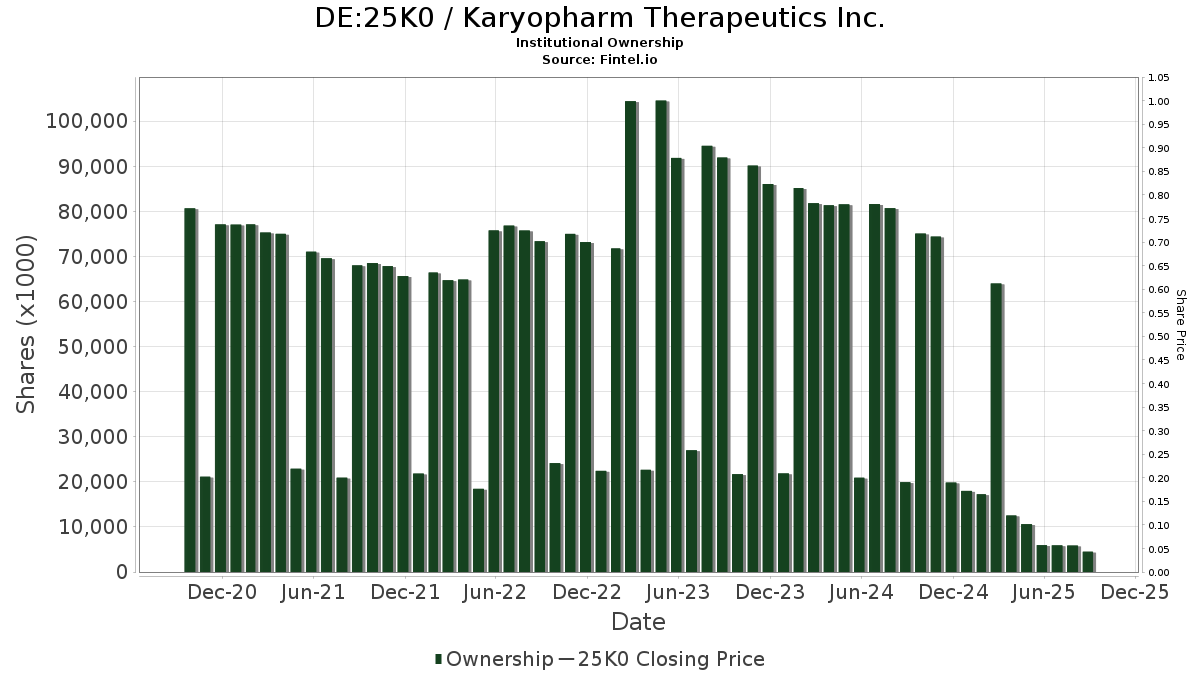
| Institutionelle aktier (lange) | 9.361.231 - 41,53% (ex 13D/G) - change of 5,96MM shares 175,29% MRQ |
| Institutionel værdi (lang) | $ 56.942 USD ($1000) |
Institutionelt ejerskab og aktionærer
Karyopharm Therapeutics Inc. (DE:25K0) har 69 institutionelle ejere og aktionærer, der har indsendt 13D/G- eller 13F-formularer til Securities Exchange Commission (SEC). Disse institutioner har i alt 9,361,231 aktier. Største aktionærer omfatter T. Rowe Price Investment Management, Inc., Opaleye Management Inc., Affinity Asset Advisors, LLC, Vanguard Group Inc, Ikarian Capital, LLC, Soleus Capital Management, L.P., Adage Capital Partners Gp, L.l.c., Susquehanna International Group, Llp, Susquehanna International Group, Llp, and Davidson Kempner Capital Management Lp .
Karyopharm Therapeutics Inc. (DB:25K0) institutionel ejerskabsstruktur viser aktuelle positioner i virksomheden efter institutioner og fonde, samt seneste ændringer i positionsstørrelse. Større aktionærer kan omfatte individuelle investorer, investeringsforeninger, hedgefonde eller institutioner. Skema 13D angiver, at investoren besidder (eller besidder) mere end 5 % af virksomheden og har til hensigt (eller har til hensigt at) aktivt at forfølge en ændring i forretningsstrategi. Skema 13G indikerer en passiv investering på over 5%.
The share price as of April 27, 2026 is 7,35 / share. Previously, on April 30, 2025, the share price was 5,25 / share. This represents an increase of 40,00% over that period.
Fondens stemningsscore
Fund Sentiment Score (fka Ownership Accumulation Score) finder de aktier, der bliver mest købt af fonde. Det er resultatet af en sofistikeret, multi-faktor kvantitativ model, der identificerer virksomheder med de højeste niveauer af institutionel akkumulering. Scoringsmodellen bruger en kombination af den samlede stigning i oplyste ejere, ændringerne i porteføljeallokeringer i disse ejere og andre målinger. Tallet går fra 0 til 100, hvor højere tal indikerer et højere niveau af akkumulering for sine jævnaldrende, og 50 er gennemsnittet.
Opdateringsfrekvens: Dagligt
Se Ownership Explorer, som giver en liste over højest rangerende virksomheder.
AI+ Ask Fintel’s AI assistant about Karyopharm Therapeutics Inc..
Select a question to share a public post with an AI-crafted answer.
Thinking of good questions…
13F og NPORT arkivering
Detaljer om 13F-arkivering er gratis. Detaljer om NP-ansøgninger kræver et premium-medlemskab. Grønne rækker angiver nye positioner. Røde rækker angiver lukkede positioner. Klik på linket ikon for at se den fulde transaktionshistorik.
Opgrader
for at låse premium-data op og eksportere til Excel ![]() .
.
| Fil dato | Kilde | Investor | Type | Gennemsnitlig pris (Øst) |
Aktier | Δ Aktier (%) |
Rapporteret Værdi ($1000) |
Δ Værdi (%) |
Port Alloc (%) |
|
|---|---|---|---|---|---|---|---|---|---|---|
| 2026-02-05 | 13F | Allworth Financial LP | 26 | 0,00 | 0 | |||||
| 2026-02-19 | 13F/A | T. Rowe Price Investment Management, Inc. | 1.491.409 | 112,76 | 11 | 150,00 | ||||
| 2026-02-13 | 13F | Baird Financial Group, Inc. | 27.993 | 7,95 | 206 | 21,89 | ||||
| 2026-02-19 | 13F | CI Private Wealth, LLC | 10.039 | 10 | ||||||
| 2026-02-17 | 13F | Tudor Investment Corp Et Al | 12.922 | 95 | ||||||
| 2026-02-11 | 13F | Group One Trading, L.p. | 102.419 | 49,66 | 754 | 68,46 | ||||
| 2026-02-13 | 13F | Affinity Asset Advisors, LLC | Call | 0 | -100,00 | 0 | -100,00 | |||
| 2026-02-12 | 13F | CIBC Private Wealth Group, LLC | 3 | 0,00 | 0 | |||||
| 2026-01-29 | 13F | UBS Group AG | 88.455 | 48,20 | 651 | 66,92 | ||||
| 2025-11-14 | 13F | Millennium Management Llc | 0 | -100,00 | 0 | -100,00 | ||||
| 2026-02-17 | 13F | Advisor Group Holdings, Inc. | 282 | -18,50 | 2 | 0,00 | ||||
| 2026-02-17 | 13F | Boxer Capital Management, LLC | 252.536 | 1.859 | ||||||
| 2026-01-29 | 13F | Vanguard Group Inc | 559.619 | 37,09 | 4.119 | 54,29 | ||||
| 2026-04-13 | 13F/A | Opaleye Management Inc. | 930.000 | 6.845 | ||||||
| 2026-02-10 | 13F | Belvedere Trading LLC | Call | 12.300 | 91 | |||||
| 2026-02-17 | 13F | Silverback Asset Management Llc | 40.000 | 0,00 | 294 | 12,64 | ||||
| 2026-02-17 | 13F | Catalio Capital Management, LP | 142.984 | 0,00 | 1.052 | 12,51 | ||||
| 2025-11-14 | 13F | Eversept Partners, LP | 0 | -100,00 | 0 | |||||
| 2026-02-13 | 13F | Barclays Plc | 4.109 | 0,00 | 30 | 15,38 | ||||
| 2026-02-12 | 13F | BlackRock, Inc. | 247.558 | 6,73 | 1.822 | 20,18 | ||||
| 2026-02-17 | 13F | Ikarian Capital, LLC | 544.554 | 1.897,85 | 4.008 | 2.151,12 | ||||
| 2026-02-17 | 13F | Bank Of America Corp /de/ | 48.088 | 51.057,45 | 354 | |||||
| 2026-02-13 | 13F | State Street Corp | 58.942 | 27,19 | 434 | 42,90 | ||||
| 2026-02-02 | 13F | Pittenger & Anderson Inc | 0 | -100,00 | 0 | |||||
| 2026-02-13 | 13F | Avidity Partners Management LP | 0 | -100,00 | 0 | |||||
| 2026-02-17 | 13F | Braidwell Lp | 303.370 | 2.233 | ||||||
| 2026-02-18 | 13F/A | ADAR1 Capital Management, LLC | 50.000 | 100,00 | 368 | 125,77 | ||||
| 2026-02-17 | 13F | Price T Rowe Associates Inc /md/ | 10.886 | 0,00 | 0 | |||||
| 2026-02-17 | 13F | Advisory Services Network, LLC | 0 | -100,00 | 0 | |||||
| 2026-02-17 | 13F | Ameriprise Financial Inc | 276.881 | 2.038 | ||||||
| 2026-04-02 | 13F | Aspect Partners, LLC | 0 | -100,00 | 0 | |||||
| 2026-02-12 | 13F | Jane Street Group, Llc | Call | 20.100 | 55,81 | 148 | 75,00 | |||
| 2026-02-12 | 13F | Jane Street Group, Llc | 35.533 | 262 | ||||||
| 2026-02-12 | 13F | Jane Street Group, Llc | Put | 35.700 | 263 | |||||
| 2026-02-04 | 13F | C WorldWide Group Holding A/S | 100.000 | 0,00 | 1 | |||||
| 2026-02-10 | 13F | Bnp Paribas Arbitrage, Sa | 82 | 0,00 | 1 | |||||
| 2026-02-17 | 13F | Leonteq Securities AG | 0 | -100,00 | 0 | |||||
| 2026-02-17 | 13F | Royal Bank Of Canada | 58.000 | 761,30 | 427 | 870,45 | ||||
| 2026-04-28 | 13F | China Universal Asset Management Co., Ltd. | 30.000 | 167 | ||||||
| 2026-02-17 | 13F | Adage Capital Partners Gp, L.l.c. | 421.322 | 0,00 | 3.101 | 12,52 | ||||
| 2026-04-07 | 13F | Mb, Levis & Associates, Llc | 100 | 0,00 | 1 | |||||
| 2026-02-11 | 13F | Jpmorgan Chase & Co | 1.741 | 216,55 | 13 | 300,00 | ||||
| 2026-02-10 | 13F | Connor, Clark & Lunn Investment Management Ltd. | 57.212 | 421 | ||||||
| 2026-02-17 | 13F | DAFNA Capital Management LLC | 51.000 | 375 | ||||||
| 2026-02-10 | 13F | Bruce G. Allen Investments, LLC | 0 | -100,00 | 0 | |||||
| 2026-02-17 | 13F | Jump Financial, LLC | 53.816 | 396 | ||||||
| 2026-04-15 | 13F | Activest Wealth Management | 66 | 0,00 | 0 | |||||
| 2026-04-14 | 13F | West Branch Capital LLC | 3 | 0,00 | 0 | |||||
| 2026-02-17 | 13F | Davidson Kempner Capital Management Lp | 310.020 | 2.282 | ||||||
| 2025-11-14 | 13F | Raymond James Financial Inc | 0 | -100,00 | 0 | |||||
| 2026-02-17 | 13F | Bridgeway Capital Management Inc | 65.873 | 88,89 | 485 | 112,28 | ||||
| 2026-02-10 | 13F | Belvedere Trading LLC | Put | 0 | -100,00 | 0 | -100,00 | |||
| 2026-02-13 | 13F | Walleye Capital LLC | 95.672 | 704 | ||||||
| 2026-02-09 | 13F | Harbour Investments, Inc. | 85 | 0,00 | 1 | |||||
| 2026-02-13 | 13F | Marshall Wace, Llp | 128.451 | 0,00 | 945 | 12,50 | ||||
| 2026-02-17 | 13F | Citadel Advisors Llc | Put | 32.500 | -28,88 | 239 | -19,80 | |||
| 2026-02-11 | 13F | Simplex Trading, Llc | 32.868 | 460,70 | 242 | |||||
| 2026-01-27 | 13F | TD Waterhouse Canada Inc. | 3.203 | 0,00 | 24 | 21,05 | ||||
| 2026-02-06 | 13F | Gsa Capital Partners Llp | 0 | -100,00 | 0 | |||||
| 2026-02-17 | 13F | Trexquant Investment LP | 41.733 | 307 | ||||||
| 2026-02-17 | 13F | Prelude Capital Management, Llc | 28.723 | 211 | ||||||
| 2026-02-17 | 13F | Citadel Advisors Llc | 31.709 | 233 | ||||||
| 2026-02-13 | 13F | Citigroup Inc | 1 | -99,81 | 0 | -100,00 | ||||
| 2026-02-17 | 13F | Citadel Advisors Llc | Call | 71.300 | 54,00 | 525 | 73,51 | |||
| 2026-02-17 | 13F | XTX Topco Ltd | 11.904 | -17,34 | 88 | -7,45 | ||||
| 2026-01-15 | 13F | Fortitude Family Office, LLC | 0 | -100,00 | 0 | |||||
| 2025-11-14 | 13F | Palo Alto Investors LP | 0 | -100,00 | 0 | |||||
| 2026-02-17 | 13F | Susquehanna International Group, Llp | 147.698 | 317,95 | 1.087 | 370,56 | ||||
| 2026-02-17 | 13F | Northern Trust Corp | 29.023 | 53,76 | 214 | 73,17 | ||||
| 2026-02-10 | 13F | Goldman Sachs Group Inc | 0 | -100,00 | 0 | |||||
| 2026-02-17 | 13F | Fmr Llc | 679 | 0,00 | 5 | 0,00 | ||||
| 2026-02-17 | 13F | Quadrature Capital Ltd | 59.708 | 439 | ||||||
| 2026-02-17 | 13F | Tower Research Capital LLC (TRC) | 0 | -100,00 | 0 | |||||
| 2026-02-17 | 13F | Two Sigma Investments, Lp | 148.793 | 1.095 | ||||||
| 2026-02-17 | 13F | Susquehanna International Group, Llp | Put | 366.300 | 186,62 | 2.696 | 222,75 | |||
| 2026-02-17 | 13F | Susquehanna International Group, Llp | Call | 320.900 | 169,89 | 2.362 | 203,86 | |||
| 2026-02-17 | 13F | Boothbay Fund Management, Llc | 144.628 | 1.064 | ||||||
| 2026-02-13 | 13F | Exome Asset Management LLC | 295.541 | 2.175 | ||||||
| 2026-02-17 | 13F | Persistent Asset Partners Ltd | 18.316 | 135 | ||||||
| 2026-02-13 | 13F | Morgan Stanley | 8.858 | -65,62 | 65 | -61,31 | ||||
| 2026-02-12 | 13F | Soleus Capital Management, L.P. | 440.000 | 3.238 | ||||||
| 2026-04-28 | 13F | SBI Securities Co., Ltd. | 67 | -9,46 | 0 | |||||
| 2026-02-13 | 13F | Context Capital Management, LLC | 62.995 | 464 | ||||||
| 2026-02-12 | 13F | Renaissance Technologies Llc | 59.914 | -7,42 | 441 | 4,02 | ||||
| 2026-02-09 | 13F | Geode Capital Management, Llc | 187.734 | 101,24 | 1.382 | 126,39 | ||||
| 2026-04-28 | 13F | Quent Capital, LLC | 235 | 0,00 | 1 | 0,00 | ||||
| 2025-11-19 | 13F/A | Danske Bank A/s | 0 | 0 | ||||||
| 2026-02-10 | 13F | Bank of New York Mellon Corp | 11.087 | 0,01 | 82 | 12,50 | ||||
| 2026-02-11 | 13F | Rise Advisors, LLC | 0 | -100,00 | 0 | |||||
| 2026-02-17 | 13F | Two Sigma Advisers, Lp | 89.729 | 660 | ||||||
| 2026-02-10 | 13F | Belvedere Trading LLC | 0 | -100,00 | 0 | -100,00 | ||||
| 2026-02-13 | 13F | Affinity Asset Advisors, LLC | 889.575 | 6.547 | ||||||
| 2026-02-10 | 13F | Acadian Asset Management Llc | 3.726 | 0 | ||||||
| 2026-02-14 | 13F | Rockefeller Capital Management L.P. | 733 | 5 |
Other Listings
| US:KPTI | 8,40 $ |