Grundlæggende statistik
| Institutionelle aktier (lange) | 29.186.705 - 12,94% (ex 13D/G) - change of -10,43MM shares -26,32% MRQ |
| Institutionel værdi (lang) | $ 64.099 USD ($1000) |
Institutionelt ejerskab og aktionærer
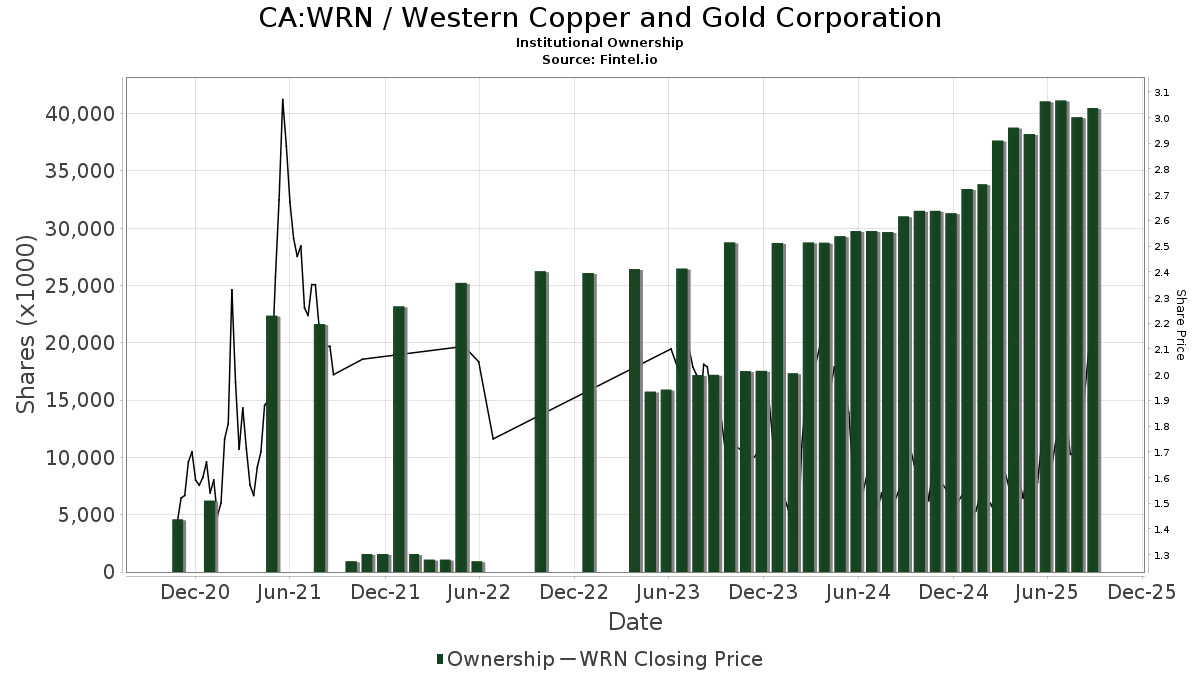
Western Copper and Gold Corporation (CA:WRN) har 66 institutionelle ejere og aktionærer, der har indsendt 13D/G- eller 13F-formularer til Securities Exchange Commission (SEC). Disse institutioner har i alt 29,186,705 aktier. Største aktionærer omfatter Toroso Investments, LLC, Franklin Resources Inc, Fmr Llc, CLARET ASSET MANAGEMENT Corp, Bank Of America Corp /de/, Euro Pacific Asset Management, LLC, Mackenzie Financial Corp, Auxano Advisors, LLC, Goldman Sachs Group Inc, and Millennium Management Llc .
Western Copper and Gold Corporation (TSX:WRN) institutionel ejerskabsstruktur viser aktuelle positioner i virksomheden efter institutioner og fonde, samt seneste ændringer i positionsstørrelse. Større aktionærer kan omfatte individuelle investorer, investeringsforeninger, hedgefonde eller institutioner. Skema 13D angiver, at investoren besidder (eller besidder) mere end 5 % af virksomheden og har til hensigt (eller har til hensigt at) aktivt at forfølge en ændring i forretningsstrategi. Skema 13G indikerer en passiv investering på over 5%.
The share price as of April 24, 2026 is 3,79 / share. Previously, on April 28, 2025, the share price was 1,55 / share. This represents an increase of 144,52% over that period.
Fondens stemningsscore
Fund Sentiment Score (fka Ownership Accumulation Score) finder de aktier, der bliver mest købt af fonde. Det er resultatet af en sofistikeret, multi-faktor kvantitativ model, der identificerer virksomheder med de højeste niveauer af institutionel akkumulering. Scoringsmodellen bruger en kombination af den samlede stigning i oplyste ejere, ændringerne i porteføljeallokeringer i disse ejere og andre målinger. Tallet går fra 0 til 100, hvor højere tal indikerer et højere niveau af akkumulering for sine jævnaldrende, og 50 er gennemsnittet.
Opdateringsfrekvens: Dagligt
Se Ownership Explorer, som giver en liste over højest rangerende virksomheder.
AI+ Ask Fintel’s AI assistant about Western Copper and Gold Corporation.
Select a question to share a public post with an AI-crafted answer.
Thinking of good questions…
13F og NPORT arkivering
Detaljer om 13F-arkivering er gratis. Detaljer om NP-ansøgninger kræver et premium-medlemskab. Grønne rækker angiver nye positioner. Røde rækker angiver lukkede positioner. Klik på linket ikon for at se den fulde transaktionshistorik.
Opgrader
for at låse premium-data op og eksportere til Excel ![]() .
.
| Fil dato | Kilde | Investor | Type | Gennemsnitlig pris (Øst) |
Aktier | Δ Aktier (%) |
Rapporteret Værdi ($1000) |
Δ Værdi (%) |
Port Alloc (%) |
|
|---|---|---|---|---|---|---|---|---|---|---|
| 2026-02-13 | 13F | Morgan Stanley | 675.521 | 148,03 | 1.804 | 236,38 | ||||
| 2026-02-17 | 13F | Millennium Management Llc | 686.447 | 171,29 | 1.834 | 268,07 | ||||
| 2026-02-18 | 13F | GWM Advisors LLC | 0 | -100,00 | 0 | |||||
| 2026-02-11 | 13F | Franklin Resources Inc | 4.860.000 | 6,11 | 12.995 | 43,12 | ||||
| 2026-02-17 | 13F | Two Sigma Investments, Lp | 15.666 | 42 | ||||||
| 2026-02-12 | 13F | Bank Of Montreal /can/ | 28.925 | -13,52 | 77 | 16,67 | ||||
| 2026-02-23 | 13F | Virtu Financial LLC | 42.108 | 0 | ||||||
| 2026-02-17 | 13F | XTX Topco Ltd | 67.000 | 179 | ||||||
| 2026-02-17 | 13F | Jones Financial Companies Lllp | 15.066 | 0,44 | 40 | 37,93 | ||||
| 2026-02-17 | 13F | Point72 Asset Management, L.P. | 27.781 | 74 | ||||||
| 2026-02-13 | 13F | National Bank Of Canada /fi/ | 0 | -100,00 | 0 | -100,00 | ||||
| 2026-02-17 | 13F | PenderFund Capital Management Ltd. | 68.500 | -78,49 | 183 | -71,00 | ||||
| 2026-04-23 | 13F | Oppenheimer & Co Inc | 0 | -100,00 | 0 | |||||
| 2026-04-13 | 13F | Hm Payson & Co | 3.050 | 8 | ||||||
| 2026-02-17 | 13F | Raymond James Financial Inc | 108.388 | 65,94 | 289 | 125,78 | ||||
| 2026-04-08 | 13F | Dynamic Advisor Solutions LLC | 36.140 | 0,00 | 91 | -5,21 | ||||
| 2026-02-13 | 13F | SRS Capital Advisors, Inc. | 6.000 | 0,00 | 16 | 45,45 | ||||
| 2026-02-13 | 13F | Global Strategic Management Inc | 325.400 | 1 | ||||||
| 2026-02-12 | 13F | Jane Street Group, Llc | 64.057 | -28,48 | 171 | -2,84 | ||||
| 2026-02-17 | 13F | Two Sigma Securities, Llc | 30.165 | 10,31 | 81 | 50,94 | ||||
| 2026-02-12 | 13F | BlackRock, Inc. | 7.544 | 469,36 | 20 | 900,00 | ||||
| 2026-02-17 | 13F | Citadel Advisors Llc | 0 | -100,00 | 0 | |||||
| 2026-01-30 | 13F | Us Bancorp \de\ | 25 | 0,00 | 0 | |||||
| 2025-11-14 | 13F | Cubist Systematic Strategies, LLC | 0 | -100,00 | 0 | -100,00 | ||||
| 2026-04-14 | 13F | Prospera Financial Services Inc | 159.250 | -3,19 | 403 | -8,43 | ||||
| 2026-02-03 | 13F | International Assets Investment Management, Llc | 18.200 | 45,60 | 49 | |||||
| 2026-02-11 | 13F | CLARET ASSET MANAGEMENT Corp | 3.698.800 | 0,00 | 10 | 28,57 | ||||
| 2026-02-05 | 13F | Gabelli Funds Llc | 40.000 | 0,00 | 107 | 35,90 | ||||
| 2026-02-10 | 13F | Goldman Sachs Group Inc | 743.524 | -12,47 | 1.985 | 18,65 | ||||
| 2026-02-17 | 13F | Royal Bank Of Canada | 118.617 | -91,94 | 317 | -89,06 | ||||
| 2026-01-29 | 13F | UBS Group AG | 53.042 | -49,54 | 142 | -31,88 | ||||
| 2026-02-06 | 13F | Auxano Advisors, LLC | 920.000 | 2.456 | ||||||
| 2026-02-12 | 13F | Dimensional Fund Advisors Lp | 10.615 | 28 | ||||||
| 2026-02-17 | 13F | Susquehanna International Group, Llp | 0 | -100,00 | 0 | |||||
| 2026-02-17 | 13F | Bank Of America Corp /de/ | 1.652.539 | 66,99 | 4.412 | 126,37 | ||||
| 2025-10-31 | 13F | National Asset Management, Inc. | 0 | -100,00 | 0 | |||||
| 2026-02-10 | 13F | Lido Advisors, LLC | 520.000 | -5,57 | 1.388 | 28,04 | ||||
| 2026-02-13 | 13F | Toroso Investments, LLC | 4.903.888 | 46,01 | 13.093 | 97,90 | ||||
| 2026-01-27 | 13F | TD Waterhouse Canada Inc. | 3.000 | 0,00 | 8 | 60,00 | ||||
| 2026-02-11 | 13F | Jpmorgan Chase & Co | 0 | -100,00 | 0 | -100,00 | ||||
| 2025-11-14 | 13F | Advisor Group Holdings, Inc. | 0 | -100,00 | 0 | -100,00 | ||||
| 2026-02-12 | 13F | Scotia Capital Inc. | 10.000 | -17,90 | 27 | 13,04 | ||||
| 2026-02-13 | 13F | MAI Capital Management | 200 | 0,00 | 1 | |||||
| 2026-04-22 | 13F | Louisbourg Investments Inc. | 1.500 | 4 | ||||||
| 2026-02-17 | 13F | Russell Investments Group, Ltd. | 171.303 | -75,51 | 459 | -66,98 | ||||
| 2026-02-13 | 13F | Marshall Wace, Llp | 0 | -100,00 | 0 | |||||
| 2026-02-12 | 13F | Sprott Inc. | 36.330 | 97 | ||||||
| 2026-02-10 | 13F | Connor, Clark & Lunn Investment Management Ltd. | 359.000 | 201,43 | 960 | 306,36 | ||||
| 2026-02-17 | 13F | Fairscale Capital, LLC | 1.000 | 0,00 | 3 | 100,00 | ||||
| 2026-02-18 | 13F | Mackenzie Financial Corp | 961.393 | -0,90 | 2.634 | 36,92 | ||||
| 2026-02-06 | 13F/A | Rathbone Brothers plc | 27.450 | 0,00 | 74 | 35,19 | ||||
| 2026-02-13 | 13F | Centiva Capital, LP | 0 | -100,00 | 0 | |||||
| 2026-02-13 | 13F | Wells Fargo & Company/mn | 7.689 | 15,94 | 21 | 53,85 | ||||
| 2026-04-17 | 13F | Vermillion Wealth Management, Inc. | 1.000 | 0,00 | 3 | 0,00 | ||||
| 2026-04-16 | 13F | Brookstone Capital Management | 16.800 | -9,19 | 43 | -14,29 | ||||
| 2026-02-17 | 13F | Fmr Llc | 4.312.173 | -24,02 | 11.530 | 2,44 | ||||
| 2026-02-12 | 13F | Federation des caisses Desjardins du Quebec | 51.000 | 0,00 | 136 | 36,00 | ||||
| 2026-02-10 | 13F | CIBC World Markets Inc. | 183.358 | 0,97 | 490 | 35,83 | ||||
| 2026-01-14 | 13F | Advisors Management Group Inc /adv | 42.282 | 0,00 | 0 | |||||
| 2026-02-10 | 13F | Bnp Paribas Arbitrage, Sa | 16.400 | 290,48 | 44 | 437,50 | ||||
| 2025-11-12 | 13F | CIBC Bancorp USA Inc. | 50.000 | 98 | ||||||
| 2026-02-05 | 13F | Allworth Financial LP | 6.702 | 318,88 | 18 | 466,67 | ||||
| 2026-04-16 | 13F | Sweeney & Michel, Llc | 61.219 | -16,39 | 174 | -27,20 | ||||
| 2026-02-12 | 13F | Marex Group plc | 0 | -100,00 | 0 | -100,00 | ||||
| 2026-02-17 | 13F | Toronto Dominion Bank | 0 | -100,00 | 0 | |||||
| 2026-02-11 | 13F | LPL Financial LLC | 12.575 | -16,39 | 34 | 13,79 | ||||
| 2026-02-13 | 13F | Integrated Wealth Concepts LLC | 13.000 | 0,00 | 35 | 36,00 | ||||
| 2026-02-13 | 13F | Hurley Capital, LLC | 0 | -100,00 | 0 | |||||
| 2026-02-05 | 13F | Gamco Investors, Inc. Et Al | 528.200 | 21,93 | 1.410 | 65,30 | ||||
| 2026-01-07 | 13F | Aventura Private Wealth, LLC | 735 | 2 | ||||||
| 2026-02-13 | 13F | Arrowstreet Capital, Limited Partnership | 105.803 | 283 | ||||||
| 2026-01-21 | 13F/A | Euro Pacific Asset Management, LLC | 1.035.506 | 164,63 | 3 | |||||
| 2026-02-02 | 13F | Millstone Evans Group, LLC | 258.926 | -10,38 | 691 | 21,44 | ||||
| 2026-02-10 | 13F | Acadian Asset Management Llc | 35.100 | -1,68 | 0 | |||||
| 2026-02-03 | 13F | SBI Securities Co., Ltd. | 46.477 | -5,79 | 124 | 27,84 | ||||
| 2026-02-06 | 13F | Advisory Alpha, LLC | 163.326 | 255,13 | 436 | 401,15 | ||||
| 2026-02-13 | 13F | American Century Companies Inc | 21.921 | 59 | ||||||
| 2026-02-13 | 13F | Beutel, Goodman & Co Ltd. | 14.790 | -44,36 | 0 | |||||
| 2026-01-20 | 13F | Wealth Management Associates, Inc. | 205.500 | 202,65 | 549 | 312,03 | ||||
| 2026-02-17 | 13F | Quadrature Capital Ltd | 518.789 | 172,19 | 1.388 | 269,87 |