Grundlæggende statistik
| Institutionelle aktier (lange) | 64.562.687 - 37,42% (ex 13D/G) - change of 14,41MM shares 28,73% MRQ |
| Institutionel værdi (lang) | $ 277.644 USD ($1000) |
Institutionelt ejerskab og aktionærer
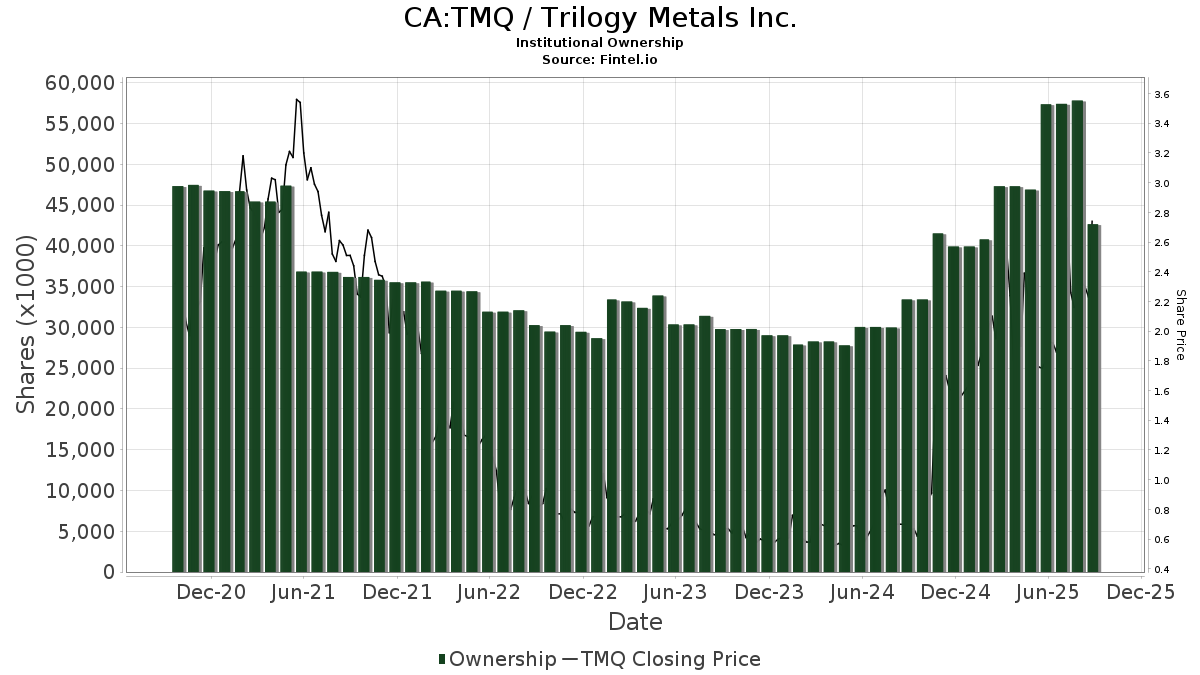
Trilogy Metals Inc. (CA:TMQ) har 126 institutionelle ejere og aktionærer, der har indsendt 13D/G- eller 13F-formularer til Securities Exchange Commission (SEC). Disse institutioner har i alt 64,562,687 aktier. Største aktionærer omfatter Electrum Group Llc, Toroso Investments, LLC, Old West Investment Management, LLC, Goehring & Rozencwajg Associates, LLC, Jane Street Group, Llc, Envestnet Asset Management Inc, Susquehanna International Group, Llp, Alps Advisors Inc, Susquehanna International Group, Llp, and Susquehanna International Group, Llp .
Trilogy Metals Inc. (TSX:TMQ) institutionel ejerskabsstruktur viser aktuelle positioner i virksomheden efter institutioner og fonde, samt seneste ændringer i positionsstørrelse. Større aktionærer kan omfatte individuelle investorer, investeringsforeninger, hedgefonde eller institutioner. Skema 13D angiver, at investoren besidder (eller besidder) mere end 5 % af virksomheden og har til hensigt (eller har til hensigt at) aktivt at forfølge en ændring i forretningsstrategi. Skema 13G indikerer en passiv investering på over 5%.
The share price as of March 6, 2026 is 5,43 / share. Previously, on March 10, 2025, the share price was 1,80 / share. This represents an increase of 201,67% over that period.
Fondens stemningsscore
Fund Sentiment Score (fka Ownership Accumulation Score) finder de aktier, der bliver mest købt af fonde. Det er resultatet af en sofistikeret, multi-faktor kvantitativ model, der identificerer virksomheder med de højeste niveauer af institutionel akkumulering. Scoringsmodellen bruger en kombination af den samlede stigning i oplyste ejere, ændringerne i porteføljeallokeringer i disse ejere og andre målinger. Tallet går fra 0 til 100, hvor højere tal indikerer et højere niveau af akkumulering for sine jævnaldrende, og 50 er gennemsnittet.
Opdateringsfrekvens: Dagligt
Se Ownership Explorer, som giver en liste over højest rangerende virksomheder.
AI+ Ask Fintel’s AI assistant about Trilogy Metals Inc..
Select a question to share a public post with an AI-crafted answer.
Thinking of good questions…
13F og NPORT arkivering
Detaljer om 13F-arkivering er gratis. Detaljer om NP-ansøgninger kræver et premium-medlemskab. Grønne rækker angiver nye positioner. Røde rækker angiver lukkede positioner. Klik på linket ikon for at se den fulde transaktionshistorik.
Opgrader
for at låse premium-data op og eksportere til Excel ![]() .
.
| Fil dato | Kilde | Investor | Type | Gennemsnitlig pris (Øst) |
Aktier | Δ Aktier (%) |
Rapporteret Værdi ($1000) |
Δ Værdi (%) |
Port Alloc (%) |
|
|---|---|---|---|---|---|---|---|---|---|---|
| 2026-01-30 | 13F | Us Bancorp \de\ | 6 | 0,00 | 0 | |||||
| 2026-02-12 | 13F | Steward Partners Investment Advisory, Llc | 425 | 2 | ||||||
| 2026-01-14 | 13F | Cypress Wealth Services, LLC | 21.100 | 7,65 | 91 | 119,51 | ||||
| 2025-11-14 | 13F | Hrt Financial Lp | 0 | -100,00 | 0 | |||||
| 2026-01-27 | 13F | TD Waterhouse Canada Inc. | 50 | 0,00 | 0 | |||||
| 2026-02-12 | 13F | Dimensional Fund Advisors Lp | 27.514 | 26,83 | 119 | 162,22 | ||||
| 2026-02-17 | 13F | Two Sigma Securities, Llc | 21.947 | 95 | ||||||
| 2026-01-14 | 13F | Spire Wealth Management | 12.114 | -35,47 | 52 | 33,33 | ||||
| 2026-02-17 | 13F | Tower Research Capital LLC (TRC) | 9.751 | 42 | ||||||
| 2026-02-06 | 13F | IFP Advisors, Inc | 12 | 0 | ||||||
| 2026-02-17 | 13F | Raymond James Financial Inc | 21.015 | 109,23 | 91 | 328,57 | ||||
| 2026-02-06 | 13F | New Millennium Group LLC | 280 | 1 | ||||||
| 2026-02-17 | 13F | Northern Trust Corp | 35.075 | 151 | ||||||
| 2026-02-13 | 13F | Pathstone Holdings, LLC | 20.000 | 0,00 | 86 | 104,76 | ||||
| 2026-02-11 | 13F | LPL Financial LLC | 54.506 | 90,69 | 235 | 290,00 | ||||
| 2026-02-10 | 13F/A | Northwestern Mutual Wealth Management Co | 62 | 0,00 | 0 | |||||
| 2026-02-13 | 13F | Morgan Stanley | 198.430 | 280,35 | 855 | 684,40 | ||||
| 2026-02-12 | 13F | Jane Street Group, Llc | 941.892 | 109,75 | 4.060 | 330,89 | ||||
| 2026-01-28 | 13F | Geneos Wealth Management Inc. | 300 | 1 | ||||||
| 2026-01-29 | 13F | Vanguard Group Inc | 99.298 | 430 | ||||||
| 2026-02-12 | 13F | Jane Street Group, Llc | Put | 19.200 | 83 | |||||
| 2026-02-10 | 13F | State of Wyoming | 7.534 | 32 | ||||||
| 2026-02-12 | 13F | Jane Street Group, Llc | Call | 96.600 | 416 | |||||
| 2026-02-13 | 13F | National Bank Of Canada /fi/ | 378 | 641,18 | 1 | |||||
| 2026-02-13 | 13F | American Century Companies Inc | 10.294 | 45 | ||||||
| 2026-02-13 | 13F | Truvestments Capital Llc | 8 | 0,00 | 0 | |||||
| 2026-02-11 | 13F | Tradition Wealth Management, LLC | 10.000 | 43 | ||||||
| 2026-02-17 | 13F | Susquehanna International Group, Llp | 655.971 | 916,73 | 2.827 | 1.994,07 | ||||
| 2026-01-30 | 13F | Activest Wealth Management | 1.000 | 4 | ||||||
| 2026-02-11 | 13F | Electrum Group Llc | 31.604.741 | 136.216 | ||||||
| 2026-02-17 | 13F | Susquehanna International Group, Llp | Put | 672.000 | 2.896 | |||||
| 2026-02-17 | 13F | Susquehanna International Group, Llp | Call | 748.800 | 945,81 | 3.227 | 2.051,33 | |||
| 2026-02-06 | 13F | Global Retirement Partners, LLC | 2.056 | 6.130,30 | 9 | |||||
| 2026-02-11 | 13F | Legacy Capital Wealth Management, Llc | 43.107 | 186 | ||||||
| 2026-02-11 | 13F | Simplex Trading, Llc | Put | 61.800 | 10.200,00 | 266 | ||||
| 2026-02-11 | 13F | Simplex Trading, Llc | Call | 155.000 | 46,36 | 668 | ||||
| 2026-01-29 | 13F | UBS Group AG | 71.308 | 712.980,00 | 307 | |||||
| 2026-02-17 | 13F | Signature Equity Partners, LLC | 500 | 2 | ||||||
| 2026-01-27 | 13F | Atlantic Edge Private Wealth Management, LLC | 200 | 1 | ||||||
| 2026-02-17 | 13F | Scientech Research LLC | 20.626 | 89 | ||||||
| 2026-02-13 | 13F | Gen-Wealth Partners Inc | 458 | 2 | ||||||
| 2025-11-14 | 13F | Wolverine Trading, Llc | Call | 17.400 | -19,07 | 37 | 23,33 | |||
| 2026-02-17 | 13F | Cetera Investment Advisers | Call | 4.500 | 1 | |||||
| 2026-02-09 | 13F | Hantz Financial Services, Inc. | 1.116 | 21,83 | 0 | |||||
| 2026-02-17 | 13F | Cetera Investment Advisers | 12.603 | 54 | ||||||
| 2026-02-12 | 13F | Colonial Trust Advisors | 1.000 | 4 | ||||||
| 2026-02-12 | 13F | Federation des caisses Desjardins du Quebec | 7.223 | -52,48 | 31 | -3,23 | ||||
| 2026-02-12 | 13F | Alps Advisors Inc | 674.396 | 74,96 | 2.907 | 259,21 | ||||
| 2025-11-14 | 13F | GeoSphere Capital Management | 0 | -100,00 | 0 | -100,00 | ||||
| 2026-02-11 | 13F | Jpmorgan Chase & Co | 46 | -99,98 | 0 | -100,00 | ||||
| 2026-02-17 | 13F | Rangeley Capital, LLC | 87.000 | 0,00 | 375 | 105,49 | ||||
| 2026-02-13 | 13F | Toroso Investments, LLC | 18.752.440 | 417,29 | 80.823 | 961,78 | ||||
| 2026-01-29 | 13F | Pictet Asset Management Holding SA | 19.576 | 84 | ||||||
| 2026-02-17 | 13F | Jump Financial, LLC | 14.035 | 60 | ||||||
| 2026-02-17 | 13F | California State Teachers Retirement System | 96.400 | 415 | ||||||
| 2026-02-17 | 13F | Old West Investment Management, LLC | 4.679.087 | -61,54 | 20.167 | -21,06 | ||||
| 2026-02-06 | 13F | Larson Financial Group LLC | 2.000 | 9 | ||||||
| 2026-02-09 | 13F | Harbour Investments, Inc. | 326 | 1.937,50 | 1 | |||||
| 2026-02-17 | 13F | Advisor Group Holdings, Inc. | 22.685 | 141.681,25 | 98 | |||||
| 2026-01-21 | 13F | Sound Income Strategies, LLC | 0 | -100,00 | 0 | |||||
| 2026-02-13 | 13F | Marshall Wace, Llp | 0 | -100,00 | 0 | |||||
| 2026-01-20 | 13F | AdvisorNet Financial, Inc | 7.837 | -28,00 | 34 | 50,00 | ||||
| 2026-02-02 | 13F | New England Capital Financial Advisors LLC | 333 | 0,00 | 1 | |||||
| 2026-01-23 | 13F | Rsm Us Wealth Management Llc | 22.500 | 97 | ||||||
| 2026-02-13 | 13F | State Street Corp | 168.538 | 726 | ||||||
| 2026-01-28 | 13F | Klp Kapitalforvaltning As | 31.000 | 134 | ||||||
| 2026-02-17 | 13F | Two Sigma Investments, Lp | 325.091 | -0,50 | 1.401 | 104,23 | ||||
| 2026-02-05 | 13F | Allworth Financial LP | 300 | 1 | ||||||
| 2025-11-14 | 13F | Credit Agricole S A | 0 | -100,00 | 0 | |||||
| 2026-02-09 | 13F | Legal & General Group Plc | 87.195 | 376 | ||||||
| 2026-02-13 | 13F | DLD Asset Management, LP | Call | 0 | -100,00 | 0 | ||||
| 2026-02-23 | 13F | Virtu Financial LLC | 21.207 | 64,78 | 0 | |||||
| 2026-02-11 | 13F | Total Wealth Planning & Management, Inc. | 45.220 | -55,00 | 195 | 43,70 | ||||
| 2026-02-10 | 13F | Envestnet Asset Management Inc | 925.740 | -8,66 | 3.990 | 87,45 | ||||
| 2026-02-14 | 13F | Rockefeller Capital Management L.P. | 87.049 | 569,61 | 375 | 1.288,89 | ||||
| 2026-02-05 | 13F | Tucker Asset Management Llc | 1.598 | 7 | ||||||
| 2026-02-13 | 13F | Glen Eagle Advisors, LLC | 0 | -100,00 | 0 | |||||
| 2026-02-13 | 13F | Alyeska Investment Group, L.P. | 0 | -100,00 | 0 | |||||
| 2026-02-11 | 13F | Simplex Trading, Llc | 0 | -100,00 | 0 | |||||
| 2026-02-18 | 13F | Mackenzie Financial Corp | 96.699 | 416 | ||||||
| 2026-01-14 | 13F | Tradewinds Capital Management, LLC | 475 | 2 | ||||||
| 2026-01-28 | 13F | Chicago Partners Investment Group LLC | Call | 24.000 | 43 | |||||
| 2026-01-13 | 13F | CoreCap Advisors, LLC | 1.066 | 0,00 | 5 | 100,00 | ||||
| 2026-02-12 | 13F | Triumph Capital Management | 200 | 1 | ||||||
| 2026-02-17 | 13F | Engineers Gate Manager LP | 20.682 | 89 | ||||||
| 2025-11-14 | 13F | XTX Topco Ltd | 0 | -100,00 | 0 | -100,00 | ||||
| 2026-01-21 | 13F | Stone House Investment Management, LLC | 500 | 2 | ||||||
| 2026-02-13 | 13F | Integrated Wealth Concepts LLC | 10.500 | 5,00 | 45 | 114,29 | ||||
| 2026-01-14 | 13F | ORG Partners LLC | 250 | 1 | ||||||
| 2026-02-12 | 13F | BlackRock, Inc. | 282.584 | 1.218 | ||||||
| 2026-02-11 | 13F | Winton Capital Group Ltd | 15.990 | 69 | ||||||
| 2026-02-13 | 13F | Wexford Capital Lp | 0 | -100,00 | 0 | |||||
| 2026-02-13 | 13F | Citigroup Inc | 24.041 | 104 | ||||||
| 2026-01-23 | 13F | Farther Finance Advisors, LLC | 2.400 | 10 | ||||||
| 2026-02-17 | 13F | GAM Holding AG | 0 | -100,00 | 0 | |||||
| 2026-02-17 | 13F | Captrust Financial Advisors | 13.256 | 57 | ||||||
| 2026-01-22 | 13F | Financial Consulate, Inc | 1.105 | 5 | ||||||
| 2026-02-12 | 13F | Swiss National Bank | 212.100 | 914 | ||||||
| 2026-02-17 | 13F | Point72 Asset Management, L.P. | 141.900 | 612 | ||||||
| 2026-02-13 | 13F | DLD Asset Management, LP | 0 | -100,00 | 0 | |||||
| 2026-02-11 | 13F | Parallel Advisors, LLC | 20.325 | 88 | ||||||
| 2026-02-17 | 13F | Caption Management, LLC | Call | 140.000 | 603 | |||||
| 2026-01-29 | 13F | IMC-Chicago, LLC | Put | 84.900 | 366 | |||||
| 2026-01-29 | 13F | IMC-Chicago, LLC | Call | 117.200 | 505 | |||||
| 2026-02-17 | 13F | Wiley Bros.-aintree Capital, Llc | 39.866 | -21,86 | 172 | 59,81 | ||||
| 2026-01-26 | 13F | Cwm, Llc | 314 | 318,67 | 0 | |||||
| 2026-02-04 | 13F | Pensionmark Financial Group, Llc | 42.079 | 181 | ||||||
| 2026-01-30 | 13F | Exencial Wealth Advisors, Llc | 0 | -100,00 | 0 | |||||
| 2026-02-17 | 13F | Qube Research & Technologies Ltd | 0 | -100,00 | 0 | |||||
| 2026-01-23 | 13F | Avion Wealth | 8.400 | 0,00 | 0 | |||||
| 2026-02-13 | 13F | Bornite Capital Management LP | 0 | -100,00 | 0 | |||||
| 2026-01-27 | 13F | Zurcher Kantonalbank (Zurich Cantonalbank) | 60.677 | 262 | ||||||
| 2026-02-13 | 13F | Caitong International Asset Management Co., Ltd | 6.173 | 27 | ||||||
| 2026-02-10 | 13F | Quantbot Technologies LP | 86.910 | 375 | ||||||
| 2026-02-13 | 13F | MAI Capital Management | 14.800 | 64 | ||||||
| 2026-01-07 | 13F | Massmutual Trust Co Fsb/adv | 300 | 1 | ||||||
| 2026-02-13 | 13F | Manufacturers Life Insurance Company, The | 0 | -100,00 | 0 | |||||
| 2025-11-14 | 13F | Cubist Systematic Strategies, LLC | 74.381 | 43,61 | 156 | 126,09 | ||||
| 2026-02-13 | 13F | Stifel Financial Corp | 25.625 | 110 | ||||||
| 2026-02-12 | 13F | Pettinga Financial Advisors, LLC | 15.233 | 66 | ||||||
| 2026-02-17 | 13F | Royal Bank Of Canada | 4.469 | 55.762,50 | 19 | |||||
| 2026-02-17 | 13F | Millennium Management Llc | 328.446 | -18,23 | 1.416 | 67,85 | ||||
| 2026-01-29 | 13F | IMC-Chicago, LLC | 49.083 | 212 | ||||||
| 2026-02-11 | 13F | Modus Advisors, LLC | 1.000 | 4 | ||||||
| 2026-02-12 | 13F | Renaissance Technologies Llc | 0 | -100,00 | 0 | |||||
| 2026-02-18 | 13F | GWM Advisors LLC | 1.050 | 5 | ||||||
| 2026-02-13 | 13F | Great West Life Assurance Co /can/ | 28.202 | 0 | ||||||
| 2026-02-06 | 13F | Pnc Financial Services Group, Inc. | 2.000 | 0,00 | 9 | 100,00 | ||||
| 2026-01-28 | 13F | Arizona State Retirement System | 29.923 | 129 | ||||||
| 2026-01-28 | 13F | Legacy Capital Group California, Inc. | 174.649 | -38,34 | 753 | 26,60 | ||||
| 2026-02-05 | 13F | Cambridge Investment Research Advisors, Inc. | 42.950 | 0 | ||||||
| 2026-02-17 | 13F | Janus Henderson Group Plc | 51.800 | 223 | ||||||
| 2026-02-10 | 13F | Goldman Sachs Group Inc | 159.914 | 34,32 | 689 | 175,60 | ||||
| 2026-02-13 | 13F | Barclays Plc | 3.342 | 14 | ||||||
| 2026-02-17 | 13F | Bank Of America Corp /de/ | 357.328 | 202,70 | 1.540 | 523,48 | ||||
| 2026-02-10 | 13F | Td Asset Management Inc | 135.888 | 589 | ||||||
| 2026-02-03 | 13F | SBI Securities Co., Ltd. | 4.804 | 21 | ||||||
| 2026-02-17 | 13F | Citadel Advisors Llc | 16.044 | -94,50 | 69 | -88,73 | ||||
| 2026-02-17 | 13F | Citadel Advisors Llc | Call | 263.800 | 1.977,17 | 1.137 | 4.269,23 | |||
| 2026-02-04 | 13F | Atlantic Union Bankshares Corp | 250 | 1 | ||||||
| 2026-02-17 | 13F | Citadel Advisors Llc | Put | 532.800 | 2.236,84 | 2.296 | 4.785,11 | |||
| 2026-02-17 | 13F | Jones Financial Companies Lllp | 7.882 | 34 | ||||||
| 2026-02-13 | 13F | Rhumbline Advisers | 275 | 1 | ||||||
| 2026-01-09 | 13F | Silverlake Wealth Management Llc | 12.244 | 53 | ||||||
| 2026-02-17 | 13F | Toronto Dominion Bank | 408 | 2 | ||||||
| 2026-02-13 | 13F | Dynamic Technology Lab Private Ltd | 66.875 | 288 | ||||||
| 2026-02-11 | 13F | Group One Trading, L.p. | Call | 558.100 | 12.584,09 | 2.405 | 26.622,22 | |||
| 2026-02-13 | 13F | Goehring & Rozencwajg Associates, LLC | 1.408.204 | 5,22 | 6.105 | 114,55 | ||||
| 2026-02-11 | 13F | Group One Trading, L.p. | Put | 239.200 | 59.700,00 | 1.031 | ||||
| 2026-01-21 | 13F | TSP Capital Management Group, LLC | 29.011 | 105,73 | ||||||
| 2026-02-09 | 13F | IPG Investment Advisors LLC | 14.850 | 0,00 | 64 | 106,45 | ||||
| 2026-02-11 | 13F | Group One Trading, L.p. | 2.771 | -96,48 | 12 | -93,33 | ||||
| 2026-03-03 | 13F | Targeted Financial Services LLC | 51.302 | 221 | ||||||
| 2025-10-15 | 13F | Financial Management Professionals, Inc. | 0 | -100,00 | 0 | |||||
| 2026-02-13 | 13F | Walleye Capital LLC | 254.411 | 332,63 | 1.097 | 791,06 | ||||
| 2026-02-17 | 13F | Two Sigma Advisers, Lp | 0 | -100,00 | 0 | |||||
| 2026-02-06 | 13F | Leonteq Securities AG | 10.000 | 43 | ||||||
| 2026-02-12 | 13F | Sprott Inc. | 135.566 | -37,70 | 584 | 28,07 | ||||
| 2026-02-13 | 13F | Wells Fargo & Company/mn | 2.427 | -78,62 | 11 | -58,33 | ||||
| 2026-02-17 | 13F | Paulson & Co. Inc. | 0 | -100,00 | 0 |