Grundlæggende statistik
| Institutionelle aktier (lange) | 18.935.656 - 15,34% (ex 13D/G) - change of 0,17MM shares 0,89% MRQ |
| Institutionel værdi (lang) | $ 44.368 USD ($1000) |
Institutionelt ejerskab og aktionærer
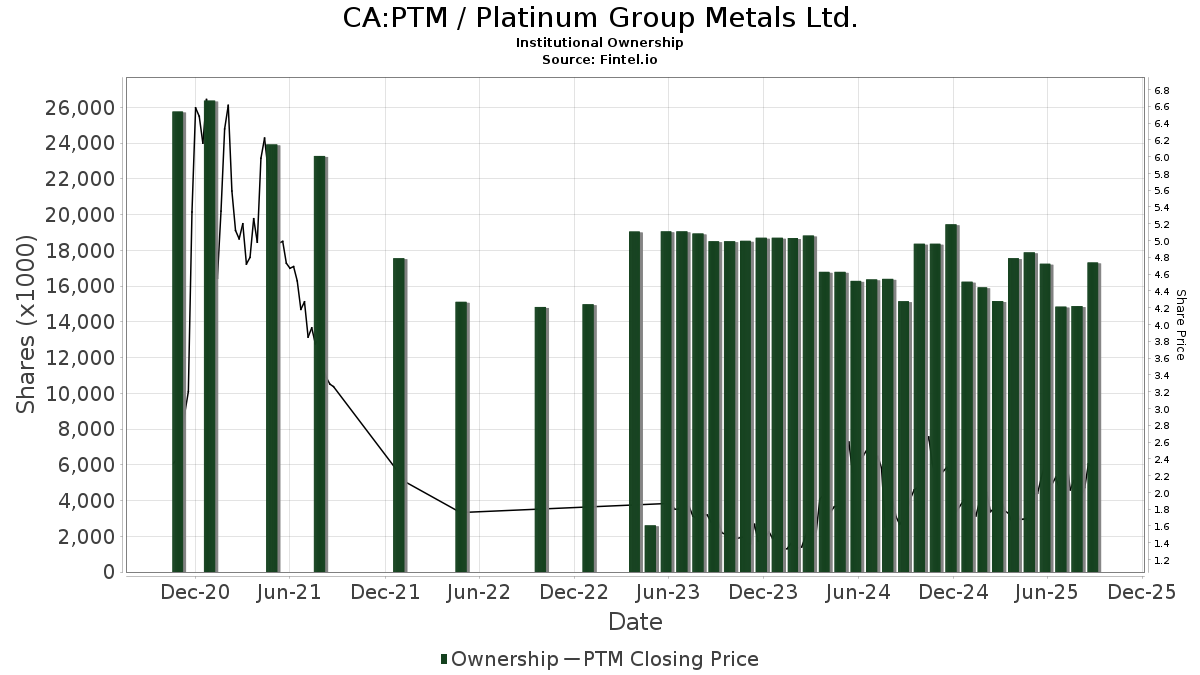
Platinum Group Metals Ltd. (CA:PTM) har 73 institutionelle ejere og aktionærer, der har indsendt 13D/G- eller 13F-formularer til Securities Exchange Commission (SEC). Disse institutioner har i alt 18,935,656 aktier. Største aktionærer omfatter Franklin Resources Inc, Millennium Management Llc, Two Sigma Investments, Lp, Jane Street Group, Llc, Susquehanna International Group, Llp, Bank Of America Corp /de/, UBS Group AG, Walleye Capital LLC, Federation des caisses Desjardins du Quebec, and Marshall Wace, Llp .
Platinum Group Metals Ltd. (TSX:PTM) institutionel ejerskabsstruktur viser aktuelle positioner i virksomheden efter institutioner og fonde, samt seneste ændringer i positionsstørrelse. Større aktionærer kan omfatte individuelle investorer, investeringsforeninger, hedgefonde eller institutioner. Skema 13D angiver, at investoren besidder (eller besidder) mere end 5 % af virksomheden og har til hensigt (eller har til hensigt at) aktivt at forfølge en ændring i forretningsstrategi. Skema 13G indikerer en passiv investering på over 5%.
The share price as of February 27, 2026 is 3,78 / share. Previously, on March 3, 2025, the share price was 1,67 / share. This represents an increase of 126,35% over that period.
Fondens stemningsscore
Fund Sentiment Score (fka Ownership Accumulation Score) finder de aktier, der bliver mest købt af fonde. Det er resultatet af en sofistikeret, multi-faktor kvantitativ model, der identificerer virksomheder med de højeste niveauer af institutionel akkumulering. Scoringsmodellen bruger en kombination af den samlede stigning i oplyste ejere, ændringerne i porteføljeallokeringer i disse ejere og andre målinger. Tallet går fra 0 til 100, hvor højere tal indikerer et højere niveau af akkumulering for sine jævnaldrende, og 50 er gennemsnittet.
Opdateringsfrekvens: Dagligt
Se Ownership Explorer, som giver en liste over højest rangerende virksomheder.
AI+ Ask Fintel’s AI assistant about Platinum Group Metals Ltd..
Select a question to share a public post with an AI-crafted answer.
Thinking of good questions…
13F og NPORT arkivering
Detaljer om 13F-arkivering er gratis. Detaljer om NP-ansøgninger kræver et premium-medlemskab. Grønne rækker angiver nye positioner. Røde rækker angiver lukkede positioner. Klik på linket ikon for at se den fulde transaktionshistorik.
Opgrader
for at låse premium-data op og eksportere til Excel ![]() .
.
| Fil dato | Kilde | Investor | Type | Gennemsnitlig pris (Øst) |
Aktier | Δ Aktier (%) |
Rapporteret Værdi ($1000) |
Δ Værdi (%) |
Port Alloc (%) |
|
|---|---|---|---|---|---|---|---|---|---|---|
| 2026-02-06 | 13F | Bare Financial Services, Inc | 0 | -100,00 | 0 | |||||
| 2026-02-17 | 13F | Tower Research Capital LLC (TRC) | 1.327 | 14,00 | 3 | 0,00 | ||||
| 2026-01-21 | 13F | Sound Income Strategies, LLC | 400 | 1 | ||||||
| 2026-02-12 | 13F | Sprott Inc. | Call | 20.000 | 55 | |||||
| 2026-02-17 | 13F | Quadrature Capital Ltd | 146.901 | 347 | ||||||
| 2026-02-10 | 13F | Quantbot Technologies LP | 146.455 | 346 | ||||||
| 2026-02-11 | 13F | Simplex Trading, Llc | Call | 212.700 | 398,13 | 502 | ||||
| 2026-02-11 | 13F | Simplex Trading, Llc | Put | 17.300 | 394,29 | 41 | ||||
| 2026-02-11 | 13F | Simplex Trading, Llc | 27.089 | -76,97 | 64 | |||||
| 2026-02-17 | 13F | Advisor Group Holdings, Inc. | 106.450 | 156,51 | 251 | 126,13 | ||||
| 2026-02-13 | 13F | Dynamic Technology Lab Private Ltd | 75.043 | 177 | ||||||
| 2026-02-27 | 13F/A | Barclays Plc | 0 | -100,00 | 0 | |||||
| 2026-01-21 | 13F | Apella Capital, LLC | 22.372 | -23,65 | 53 | -35,00 | ||||
| 2026-02-17 | 13F | Royal Bank Of Canada | 10.409 | -97,53 | 25 | -97,76 | ||||
| 2026-02-11 | 13F | Group One Trading, L.p. | Call | 207.100 | 3,29 | 489 | -8,10 | |||
| 2026-02-11 | 13F | Group One Trading, L.p. | Put | 28.500 | 251,85 | 67 | 219,05 | |||
| 2026-02-11 | 13F | Group One Trading, L.p. | 14.032 | -75,41 | 33 | -78,15 | ||||
| 2026-02-17 | 13F | Two Sigma Securities, Llc | 87.078 | 294,14 | 206 | 253,45 | ||||
| 2025-11-20 | 13F | First Affirmative Financial Network | 11.206 | -5,65 | 30 | 61,11 | ||||
| 2026-02-13 | 13F | Marshall Wace, Llp | 421.006 | 994 | ||||||
| 2026-01-07 | 13F | CWA Asset Management Group, LLC | 10.000 | 0,00 | 24 | -11,54 | ||||
| 2026-02-17 | 13F | Cetera Investment Advisers | 17.180 | 4,25 | 41 | -6,98 | ||||
| 2026-02-18 | 13F | Mackenzie Financial Corp | 0 | -100,00 | 0 | |||||
| 2026-02-12 | 13F | Bank Of Montreal /can/ | 62.590 | 31,62 | 148 | 19,35 | ||||
| 2026-01-23 | 13F | Farther Finance Advisors, LLC | 10 | 0 | ||||||
| 2026-02-10 | 13F | Connor, Clark & Lunn Investment Management Ltd. | 21.300 | -76,03 | 50 | -78,45 | ||||
| 2026-02-11 | 13F | Franklin Resources Inc | 8.063.835 | -15,05 | 19.069 | -23,59 | ||||
| 2026-01-08 | 13F | Wealth Enhancement Advisory Services, Llc | 76.055 | 202 | ||||||
| 2026-02-17 | 13F | Two Sigma Investments, Lp | 1.265.727 | 71,90 | 2.987 | 53,10 | ||||
| 2026-02-17 | 13F | Susquehanna International Group, Llp | 993.564 | 27,33 | 2.345 | 13,40 | ||||
| 2026-01-27 | 13F | Ninety One UK Ltd | 98.258 | 0,00 | 232 | -11,15 | ||||
| 2026-02-17 | 13F | Susquehanna International Group, Llp | Put | 79.900 | 234,31 | 189 | 198,41 | |||
| 2026-02-17 | 13F | Susquehanna International Group, Llp | Call | 33.200 | 78 | |||||
| 2026-02-12 | 13F | Federation des caisses Desjardins du Quebec | 482.200 | 12,22 | 1.127 | 4,94 | ||||
| 2026-02-13 | 13F | Rhumbline Advisers | 2.674 | 6 | ||||||
| 2026-02-17 | 13F | Millennium Management Llc | 1.313.835 | 29,17 | 3.101 | 15,06 | ||||
| 2026-02-12 | 13F | StoneX Group Inc. | 16.917 | -2,13 | 40 | -13,33 | ||||
| 2026-02-13 | 13F | Manufacturers Life Insurance Company, The | 0 | -100,00 | 0 | |||||
| 2026-02-23 | 13F | Virtu Financial LLC | 18.689 | -95,48 | 0 | -100,00 | ||||
| 2026-02-11 | 13F | Total Wealth Planning & Management, Inc. | 64.080 | -20,89 | 151 | 22,76 | ||||
| 2026-01-27 | 13F | TD Waterhouse Canada Inc. | 0 | -100,00 | 0 | |||||
| 2026-02-13 | 13F | Centiva Capital, LP | 0 | -100,00 | 0 | -100,00 | ||||
| 2026-02-17 | 13F | Qube Research & Technologies Ltd | 27.733 | 65 | ||||||
| 2025-11-12 | 13F | Creekmur Asset Management LLC | 260 | 1 | ||||||
| 2025-11-10 | 13F | Sigma Planning Corp | 0 | -100,00 | 0 | |||||
| 2026-02-17 | 13F | Two Sigma Advisers, Lp | 230.000 | 295,19 | 543 | 251,95 | ||||
| 2026-02-17 | 13F | Oxford Asset Management Llp | 36.199 | 85 | ||||||
| 2026-01-29 | 13F | UBS Group AG | 910.311 | 23,25 | 2.148 | 9,76 | ||||
| 2026-02-05 | 13F | Cambridge Investment Research Advisors, Inc. | 13.627 | 7,92 | 0 | |||||
| 2026-02-12 | 13F | Hollencrest Capital Management | 125.000 | 150,00 | 295 | 123,48 | ||||
| 2026-02-04 | 13F | BCJ Capital Management, LLC | 0 | -100,00 | 0 | |||||
| 2026-01-16 | 13F | Crewe Advisors LLC | 2.500 | 6 | ||||||
| 2026-02-17 | 13F | Schonfeld Strategic Advisors LLC | 26.786 | 63 | ||||||
| 2026-02-13 | 13F | Walleye Capital LLC | 645.963 | 1.524 | ||||||
| 2025-11-12 | 13F | BlackRock, Inc. | 0 | -100,00 | 0 | |||||
| 2026-02-10 | 13F | Goldman Sachs Group Inc | 105.412 | 249 | ||||||
| 2026-01-30 | 13F | Laurel Wealth Advisors LLC | 400 | 1 | ||||||
| 2026-02-12 | 13F | Commonwealth Equity Services, Llc | 17.552 | 41 | ||||||
| 2026-02-17 | 13F | Citadel Advisors Llc | Put | 73.100 | 330,00 | 173 | 282,22 | |||
| 2026-01-13 | 13F/A | Sanctuary Advisors, LLC | 10.000 | 0,00 | 26 | 73,33 | ||||
| 2026-01-28 | 13F | Mountain Capital Investment Advisors, Inc | 0 | -100,00 | 0 | |||||
| 2026-02-12 | 13F | Hrt Financial Lp | 117.395 | 0 | ||||||
| 2026-01-07 | 13F | Aventura Private Wealth, LLC | 880 | 0,00 | 2 | 0,00 | ||||
| 2026-02-18 | 13F | GWM Advisors LLC | 28.430 | 0,00 | 67 | -10,67 | ||||
| 2026-02-11 | 13F | J.w. Cole Advisors, Inc. | 373.911 | 10,17 | 882 | -1,89 | ||||
| 2025-10-16 | 13F | Harwood Advisory Group, LLC | 0 | -100,00 | 0 | |||||
| 2026-02-06 | 13F/A | Rathbone Brothers plc | 160.000 | 33,33 | 378 | 18,55 | ||||
| 2026-02-06 | 13F | HighTower Advisors, LLC | 0 | -100,00 | 0 | |||||
| 2025-11-14 | 13F | Cubist Systematic Strategies, LLC | 39.164 | 104 | ||||||
| 2026-02-03 | 13F | SBI Securities Co., Ltd. | 784 | -42,94 | 2 | -66,67 | ||||
| 2026-02-13 | 13F | Vivaldi Capital Management, LLC | 24.000 | 0,00 | 57 | -11,11 | ||||
| 2026-02-13 | 13F | Citigroup Inc | 13.001 | -32,85 | 31 | -40,00 | ||||
| 2026-02-02 | 13F | New England Capital Financial Advisors LLC | 1.316 | 0,00 | 3 | 0,00 | ||||
| 2025-11-24 | 13F | CIBC Private Wealth Group, LLC | 0 | -100,00 | 0 | |||||
| 2026-02-17 | 13F | Citadel Advisors Llc | 191.969 | 107,22 | 453 | 84,90 | ||||
| 2026-02-13 | 13F | Caitong International Asset Management Co., Ltd | 24.453 | 58 | ||||||
| 2026-02-17 | 13F | Citadel Advisors Llc | Call | 148.600 | 11,98 | 351 | -0,28 | |||
| 2026-02-17 | 13F | Point72 Asset Management, L.P. | 20.412 | 48 | ||||||
| 2025-11-06 | 13F | Stratos Wealth Partners, LTD. | 0 | -100,00 | 0 | |||||
| 2026-02-11 | 13F | Hilton Head Capital Partners, LLC | 45 | 0 | ||||||
| 2026-01-29 | 13F | Kestra Private Wealth Services, Llc | 13.200 | -47,62 | 31 | -53,03 | ||||
| 2026-02-13 | 13F | Mml Investors Services, Llc | 23.365 | -1,31 | 55 | -11,29 | ||||
| 2026-02-17 | 13F | Bank Of America Corp /de/ | 926.708 | 12.952,23 | 2.187 | 12.050,00 | ||||
| 2026-02-06 | 13F | Hudson Valley Investment Advisors Inc /adv | 13.150 | 0,00 | 31 | -8,82 | ||||
| 2026-02-17 | 13F | Jones Financial Companies Lllp | 2.320 | 157,78 | 5 | 150,00 | ||||
| 2026-02-05 | 13F | Baader Bank INC | 0 | -100,00 | 0 | |||||
| 2026-01-26 | 13F | PFG Investments, LLC | 12.276 | 29 | ||||||
| 2026-02-12 | 13F | Jane Street Group, Llc | 997.558 | 1.738,11 | 2.354 | 1.546,15 | ||||
| 2026-02-12 | 13F | Jane Street Group, Llc | Put | 10.600 | 25 | |||||
| 2026-02-13 | 13F | Evelyn Partners Investment Management LLP | 220 | 0,00 | 1 | |||||
| 2026-01-09 | 13F | Dynamic Advisor Solutions LLC | 13.205 | 31 | ||||||
| 2025-11-14 | 13F | Raymond James Financial Inc | 0 | -100,00 | 0 | |||||
| 2026-02-11 | 13F | LPL Financial LLC | 25.320 | 35,72 | 60 | 20,41 | ||||
| 2026-02-13 | 13F | Morgan Stanley | 132.473 | -21,12 | 313 | -29,89 | ||||
| 2026-02-17 | 13F | XTX Topco Ltd | 19.368 | -83,09 | 46 | -85,15 | ||||
| 2025-11-14 | 13F | Wolverine Trading, Llc | 18.308 | 39,32 | 49 | 157,89 | ||||
| 2025-11-14 | 13F | Wolverine Trading, Llc | Call | 33.000 | 89 | |||||
| 2026-02-14 | 13F | Rockefeller Capital Management L.P. | 4.000 | 0,00 | 9 | -10,00 | ||||
| 2025-09-23 | NP | FKRCX - Franklin Gold & Precious Metals Fund Class A | 10.000 | -72,70 | 15 | -74,07 |