Grundlæggende statistik
| Institutionelle ejere | 166 total, 153 long only, 2 short only, 11 long/short - change of 7,79% MRQ |
| Del pris | 6,48 |
| Gennemsnitlig porteføljeallokering | 0.1518 % - change of 15,92% MRQ |
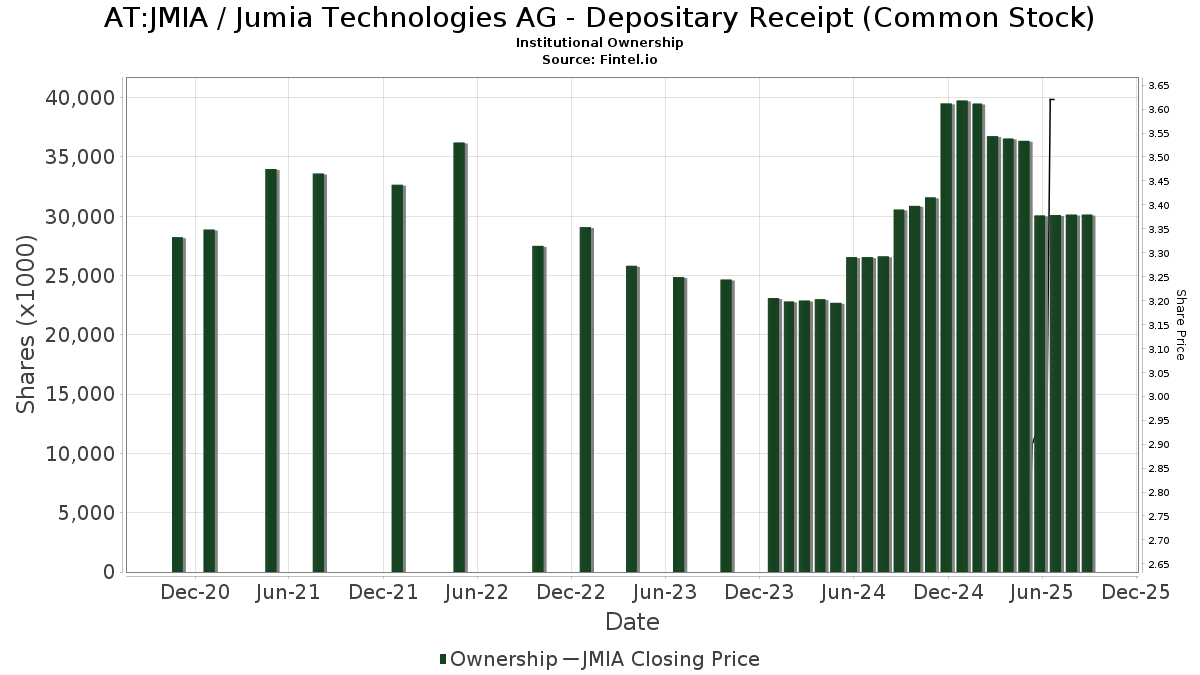
| Institutionelle aktier (lange) | 31.999.133 (ex 13D/G) - change of 4,20MM shares 15,12% MRQ |
| Institutionel værdi (lang) | $ 393.361 USD ($1000) |
Institutionelt ejerskab og aktionærer
Jumia Technologies AG - Depositary Receipt (Common Stock) (AT:JMIA) har 166 institutionelle ejere og aktionærer, der har indsendt 13D/G- eller 13F-formularer til Securities Exchange Commission (SEC). Disse institutioner har i alt 31,999,133 aktier. Største aktionærer omfatter Fund 1 Investments, LLC, D. E. Shaw & Co., Inc., Nomura Holdings Inc, Two Sigma Investments, Lp, UBS Group AG, Morgan Stanley, Jane Street Group, Llc, Susquehanna International Group, Llp, Two Sigma Advisers, Lp, and Susquehanna International Group, Llp .
Jumia Technologies AG - Depositary Receipt (Common Stock) (WBAG:JMIA) institutionel ejerskabsstruktur viser aktuelle positioner i virksomheden efter institutioner og fonde, samt seneste ændringer i positionsstørrelse. Større aktionærer kan omfatte individuelle investorer, investeringsforeninger, hedgefonde eller institutioner. Skema 13D angiver, at investoren besidder (eller besidder) mere end 5 % af virksomheden og har til hensigt (eller har til hensigt at) aktivt at forfølge en ændring i forretningsstrategi. Skema 13G indikerer en passiv investering på over 5%.
The share price as of March 17, 2026 is 6,48 / share. Previously, on May 9, 2025, the share price was 2,78 / share. This represents an increase of 133,09% over that period.
Fondens stemningsscore
Fund Sentiment Score (fka Ownership Accumulation Score) finder de aktier, der bliver mest købt af fonde. Det er resultatet af en sofistikeret, multi-faktor kvantitativ model, der identificerer virksomheder med de højeste niveauer af institutionel akkumulering. Scoringsmodellen bruger en kombination af den samlede stigning i oplyste ejere, ændringerne i porteføljeallokeringer i disse ejere og andre målinger. Tallet går fra 0 til 100, hvor højere tal indikerer et højere niveau af akkumulering for sine jævnaldrende, og 50 er gennemsnittet.
Opdateringsfrekvens: Dagligt
Se Ownership Explorer, som giver en liste over højest rangerende virksomheder.
AI+ Ask Fintel’s AI assistant about Jumia Technologies AG - Depositary Receipt (Common Stock).
Select a question to share a public post with an AI-crafted answer.
Thinking of good questions…
13F og NPORT arkivering
Detaljer om 13F-arkivering er gratis. Detaljer om NP-ansøgninger kræver et premium-medlemskab. Grønne rækker angiver nye positioner. Røde rækker angiver lukkede positioner. Klik på linket ikon for at se den fulde transaktionshistorik.
Opgrader
for at låse premium-data op og eksportere til Excel ![]() .
.
| Fil dato | Kilde | Investor | Type | Gennemsnitlig pris (Øst) |
Aktier | Δ Aktier (%) |
Rapporteret Værdi ($1000) |
Δ Værdi (%) |
Port Alloc (%) |
|
|---|---|---|---|---|---|---|---|---|---|---|
| 2026-02-12 | 13F | Federation des caisses Desjardins du Quebec | 9.797 | 29,30 | 122 | 40,23 | ||||
| 2026-02-17 | 13F | Advisory Services Network, LLC | 0 | -100,00 | 0 | |||||
| 2026-02-17 | 13F | D. E. Shaw & Co., Inc. | Call | 268.800 | 119,97 | 3.357 | 136,74 | |||
| 2026-02-13 | 13F | Centiva Capital, LP | 0 | -100,00 | 0 | |||||
| 2026-02-02 | 13F | Truist Financial Corp | 0 | -100,00 | 0 | |||||
| 2026-02-17 | 13F | D. E. Shaw & Co., Inc. | 4.059.288 | 4,78 | 50.701 | 12,72 | ||||
| 2026-02-12 | 13F | Wealthspire Advisors, LLC | 0 | -100,00 | 0 | |||||
| 2026-02-10 | 13F | Belvedere Trading LLC | 16.690 | 208 | ||||||
| 2026-02-05 | 13F | Allworth Financial LP | 2.045 | 3,18 | 26 | 8,70 | ||||
| 2026-02-17 | 13F | Fund 1 Investments, LLC | 8.755.298 | 32,85 | 109.354 | 42,92 | ||||
| 2026-02-17 | 13F | Fund 1 Investments, LLC | Call | 500.000 | -83,33 | 6.245 | -82,07 | |||
| 2026-02-09 | 13F | MRP Capital Investments, LLC | 500 | 0,00 | 6 | 200,00 | ||||
| 2025-11-20 | 13F | First Affirmative Financial Network | 0 | -100,00 | 0 | |||||
| 2026-02-11 | 13F | Winnow Wealth Llc | 400 | 5 | ||||||
| 2026-02-17 | 13F | National Asset Management, Inc. | Call | 0 | -100,00 | 0 | ||||
| 2025-11-14 | 13F | Cubist Systematic Strategies, LLC | 134.904 | 1.566 | ||||||
| 2026-02-12 | 13F | Insigneo Advisory Services, Llc | 65.500 | -1,43 | 818 | 6,10 | ||||
| 2025-11-14 | 13F | Cubist Systematic Strategies, LLC | Put | 297.800 | 3.457 | |||||
| 2026-02-10 | 13F | Daiwa Securities Group Inc. | 5.317 | -68,71 | 0 | |||||
| 2025-11-14 | 13F | Cubist Systematic Strategies, LLC | Call | 211.600 | 2.457 | |||||
| 2026-02-17 | 13F | Jump Financial, LLC | 27.517 | -93,63 | 344 | -93,17 | ||||
| 2026-02-13 | 13F | Dynamic Technology Lab Private Ltd | 16.251 | 203 | ||||||
| 2026-01-29 | 13F | IMC-Chicago, LLC | 188.866 | 2.359 | ||||||
| 2025-11-05 | 13F | J.w. Cole Advisors, Inc. | 0 | -100,00 | 0 | |||||
| 2025-09-29 | NP | EBIZ - Global X E-commerce ETF This fund is a listed as child fund of Mirae Asset Global Investments Co., Ltd. and if that institution has disclosed ownership in this security, then these positions will not be double counted when calculating total shares and total value | 62.682 | 7,24 | 294 | 112,32 | ||||
| 2026-01-29 | 13F | IMC-Chicago, LLC | Put | 244.300 | 40,73 | 3.051 | 51,41 | |||
| 2026-02-17 | 13F | National Asset Management, Inc. | 0 | -100,00 | 0 | |||||
| 2026-01-29 | 13F | IMC-Chicago, LLC | Call | 555.300 | 29,32 | 6.936 | 39,12 | |||
| 2026-02-13 | 13F | Walleye Capital LLC | Call | 0 | -100,00 | 0 | -100,00 | |||
| 2026-02-13 | 13F | WealthTrust Axiom LLC | 17.580 | -12,65 | 220 | -6,01 | ||||
| 2025-11-14 | 13F | Parallax Volatility Advisers, L.P. | Call | 0 | -100,00 | 0 | ||||
| 2025-11-06 | 13F | Ameritas Advisory Services, LLC | 0 | -100,00 | 0 | |||||
| 2026-02-11 | 13F | Modus Advisors, LLC | 20.000 | 250 | ||||||
| 2026-02-11 | 13F | LPL Financial LLC | 187.778 | -2,70 | 2.345 | 4,69 | ||||
| 2026-02-17 | 13F | XTX Topco Ltd | 76.852 | 88,13 | 960 | 102,32 | ||||
| 2026-02-17 | 13F | Susquehanna International Group, Llp | Put | 317.900 | 4,74 | 3.971 | 12,69 | |||
| 2026-02-17 | 13F | Susquehanna International Group, Llp | Call | 894.900 | 1,46 | 11.177 | 9,15 | |||
| 2026-02-13 | 13F | Colony Group, LLC | 12.235 | 153 | ||||||
| 2026-02-17 | 13F | Susquehanna International Group, Llp | 1.200.472 | 10,32 | 14.994 | 18,67 | ||||
| 2026-02-17 | 13F | Citadel Advisors Llc | 231.080 | -82,51 | 2.886 | -81,18 | ||||
| 2026-02-17 | 13F | Citadel Advisors Llc | Call | 715.000 | -2,28 | 8.930 | 5,12 | |||
| 2026-02-17 | 13F | Tower Research Capital LLC (TRC) | 568 | 667,57 | 7 | |||||
| 2026-02-17 | 13F | Citadel Advisors Llc | Put | 127.000 | 13,60 | 1.586 | 22,28 | |||
| 2026-02-17 | 13F | one8zero8, LLC | 167.800 | 20,89 | 2.096 | 30,04 | ||||
| 2026-02-17 | 13F | EFG International AG | 38.212 | 477 | ||||||
| 2026-01-23 | 13F | Octavia Wealth Advisors, LLC | 14.500 | 0,00 | 181 | 7,74 | ||||
| 2026-02-09 | 13F | Fisher Asset Management, LLC | 0 | -100,00 | 0 | |||||
| 2026-01-30 | 13F | Us Bancorp \de\ | 134 | 0,00 | 2 | 0,00 | ||||
| 2026-02-17 | 13F | MIRAE ASSET GLOBAL ETFS HOLDINGS Ltd. | 52.506 | -11,29 | 656 | -4,66 | ||||
| 2026-02-17 | 13F | SageView Advisory Group, LLC | 115 | 1 | ||||||
| 2026-02-06 | 13F | IFP Advisors, Inc | 100 | 0,00 | 1 | 0,00 | ||||
| 2026-02-17 | 13F | Raymond James Financial Inc | 142.338 | 1.778 | ||||||
| 2026-01-28 | 13F | Financial Perspectives, Inc | 34 | 0,00 | 0 | |||||
| 2026-02-17 | 13F | Creative Planning | 25.802 | 5,77 | 322 | 13,78 | ||||
| 2026-02-05 | 13F | Cambridge Investment Research Advisors, Inc. | 49.984 | 320,88 | 1 | |||||
| 2025-11-03 | 13F | Crumly & Associates Inc. | 0 | -100,00 | 0 | |||||
| 2026-01-29 | 13F | UBS Group AG | Call | 1.661.200 | 20.748 | |||||
| 2026-01-29 | 13F | UBS Group AG | 427.263 | -11,93 | 5.337 | -5,26 | ||||
| 2026-02-17 | 13F | Two Sigma Advisers, Lp | 956.007 | 14,96 | 11.941 | 23,68 | ||||
| 2025-11-19 | 13F | Sunbelt Securities, Inc. | 0 | -100,00 | 0 | |||||
| 2026-02-11 | 13F | Jpmorgan Chase & Co | 139.515 | 67.625,73 | 1.743 | 87.000,00 | ||||
| 2026-02-03 | 13F | SBI Securities Co., Ltd. | 536.568 | 15,18 | 6.702 | 23,91 | ||||
| 2026-02-17 | 13F | Advisor Group Holdings, Inc. | 36.770 | -14,97 | 459 | 12,50 | ||||
| 2026-02-13 | 13F | Squarepoint Ops LLC | 0 | -100,00 | 0 | -100,00 | ||||
| 2026-02-10 | 13F/A | Northwestern Mutual Wealth Management Co | 5 | -91,38 | 0 | |||||
| 2026-02-13 | 13F | MYDA Advisors LLC | Call | 60.000 | 749 | |||||
| 2026-01-07 | 13F | Boston Standard Wealth Management, LLC | 19.092 | -1,29 | 238 | 5,78 | ||||
| 2026-02-17 | 13F | Prostatis Group LLC | 0 | -100,00 | 0 | |||||
| 2026-02-12 | 13F | Principal Securities, Inc. | 0 | -100,00 | 0 | -100,00 | ||||
| 2026-02-13 | 13F | MYDA Advisors LLC | 60.000 | 749 | ||||||
| 2026-02-17 | 13F | SIH Partners, LLLP | 62.032 | 775 | ||||||
| 2026-02-13 | 13F | MAI Capital Management | 410 | 95,24 | 5 | 150,00 | ||||
| 2026-02-17 | 13F | Balyasny Asset Management Llc | 172.386 | 35,28 | 2.153 | 45,57 | ||||
| 2026-02-04 | 13F | Raelipskie Partnership | 2.450 | 0,00 | 31 | 7,14 | ||||
| 2026-02-17 | 13F | Massar Capital Management, LP | 198.495 | 2.479 | ||||||
| 2026-02-17 | 13F | General Equity Holdings LP | 653.029 | 79,85 | 8.156 | 93,50 | ||||
| 2026-02-03 | 13F | Mitsubishi UFJ Kokusai Asset Management Co., Ltd. | 24.989 | -67,79 | 321 | -64,44 | ||||
| 2026-02-13 | 13F | Kilter Group LLC | 200 | -60,00 | 2 | -60,00 | ||||
| 2026-02-17 | 13F | Nomura Holdings Inc | 3.213.173 | 595,99 | 40.133 | 648,87 | ||||
| 2025-09-24 | NP | ISCF - iShares Edge MSCI Multifactor Intl Small-Cap ETF | 82.548 | 15,03 | 387 | 127,65 | ||||
| 2026-02-13 | 13F | SRS Capital Advisors, Inc. | 405 | 5 | ||||||
| 2026-02-12 | 13F | BlackRock, Inc. | 135.679 | -7,56 | 1.695 | -0,59 | ||||
| 2026-02-12 | 13F | Skopos Labs, Inc. | 24.367 | 129,10 | 283 | 130,08 | ||||
| 2026-01-07 | 13F | Qp Wealth Management, Llc | 41.095 | 513 | ||||||
| 2026-02-17 | 13F | Jones Financial Companies Lllp | 34.468 | 2,17 | 431 | 12,27 | ||||
| 2026-02-11 | 13F | Franklin Resources Inc | 231.700 | 2.894 | ||||||
| 2026-02-13 | 13F | Wells Fargo & Company/mn | 97.943 | 5,75 | 1.223 | 13,77 | ||||
| 2026-02-12 | 13F | Triumph Capital Management | 500 | 6 | ||||||
| 2026-02-13 | 13F | Toroso Investments, LLC | 37.175 | 464 | ||||||
| 2026-01-21 | 13F | Sound Income Strategies, LLC | 1.857 | 0,00 | 23 | 0,00 | ||||
| 2026-02-11 | 13F | Fox Run Management, L.l.c. | 0 | -100,00 | 0 | |||||
| 2026-02-13 | 13F | Caitong International Asset Management Co., Ltd | 3.770 | 2.066,67 | 47 | 2.250,00 | ||||
| 2026-02-17 | 13F | PharVision Advisers, LLC | 27.234 | 340 | ||||||
| 2026-02-17 | 13F | Brevan Howard Capital Management LP | 0 | -100,00 | 0 | -100,00 | ||||
| 2026-02-17 | 13F | Toronto Dominion Bank | Call | 68.400 | 839 | |||||
| 2025-11-13 | 13F | Clear Street Markets Llc | Call | 0 | -100,00 | 0 | ||||
| 2026-02-09 | 13F | Harbour Investments, Inc. | 50 | 0,00 | 1 | |||||
| 2026-02-17 | 13F | Hood River Capital Management LLC | 110.767 | 1.383 | ||||||
| 2026-02-11 | 13F | Simplex Trading, Llc | Put | 328.600 | -1,17 | 4.104 | 136.700,00 | |||
| 2026-02-17 | 13F | Voloridge Investment Management, Llc | 0 | -100,00 | 0 | |||||
| 2026-02-11 | 13F | Simplex Trading, Llc | 258.418 | -1,35 | 3.228 | 107.466,67 | ||||
| 2026-02-13 | 13F | Manufacturers Life Insurance Company, The | 19.653 | 4,01 | 245 | 11,87 | ||||
| 2025-09-26 | NP | UEPIX - Europe 30 Profund Investor Class | 19.218 | 24,68 | 90 | 150,00 | ||||
| 2026-02-17 | 13F | Capital Fund Management S.a. | 119.299 | 1.490 | ||||||
| 2026-02-11 | 13F | Simplex Trading, Llc | Call | 101.900 | -46,87 | 1.273 | 63.500,00 | |||
| 2026-02-17 | 13F | Ameriprise Financial Inc | 18.666 | -8,48 | 233 | -1,27 | ||||
| 2026-01-16 | 13F | Compagnie Lombard Odier SCmA | 4.000 | 0,00 | 50 | 6,52 | ||||
| 2026-01-23 | 13F | Farther Finance Advisors, LLC | 14.048 | 3,19 | 175 | 10,76 | ||||
| 2026-02-12 | 13F | Quadrant Capital Group Llc | 3.578 | 0,00 | 45 | 7,32 | ||||
| 2026-02-17 | 13F | Trexquant Investment LP | 146.029 | 1.824 | ||||||
| 2026-02-10 | 13F | Acadian Asset Management Llc | 0 | -100,00 | 0 | |||||
| 2026-02-10 | 13F | Financially Speaking Inc | 1.000 | 0,00 | 12 | 9,09 | ||||
| 2026-02-17 | 13F | Millennium Management Llc | 59.223 | -75,48 | 740 | -73,64 | ||||
| 2026-01-22 | 13F | Bfsg, Llc | 350 | 0,00 | 4 | 0,00 | ||||
| 2026-02-17 | 13F | Cetera Investment Advisers | Call | 1.500 | 7,14 | 2 | 0,00 | |||
| 2026-02-17 | 13F | Royal Bank Of Canada | 10.309 | 104,87 | 128 | 120,69 | ||||
| 2026-02-17 | 13F | Spears Abacus Advisors LLC | 40.000 | 500 | ||||||
| 2026-02-17 | 13F | Cetera Investment Advisers | 20.850 | -7,36 | 260 | -0,38 | ||||
| 2026-01-13 | 13F | CoreCap Advisors, LLC | 0 | -100,00 | 0 | |||||
| 2026-02-13 | 13F | Citigroup Inc | 985 | -2,86 | 12 | 9,09 | ||||
| 2026-02-17 | 13F | Mangrove Partners | 15.629 | 195 | ||||||
| 2026-02-13 | 13F | Altrafin AG | 0 | -100,00 | 0 | |||||
| 2026-01-26 | 13F | PDS Planning, Inc | 14.552 | 0,00 | 182 | 7,74 | ||||
| 2026-02-10 | 13F | Goldman Sachs Group Inc | 61.393 | -95,69 | 767 | -95,36 | ||||
| 2026-02-06 | 13F | Global Retirement Partners, LLC | 3.800 | 0,00 | 47 | 6,82 | ||||
| 2026-02-10 | 13F | Goldman Sachs Group Inc | Call | 462.300 | 96,06 | 5.774 | 110,96 | |||
| 2026-01-20 | 13F | AdvisorNet Financial, Inc | 5.400 | 0,00 | 67 | 8,06 | ||||
| 2026-02-09 | 13F | Huntington National Bank | 3.000 | 0,00 | 37 | 8,82 | ||||
| 2026-01-28 | 13F | Key Client Fiduciary Advisors, LLC | 17.397 | -11,46 | 217 | -4,82 | ||||
| 2026-02-17 | 13F | Clear Street Markets Llc | 716 | 9 | ||||||
| 2026-02-12 | 13F | CIBC Private Wealth Group, LLC | 50 | 0,00 | 1 | |||||
| 2026-02-06 | 13F | FourThought Financial Partners, LLC | 18.471 | 231 | ||||||
| 2026-02-13 | 13F | National Bank Of Canada /fi/ | 750 | -99,76 | 9 | -99,76 | ||||
| 2026-02-10 | 13F | Bnp Paribas Arbitrage, Sa | 121.646 | 481,54 | 1.519 | 527,69 | ||||
| 2026-02-12 | 13F | Commonwealth Equity Services, Llc | 25.696 | -2,72 | 321 | |||||
| 2025-11-14 | 13F | Wolverine Trading, Llc | 40.034 | -12,26 | 479 | 188,55 | ||||
| 2025-11-10 | 13F | Atomi Financial Group, Inc. | 0 | -100,00 | 0 | -100,00 | ||||
| 2025-11-14 | 13F | Wolverine Trading, Llc | Call | 222.200 | 49,73 | 2.660 | 389,69 | |||
| 2025-11-14 | 13F | Wolverine Trading, Llc | Put | 40.100 | 71,37 | 480 | 463,53 | |||
| 2026-01-05 | 13F | GAMMA Investing LLC | 9.734 | 7,06 | 122 | 15,24 | ||||
| 2025-10-28 | 13F | Ritholtz Wealth Management | 0 | -100,00 | 0 | |||||
| 2026-02-17 | 13F | Schonfeld Strategic Advisors LLC | 0 | -100,00 | 0 | |||||
| 2026-02-13 | 13F | Walleye Trading LLC | Call | 79.600 | -38,05 | 994 | -33,33 | |||
| 2026-02-13 | 13F | Walleye Trading LLC | 24.471 | 306 | ||||||
| 2026-01-26 | 13F | Wealth Effects Llc | 58.560 | -27,76 | 731 | -22,32 | ||||
| 2026-01-08 | 13F | Versant Capital Management, Inc | 382 | 0,00 | 5 | 0,00 | ||||
| 2026-02-13 | 13F | Walleye Trading LLC | Put | 49.900 | -37,86 | 623 | -33,15 | |||
| 2025-11-14 | 13F | Brown Advisory Inc | 0 | -100,00 | 0 | |||||
| 2026-03-11 | 13F | Leonteq Securities AG | 0 | -100,00 | 0 | |||||
| 2026-02-03 | 13F | RFG Advisory, LLC | 10.421 | 4,21 | 130 | 12,07 | ||||
| 2026-02-13 | 13F | Marshall Wace, Llp | 17.100 | -75,87 | 214 | -74,09 | ||||
| 2026-02-12 | 13F | Hrt Financial Lp | 174.700 | 244,58 | 2 | |||||
| 2026-02-17 | 13F | Crawford Fund Management, LLC | Put | 105.500 | 66,14 | 1.318 | 78,70 | |||
| 2026-01-20 | 13F | Signaturefd, Llc | 592 | -55,69 | 7 | -53,33 | ||||
| 2026-02-13 | 13F | State Street Corp | 502.461 | -43,59 | 6.276 | -39,33 | ||||
| 2026-02-06 | 13F | Profund Advisors Llc | 0 | -100,00 | 0 | |||||
| 2026-02-17 | 13F | Cantor Fitzgerald, L. P. | Call | 100.000 | 1.249 | |||||
| 2026-02-12 | 13F | Jane Street Group, Llc | 1.375.071 | 266,05 | 17.175 | 293,81 | ||||
| 2026-02-13 | 13F | Squarepoint Ops LLC | Put | 18.900 | 9,88 | 236 | 18,59 | |||
| 2026-02-12 | 13F | Jane Street Group, Llc | Call | 621.100 | 1.247,29 | 7.758 | 1.349,91 | |||
| 2026-02-12 | 13F | Jane Street Group, Llc | Put | 23.300 | 291 | |||||
| 2026-01-14 | 13F | Exchange Traded Concepts, Llc | 55.855 | 698 | ||||||
| 2026-02-17 | 13F | Shay Capital LLC | 214.200 | 2.675 | ||||||
| 2026-02-17 | 13F | Shay Capital LLC | Call | 796.100 | 9.943 | |||||
| 2026-02-10 | 13F | Lido Advisors, LLC | 12.214 | 0,00 | 146 | 3,55 | ||||
| 2026-02-12 | 13F | Steward Partners Investment Advisory, Llc | 19.221 | -28,07 | 240 | -22,58 | ||||
| 2026-02-17 | 13F | Lazard Asset Management Llc | 121.643 | 1.519 | ||||||
| 2026-01-30 | 13F | Archer Investment Corp | 450 | 0,00 | 6 | 0,00 | ||||
| 2026-02-17 | 13F | Private Advisor Group, LLC | 23.743 | -4,01 | 297 | 3,14 | ||||
| 2026-02-17 | 13F | Susquehanna Portfolio Strategies, LLC | 29.878 | 0,00 | 373 | 7,80 | ||||
| 2026-02-03 | 13F | International Assets Investment Management, Llc | 21.150 | -42,45 | 264 | 54,39 | ||||
| 2026-01-07 | 13F | Central Pacific Bank - Trust Division | 11.921 | 0,00 | 149 | 7,25 | ||||
| 2026-02-04 | 13F | Dogwood Wealth Management LLC | 175 | 0,00 | 2 | 0,00 | ||||
| 2025-12-09 | 13F/A | Tudor Investment Corp Et Al | 44.692 | 519 | ||||||
| 2025-10-17 | 13F | Retireful, LLC | 0 | -100,00 | 0 | -100,00 | ||||
| 2025-11-12 | 13F | HAP Trading, LLC | 85.059 | 988 | ||||||
| 2026-02-13 | 13F | National Bank Of Canada /fi/ | Put | 0 | -100,00 | 0 | ||||
| 2026-02-12 | 13F | Marex Group plc | 55.000 | 0,00 | 687 | 7,52 | ||||
| 2026-02-14 | 13F | Rockefeller Capital Management L.P. | 0 | -100,00 | 0 | |||||
| 2026-02-10 | 13F | Root Financial Partners, LLC | 0 | -100,00 | 0 | |||||
| 2026-02-17 | 13F | Engineers Gate Manager LP | 26.055 | 325 | ||||||
| 2026-02-13 | 13F | JustInvest LLC | 19.473 | 1,32 | 243 | 8,97 | ||||
| 2026-01-30 | 13F | Samalin Investment Counsel, LLC | 12.260 | 153 | ||||||
| 2026-02-13 | 13F | Barclays Plc | 20.500 | 7,89 | 256 | 16,36 | ||||
| 2026-02-17 | 13F | Laird Norton Trust Company, Llc | 129.669 | 11,47 | 1.620 | 19,93 | ||||
| 2026-02-13 | 13F | Quarry LP | 1.839 | 11,59 | 23 | 15,79 | ||||
| 2026-02-06 | 13F | Gsa Capital Partners Llp | 74.392 | 2,08 | 1 | |||||
| 2026-02-13 | 13F | Headlands Technologies LLC | 94.099 | 25,64 | 1.175 | 35,21 | ||||
| 2026-02-11 | 13F | Group One Trading, L.p. | Put | 368.900 | -45,91 | 4.608 | -41,82 | |||
| 2026-02-11 | 13F | Group One Trading, L.p. | Call | 833.800 | 3,31 | 10.414 | 11,14 | |||
| 2026-02-11 | 13F | Group One Trading, L.p. | 450.176 | 94,22 | 5.623 | 109,00 | ||||
| 2026-02-17 | 13F | Aquatic Capital Management LLC | 0 | -100,00 | 0 | |||||
| 2026-02-13 | 13F | Y-Intercept (Hong Kong) Ltd | 27.695 | 346 | ||||||
| 2026-02-17 | 13F | Caption Management, LLC | 18.000 | 225 | ||||||
| 2026-02-17 | 13F | Caption Management, LLC | Call | 50.000 | 624 | |||||
| 2026-01-30 | 13F | Activest Wealth Management | 1.001 | 0,00 | 13 | 9,09 | ||||
| 2026-02-12 | 13F | Bank Of Montreal /can/ | 120.903 | -43,67 | 1.510 | -39,38 | ||||
| 2026-02-17 | 13F | Point72 Asset Management, L.P. | Call | 225.500 | 2.816 | |||||
| 2026-01-27 | 13F | Zurcher Kantonalbank (Zurich Cantonalbank) | 10.225 | 128 | ||||||
| 2026-02-17 | 13F | Point72 Asset Management, L.P. | 265.578 | 44,42 | 3.317 | 55,36 | ||||
| 2026-02-17 | 13F | Point72 Asset Management, L.P. | Put | 217.100 | 2.712 | |||||
| 2026-02-06 | 13F | GPS Wealth Strategies Group, LLC | 500 | 0,00 | 6 | 20,00 | ||||
| 2026-02-13 | 13F | Walleye Capital LLC | 1 | -100,00 | 0 | -100,00 | ||||
| 2026-02-13 | 13F | Walleye Capital LLC | Put | 14.500 | -65,39 | 181 | -62,76 | |||
| 2026-02-17 | 13F | Cantor Fitzgerald, L. P. | 0 | -100,00 | 0 | -100,00 | ||||
| 2026-02-12 | 13F | Scotia Capital Inc. | 10.000 | 0,00 | 125 | 6,90 | ||||
| 2026-02-17 | 13F | Two Sigma Investments, Lp | 1.724.662 | -1,03 | 21.541 | 6,47 | ||||
| 2026-01-07 | 13F | Yeomans Consulting Group, Inc. | 28.780 | -26,38 | 359 | -22,13 | ||||
| 2026-02-17 | 13F | Blair William & Co/il | 13.700 | -15,43 | 171 | -9,04 | ||||
| 2026-02-12 | 13F | Groupe la Francaise | 0 | -100,00 | 0 | |||||
| 2026-01-27 | 13F | TD Waterhouse Canada Inc. | 2.074 | -9,98 | 26 | -7,41 | ||||
| 2026-01-21 | 13F | Stone House Investment Management, LLC | 3.350 | 0,00 | 42 | 7,89 | ||||
| 2026-01-21 | 13F | Flagship Harbor Advisors, Llc | 200 | 2 | ||||||
| 2026-02-17 | 13F | Prelude Capital Management, Llc | 27.500 | 27,91 | 343 | 37,75 | ||||
| 2026-01-28 | 13F | Geneos Wealth Management Inc. | 50 | 0,00 | 1 | |||||
| 2025-11-14 | 13F | Peak6 Llc | Call | 0 | -100,00 | 0 | ||||
| 2026-02-13 | 13F | Morgan Stanley | 1.595.217 | 72,65 | 19.924 | 85,74 | ||||
| 2026-02-13 | 13F | Banque Transatlantique SA | 110 | 0,00 | 1 | 0,00 | ||||
| 2026-02-13 | 13F | Kestra Advisory Services, LLC | 4.344 | 54 | ||||||
| 2026-02-17 | 13F | Bank Of America Corp /de/ | 52.167 | -83,31 | 652 | -82,06 | ||||
| 2026-02-13 | 13F | Verition Fund Management LLC | 147.583 | 19,36 | 1.843 | 28,43 | ||||
| 2026-01-26 | 13F | Cwm, Llc | 47.806 | -8,99 | 1 | |||||
| 2026-01-14 | 13F | ORG Partners LLC | 100 | 0,00 | 1 | 0,00 | ||||
| 2026-01-27 | 13F | Revisor Wealth Management LLC | 185.350 | 0,00 | 2.347 | -1,72 | ||||
| 2026-02-06 | 13F | Pnc Financial Services Group, Inc. | 2.400 | 0,00 | 30 | 7,41 | ||||
| 2026-02-19 | 13F | Mcguire Capital Advisors Inc | 800 | 10 | ||||||
| 2026-02-11 | 13F | Parallel Advisors, LLC | 1.264 | 8,97 | 16 | 15,38 | ||||
| 2026-02-18 | 13F | GWM Advisors LLC | 500 | 6 | ||||||
| 2026-02-06 | 13F | EverSource Wealth Advisors, LLC | 4.167 | -10,56 | 52 | -3,70 | ||||
| 2026-02-17 | 13F | Ninepoint Partners LP | 113 | 1 | ||||||
| 2026-01-23 | 13F | Valley National Advisers Inc | 200 | 0,00 | 0 | |||||
| 2026-02-02 | 13F | Nkcfo Llc | 25.000 | 0 | ||||||
| 2026-02-13 | 13F | Rhumbline Advisers | 1.390 | 0,36 | 17 | 6,25 | ||||
| 2026-02-10 | 13F | Quantbot Technologies LP | 0 | -100,00 | 0 | |||||
| 2025-11-14 | 13F | Point72 (DIFC) Ltd | 0 | -100,00 | 0 |