Grundlæggende statistik
| Institutionelle ejere | 115 total, 115 long only, 0 short only, 0 long/short - change of -4,13% MRQ |
| Gennemsnitlig porteføljeallokering | 0.1871 % - change of -9,17% MRQ |
| Institutionelle aktier (lange) | 2.846.934 (ex 13D/G) - change of -0,02MM shares -0,66% MRQ |
| Institutionel værdi (lang) | $ 122.018 USD ($1000) |
Institutionelt ejerskab og aktionærer
Invesco Exchange-Traded Fund Trust II - Invesco S&P SmallCap Low Volatility ETF (US:XSLV) har 115 institutionelle ejere og aktionærer, der har indsendt 13D/G- eller 13F-formularer til Securities Exchange Commission (SEC). Disse institutioner har i alt 2,846,934 aktier. Største aktionærer omfatter Venturi Wealth Management, LLC, LPL Financial LLC, Armbruster Capital Management, Inc., UBS Group AG, Bank Of America Corp /de/, Brookstone Capital Management, Morgan Stanley, Commonwealth Equity Services, Llc, Wells Fargo & Company/mn, and Eagle Bluffs Wealth Management LLC .
Invesco Exchange-Traded Fund Trust II - Invesco S&P SmallCap Low Volatility ETF (ARCA:XSLV) institutionel ejerskabsstruktur viser aktuelle positioner i virksomheden efter institutioner og fonde, samt seneste ændringer i positionsstørrelse. Større aktionærer kan omfatte individuelle investorer, investeringsforeninger, hedgefonde eller institutioner. Skema 13D angiver, at investoren besidder (eller besidder) mere end 5 % af virksomheden og har til hensigt (eller har til hensigt at) aktivt at forfølge en ændring i forretningsstrategi. Skema 13G indikerer en passiv investering på over 5%.
The share price as of September 15, 2025 is 47,06 / share. Previously, on September 16, 2024, the share price was 47,83 / share. This represents a decline of 1,61% over that period.

Fondens stemningsscore
Fund Sentiment Score (fka Ownership Accumulation Score) finder de aktier, der bliver mest købt af fonde. Det er resultatet af en sofistikeret, multi-faktor kvantitativ model, der identificerer virksomheder med de højeste niveauer af institutionel akkumulering. Scoringsmodellen bruger en kombination af den samlede stigning i oplyste ejere, ændringerne i porteføljeallokeringer i disse ejere og andre målinger. Tallet går fra 0 til 100, hvor højere tal indikerer et højere niveau af akkumulering for sine jævnaldrende, og 50 er gennemsnittet.
Opdateringsfrekvens: Dagligt
Se Ownership Explorer, som giver en liste over højest rangerende virksomheder.
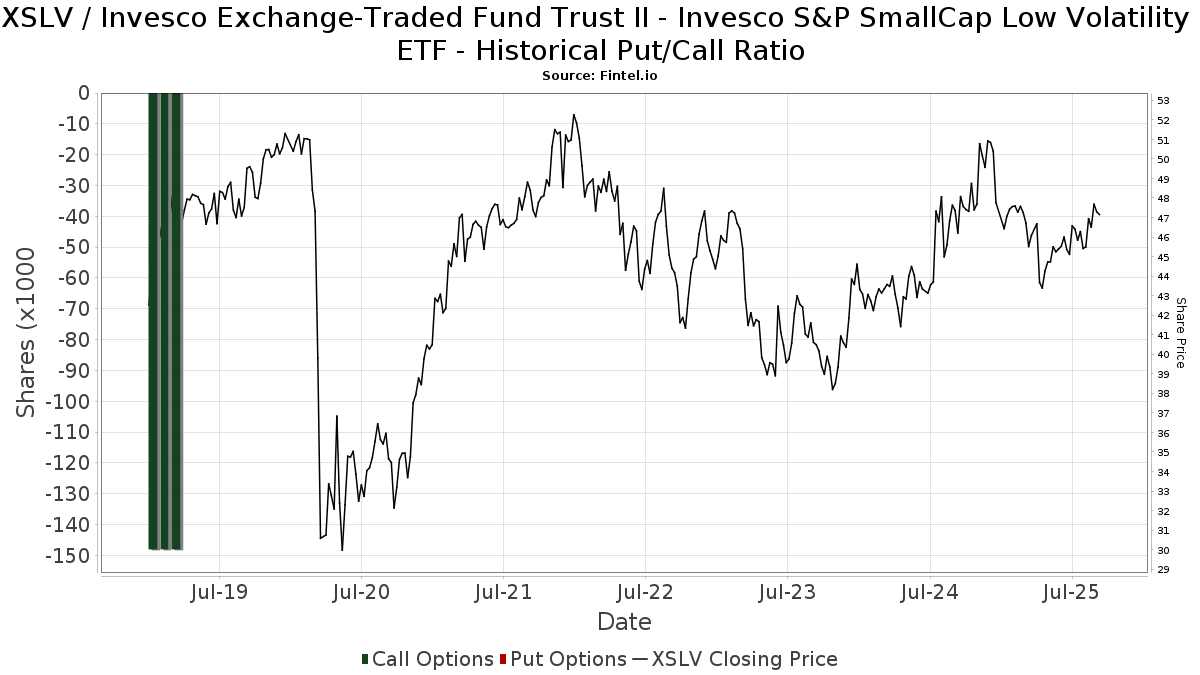
Institutionel Put/Call-forhold
Ud over at indberette standardaktie- og gældsudstedelser skal institutter med mere end 100 mill. aktiver under forvaltning også oplyse deres put- og call-optionsbeholdninger. Da salgsoptioner generelt indikerer negativ stemning, og købsoptioner indikerer positiv stemning, kan vi få en fornemmelse af den overordnede institutionelle stemning ved at plotte forholdet mellem put og kald. Diagrammet til højre viser det historiske put/call-forhold for dette instrument.
Brug af Put/Call Ratio som en indikator for investorernes stemning overvinder en af de vigtigste mangler ved at bruge totalt institutionelt ejerskab, som er, at en betydelig mængde af aktiver under forvaltning investeres passivt for at spore indekser. Passivt forvaltede fonde køber typisk ikke optioner, så indikatoren for put/call-forholdet følger mere nøje følelsen af aktivt forvaltede fonde.
13F og NPORT arkivering
Detaljer om 13F-arkivering er gratis. Detaljer om NP-ansøgninger kræver et premium-medlemskab. Grønne rækker angiver nye positioner. Røde rækker angiver lukkede positioner. Klik på linket ikon for at se den fulde transaktionshistorik.
Opgrader
for at låse premium-data op og eksportere til Excel ![]() .
.
| Fil dato | Kilde | Investor | Type | Gennemsnitlig pris (Øst) |
Aktier | Δ Aktier (%) |
Rapporteret Værdi ($1000) |
Δ Værdi (%) |
Port Alloc (%) |
|
|---|---|---|---|---|---|---|---|---|---|---|
| 2025-07-22 | 13F | Legacy Trust | 0 | -100,00 | 0 | |||||
| 2025-08-14 | 13F | Harwood Advisory Group, LLC | 121 | -47,84 | 6 | -50,00 | ||||
| 2025-07-18 | 13F | Truist Financial Corp | 17.412 | 0,95 | 793 | -0,38 | ||||
| 2025-07-24 | 13F | Baldwin Brothers Inc/ma | 16.586 | 0,01 | 755 | -1,31 | ||||
| 2025-08-14 | 13F | Goldman Sachs Group Inc | 12.841 | 48,55 | 585 | 46,37 | ||||
| 2025-07-17 | 13F | Janney Montgomery Scott LLC | 6.833 | -1,71 | 0 | |||||
| 2025-08-14 | 13F | Citadel Advisors Llc | 16.808 | 16,88 | 766 | 15,21 | ||||
| 2025-05-14 | 13F | Flow Traders U.s. Llc | 0 | -100,00 | 0 | |||||
| 2025-08-06 | 13F | Commonwealth Equity Services, Llc | 116.830 | -4,28 | 5 | 0,00 | ||||
| 2025-05-08 | 13F | Endeavor Private Wealth, Inc. | 0 | -100,00 | 0 | |||||
| 2025-08-14 | 13F | Qube Research & Technologies Ltd | 90 | 0,00 | 4 | 0,00 | ||||
| 2025-07-23 | 13F | Eagle Strategies LLC | 13.128 | 7,71 | 598 | 6,23 | ||||
| 2025-07-21 | 13F | Ameritas Advisory Services, LLC | 113 | 5 | ||||||
| 2025-07-25 | 13F | Hazlett, Burt & Watson, Inc. | 415 | -68,30 | 0 | |||||
| 2025-07-24 | 13F | Jfs Wealth Advisors, Llc | 158 | 0,00 | 7 | 0,00 | ||||
| 2025-08-14 | 13F | Warren Averett Asset Management, LLC | 4.881 | -2,01 | 222 | -3,06 | ||||
| 2025-08-08 | 13F | Capital Investment Advisory Services, LLC | 270 | 0,00 | 12 | 0,00 | ||||
| 2025-08-01 | 13F | Gwn Securities Inc. | 0 | -100,00 | 0 | |||||
| 2025-07-10 | 13F | Wealth Enhancement Advisory Services, Llc | 45.455 | -5,61 | 2.128 | -4,32 | ||||
| 2025-07-22 | 13F | Accel Wealth Management | 6.678 | 0,77 | 304 | -0,33 | ||||
| 2025-06-24 | NP | TNQIX - 1290 Retirement 2055 Fund Class I | 2.033 | 0,00 | 91 | -6,25 | ||||
| 2025-05-15 | 13F | Harvest Investment Services, LLC | 0 | -100,00 | 0 | |||||
| 2025-07-23 | 13F | Steel Peak Wealth Management LLC | 14.608 | 9,10 | 665 | 7,61 | ||||
| 2025-07-14 | 13F | Painted Porch Advisors LLC | 2.004 | -9,32 | 91 | -10,78 | ||||
| 2025-07-21 | 13F | Future Financial Wealth Managment LLC | 228 | 0,00 | 10 | 0,00 | ||||
| 2025-07-10 | 13F | American Financial Advisors, LLC | 9.447 | -4,62 | 430 | -5,91 | ||||
| 2025-04-11 | 13F | Procyon Private Wealth Partners, LLC | 0 | -100,00 | 0 | |||||
| 2025-08-14 | 13F | Raymond James Financial Inc | 27.028 | 2,68 | 1.231 | 1,32 | ||||
| 2025-07-24 | 13F | Blair William & Co/il | 42 | 0,00 | 2 | 0,00 | ||||
| 2025-07-30 | 13F | IMG Wealth Management, Inc. | 832 | 0,00 | 38 | -2,63 | ||||
| 2025-08-14 | 13F | Fmr Llc | 46 | -93,64 | 2 | -93,94 | ||||
| 2025-07-28 | 13F | Harbour Investments, Inc. | 58.431 | 1,74 | 2.662 | 0,38 | ||||
| 2025-08-05 | 13F | GHP Investment Advisors, Inc. | 200 | 0,00 | 9 | 0,00 | ||||
| 2025-09-04 | 13F/A | Advisor Group Holdings, Inc. | 21.925 | -10,39 | 999 | -11,59 | ||||
| 2025-08-07 | 13F | Allworth Financial LP | 19 | 0,00 | 1 | |||||
| 2025-06-24 | NP | TNWIX - 1290 Retirement 2050 Fund Class I | 1.982 | 0,00 | 89 | -6,38 | ||||
| 2025-05-01 | 13F | Quest 10 Wealth Builders, Inc. | 0 | -100,00 | 0 | |||||
| 2025-08-12 | 13F | Jpmorgan Chase & Co | 0 | -100,00 | 0 | |||||
| 2025-08-12 | 13F | AlphaCore Capital LLC | 150 | 7 | ||||||
| 2025-08-14 | 13F | Sunbelt Securities, Inc. | 5 | 0,00 | 0 | |||||
| 2025-08-14 | 13F | GWM Advisors LLC | 7.841 | 0,19 | 357 | -1,11 | ||||
| 2025-04-17 | 13F | Pacific Sun Financial Corp | 0 | -100,00 | 0 | |||||
| 2025-07-07 | 13F | Roxbury Financial LLC | 164 | 0,61 | 7 | 0,00 | ||||
| 2025-08-18 | 13F | Geneos Wealth Management Inc. | 6.026 | -1,16 | 274 | -2,49 | ||||
| 2025-08-15 | 13F | Kestra Advisory Services, LLC | 6.036 | -20,25 | 275 | -21,49 | ||||
| 2025-08-15 | 13F | Equitable Holdings, Inc. | 0 | -100,00 | 0 | |||||
| 2025-08-14 | 13F | Comerica Bank | 2.719 | 0,00 | 124 | -1,60 | ||||
| 2025-08-08 | 13F | Pnc Financial Services Group, Inc. | 761 | -72,78 | 35 | -73,64 | ||||
| 2025-08-12 | 13F | SRS Capital Advisors, Inc. | 473 | 0,42 | 22 | 0,00 | ||||
| 2025-08-14 | 13F | 10Elms LLP | 708 | -30,31 | 32 | -30,43 | ||||
| 2025-07-31 | 13F | Sage Mountain Advisors LLC | 6.750 | 0,00 | 307 | -1,29 | ||||
| 2025-08-11 | 13F | Wbi Investments, Inc. | 8.492 | 18,72 | 387 | 16,97 | ||||
| 2025-05-15 | 13F | Two Sigma Securities, Llc | 0 | -100,00 | 0 | |||||
| 2025-06-24 | NP | TNIIX - 1290 Retirement 2020 Fund Class I | 231 | 0,00 | 10 | -9,09 | ||||
| 2025-08-04 | 13F | HBK Sorce Advisory LLC | 6.675 | -30,76 | 304 | -31,69 | ||||
| 2025-07-10 | 13F | Sovran Advisors, LLC | 5.314 | 246 | ||||||
| 2025-06-24 | NP | TNLIX - 1290 Retirement 2035 Fund Class I | 757 | 0,00 | 34 | -8,33 | ||||
| 2025-08-12 | 13F | Global Retirement Partners, LLC | 4.540 | 0,73 | 207 | -2,83 | ||||
| 2025-05-16 | 13F/A | Kestra Investment Management, LLC | 0 | -100,00 | 0 | |||||
| 2025-08-12 | 13F | Steward Partners Investment Advisory, Llc | 1.685 | -5,60 | 77 | -7,32 | ||||
| 2025-08-14 | 13F | Mercer Global Advisors Inc /adv | 42.623 | -9,07 | 1.941 | -10,30 | ||||
| 2025-07-22 | 13F | McNaughton Wealth Management, LLC | 6.569 | 0,00 | 299 | -1,32 | ||||
| 2025-07-30 | 13F | Brookstone Capital Management | 201.484 | -5,40 | 9.178 | -6,68 | ||||
| 2025-08-13 | 13F | Rsm Us Wealth Management Llc | 5.463 | -17,20 | 249 | -18,42 | ||||
| 2025-08-14 | 13F | Snowden Capital Advisors LLC | 24.143 | 3,14 | 1.100 | 1,76 | ||||
| 2025-08-14 | 13F | Avant Capital LLC | 5.669 | -0,79 | 258 | -1,90 | ||||
| 2025-08-14 | 13F | Bank Of America Corp /de/ | 202.000 | 86,61 | 9.201 | 84,09 | ||||
| 2025-04-22 | 13F/A | NorthRock Partners, LLC | 0 | -100,00 | 0 | -100,00 | ||||
| 2025-08-12 | 13F | LPL Financial LLC | 239.598 | 4,32 | 10.914 | 2,90 | ||||
| 2025-08-13 | 13F | Russell Investments Group, Ltd. | 28 | 1 | ||||||
| 2025-08-14 | 13F | Mariner, LLC | 7.684 | 1,04 | 350 | -0,57 | ||||
| 2025-08-06 | 13F | AE Wealth Management LLC | 71 | 208,70 | 3 | 200,00 | ||||
| 2025-05-16 | 13F | Laidlaw Wealth Management LLC | 0 | -100,00 | 0 | |||||
| 2025-07-17 | 13F | Eagle Bluffs Wealth Management LLC | 86.617 | 0,99 | 3.945 | -0,38 | ||||
| 2025-07-11 | 13F | Farther Finance Advisors, LLC | 1.543 | 1,45 | 70 | 0,00 | ||||
| 2025-08-06 | 13F | Destiny Capital Corp/CO | 5.476 | 0,00 | 249 | -1,19 | ||||
| 2025-08-13 | 13F | Transce3nd, LLC | 825 | -4,73 | 38 | -5,13 | ||||
| 2025-07-14 | 13F | Southland Equity Partners LLC | 0 | -100,00 | 0 | |||||
| 2025-08-12 | 13F | SlateStone Wealth, LLC | 7.196 | -3,18 | 0 | |||||
| 2025-08-13 | 13F | SageView Advisory Group, LLC | 4.606 | -0,90 | 210 | -2,34 | ||||
| 2025-07-25 | 13F | Sequoia Financial Advisors, LLC | 30.985 | -66,46 | 1.411 | -66,92 | ||||
| 2025-08-12 | 13F | Jaffetilchin Investment Partners, LLC | 4.646 | 0,67 | 212 | -0,94 | ||||
| 2025-07-25 | 13F | Cwm, Llc | 2.574 | -12,75 | 0 | |||||
| 2025-08-14 | 13F | Wells Fargo & Company/mn | 109.954 | -4,58 | 5.008 | -5,86 | ||||
| 2025-08-13 | 13F | Jones Financial Companies Lllp | 44.536 | 32,74 | 2.031 | 32,16 | ||||
| 2025-05-08 | 13F | BRYN MAWR TRUST Co | 0 | -100,00 | 0 | |||||
| 2025-08-13 | 13F | Northwestern Mutual Wealth Management Co | 15.005 | 18,09 | 683 | 16,55 | ||||
| 2025-08-12 | 13F | Virtu Financial LLC | 21.747 | 1 | ||||||
| 2025-06-24 | NP | TNJIX - 1290 Retirement 2025 Fund Class I | 49 | -14,04 | 2 | 0,00 | ||||
| 2025-07-23 | 13F | Armbruster Capital Management, Inc. | 223.270 | 5,97 | 10.170 | 4,53 | ||||
| 2025-08-14 | 13F | Ameriprise Financial Inc | 21.411 | 12,40 | 975 | 10,92 | ||||
| 2025-07-17 | 13F | Symmetry Partners, LLC | 7.380 | 36,44 | 336 | 34,94 | ||||
| 2025-08-14 | 13F | Stifel Financial Corp | 5.022 | 13,47 | 229 | 11,76 | ||||
| 2025-07-17 | 13F | Sound Income Strategies, LLC | 12 | -72,73 | 1 | -100,00 | ||||
| 2025-08-11 | 13F | Citigroup Inc | 0 | -100,00 | 0 | |||||
| 2025-06-24 | NP | TNKIX - 1290 Retirement 2030 Fund Class I | 620 | 0,00 | 28 | -6,90 | ||||
| 2025-05-06 | 13F | Assetmark, Inc | 0 | -100,00 | 0 | |||||
| 2025-07-24 | 13F | Ronald Blue Trust, Inc. | 37 | 0,00 | 2 | 0,00 | ||||
| 2025-08-08 | 13F | Sculati Wealth Management, LLC | 64.571 | -67,44 | 2.941 | -67,88 | ||||
| 2025-08-14 | 13F | Royal Bank Of Canada | 67.496 | -1,24 | 3.074 | -2,60 | ||||
| 2025-08-14 | 13F | Susquehanna International Group, Llp | 22.028 | 1.003 | ||||||
| 2025-07-31 | 13F | Cambridge Investment Research Advisors, Inc. | 11.873 | -0,53 | 1 | |||||
| 2025-08-06 | 13F | Adviser Investments LLC | 0 | -100,00 | 0 | |||||
| 2025-06-24 | NP | TNOIX - 1290 Retirement 2045 Fund Class I | 1.785 | 0,00 | 80 | -7,06 | ||||
| 2025-08-12 | 13F | PSI Advisors, LLC | 0 | -100,00 | 0 | |||||
| 2025-07-17 | 13F | Vermillion Wealth Management, Inc. | 36 | 0,00 | 2 | 0,00 | ||||
| 2025-08-01 | 13F | Envestnet Asset Management Inc | 56.910 | 1,53 | 2.592 | 0,15 | ||||
| 2025-08-08 | 13F | Larson Financial Group LLC | 21 | 0,00 | 1 | |||||
| 2025-08-06 | 13F | Golden State Wealth Management, LLC | 180 | -20,35 | 8 | -20,00 | ||||
| 2025-07-16 | 13F/A | CX Institutional | 316 | 0,00 | 0 | |||||
| 2025-07-31 | 13F | Jackson Hole Capital Partners, LLC | 1.922 | 0,00 | 88 | -1,14 | ||||
| 2025-08-12 | 13F | O'shaughnessy Asset Management, Llc | 1 | 0,00 | 0 | |||||
| 2025-05-16 | 13F | Coppell Advisory Solutions LLC | 0 | -100,00 | 0 | |||||
| 2025-07-23 | 13F | Venturi Wealth Management, LLC | 245.703 | 11.192 | ||||||
| 2025-08-08 | 13F | Cetera Investment Advisers | 35.384 | 1,91 | 1.612 | 0,50 | ||||
| 2025-08-12 | 13F | Proequities, Inc. | 0 | 0 | ||||||
| 2025-08-18 | 13F | Front Row Advisors LLC | 225 | 0,00 | 10 | 0,00 | ||||
| 2025-07-07 | 13F | RDA Financial Network | 5.803 | -19,41 | 264 | -20,48 | ||||
| 2025-07-21 | 13F | DHJJ Financial Advisors, Ltd. | 36 | 0,00 | 2 | 0,00 | ||||
| 2025-08-13 | 13F | Invesco Ltd. | 6.782 | 14,25 | 309 | 12,41 | ||||
| 2025-08-14 | 13F | Hrt Financial Lp | 0 | -100,00 | 0 | |||||
| 2025-05-20 | 13F | Belpointe Asset Management LLC | 0 | -100,00 | 0 | -100,00 | ||||
| 2025-07-11 | 13F | Pinnacle Bancorp, Inc. | 0 | -100,00 | 0 | |||||
| 2025-08-11 | 13F | Private Advisor Group, LLC | 29.657 | -2,79 | 1.351 | -4,12 | ||||
| 2025-08-14 | 13F | Two Sigma Investments, Lp | 61.300 | 68,87 | 2.792 | 66,59 | ||||
| 2025-07-14 | 13F | Ridgewood Investments LLC | 2.866 | 0,00 | 131 | -1,52 | ||||
| 2025-07-14 | 13F | U.S. Capital Wealth Advisors, LLC | 45.387 | 26,31 | 2.067 | 24,59 | ||||
| 2025-08-04 | 13F | Spire Wealth Management | 0 | -100,00 | 0 | |||||
| 2025-08-14 | 13F | UBS Group AG | 222.473 | 4,23 | 10.134 | 2,82 | ||||
| 2025-08-04 | 13F | Arkadios Wealth Advisors | 12.063 | -1,55 | 549 | -2,83 | ||||
| 2025-06-24 | NP | TNNIX - 1290 Retirement 2040 Fund Class I | 1.577 | 0,00 | 71 | -6,67 | ||||
| 2025-07-31 | 13F | City State Bank | 426 | 0,00 | 19 | 0,00 | ||||
| 2025-08-05 | 13F | Huntington National Bank | 0 | |||||||
| 2025-05-05 | 13F | Lindbrook Capital, Llc | 167 | 0,00 | 8 | 0,00 | ||||
| 2025-07-29 | 13F | Private Trust Co Na | 2.709 | 0,00 | 123 | -1,60 | ||||
| 2025-08-12 | 13F | Laurel Wealth Advisors LLC | 593 | 4.461,54 | 0 | |||||
| 2025-08-15 | 13F | Morgan Stanley | 131.701 | -2,47 | 5.999 | -3,79 | ||||
| 2025-04-14 | 13F | Miracle Mile Advisors, LLC | 0 | -100,00 | 0 | -100,00 | ||||
| 2025-08-12 | 13F | MAI Capital Management | 377 | 0,00 | 17 | 0,00 | ||||
| 2025-08-14 | 13F | Mml Investors Services, Llc | 0 | -100,00 | 0 | |||||
| 2025-08-08 | 13F | Avantax Advisory Services, Inc. | 18.576 | 0,56 | 846 | -0,82 | ||||
| 2025-08-14 | 13F | Jane Street Group, Llc | 0 | -100,00 | 0 | |||||
| 2025-07-30 | 13F | Bogart Wealth, LLC | 73 | 1,39 | 3 | 0,00 | ||||
| 2025-04-28 | 13F | Strategic Financial Concepts, LLC | 0 | -100,00 | 0 | -100,00 | ||||
| 2025-08-08 | 13F | Kingsview Wealth Management, LLC | 10.136 | -2,65 | 462 | -3,96 | ||||
| 2025-08-08 | 13F | Cedar Wealth Management, LLC | 167 | 0,00 | 8 | 0,00 |