Grundlæggende statistik
| Institutionelle ejere | 78 total, 78 long only, 0 short only, 0 long/short - change of 18,18% MRQ |
| Gennemsnitlig porteføljeallokering | 0.0927 % - change of 2,33% MRQ |
| Institutionelle aktier (lange) | 3.483.449 (ex 13D/G) - change of 0,45MM shares 14,74% MRQ |
| Institutionel værdi (lang) | $ 216.927 USD ($1000) |
Institutionelt ejerskab og aktionærer
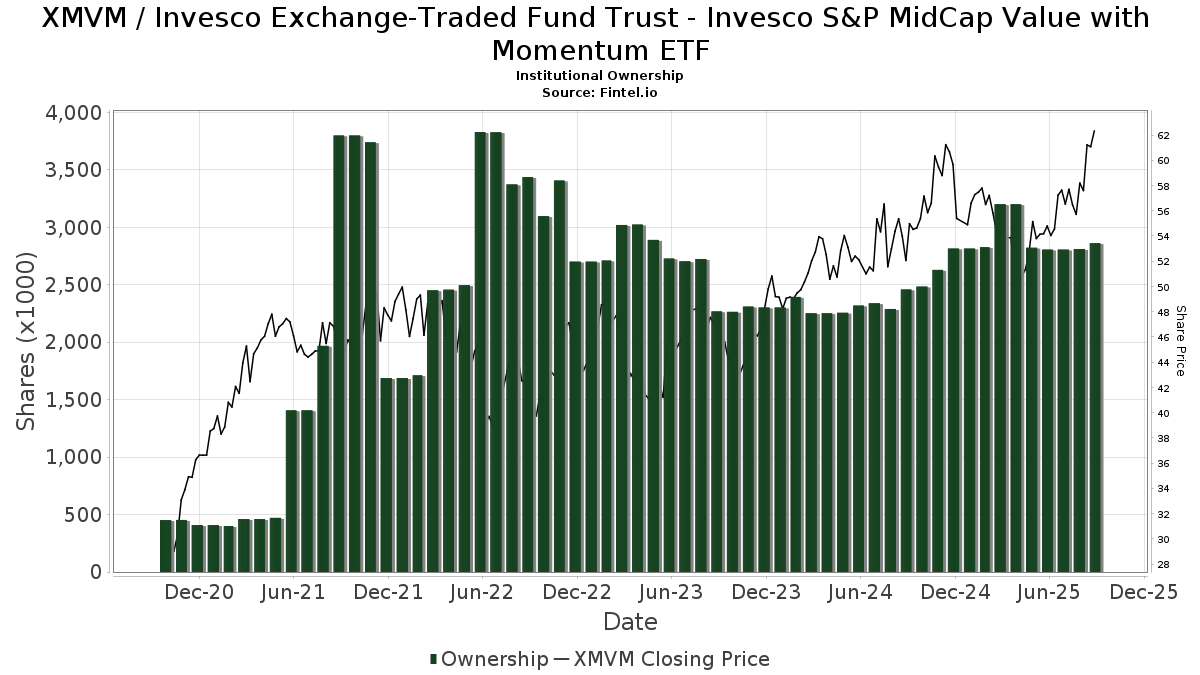
Invesco Exchange-Traded Fund Trust - Invesco S&P MidCap Value with Momentum ETF (US:XMVM) har 78 institutionelle ejere og aktionærer, der har indsendt 13D/G- eller 13F-formularer til Securities Exchange Commission (SEC). Disse institutioner har i alt 3,483,449 aktier. Største aktionærer omfatter LPL Financial LLC, Bank Of America Corp /de/, Nelson, Van Denburg & Campbell Wealth Management Group, LLC, Whitaker-Myers Wealth Managers, LTD., Ameriprise Financial Inc, Morgan Stanley, Northwestern Mutual Wealth Management Co, Raymond James Financial Inc, Royal Bank Of Canada, and Advisor Group Holdings, Inc. .
Invesco Exchange-Traded Fund Trust - Invesco S&P MidCap Value with Momentum ETF (ARCA:XMVM) institutionel ejerskabsstruktur viser aktuelle positioner i virksomheden efter institutioner og fonde, samt seneste ændringer i positionsstørrelse. Større aktionærer kan omfatte individuelle investorer, investeringsforeninger, hedgefonde eller institutioner. Skema 13D angiver, at investoren besidder (eller besidder) mere end 5 % af virksomheden og har til hensigt (eller har til hensigt at) aktivt at forfølge en ændring i forretningsstrategi. Skema 13G indikerer en passiv investering på over 5%.
The share price as of March 6, 2026 is 65,55 / share. Previously, on March 10, 2025, the share price was 52,67 / share. This represents an increase of 24,45% over that period.
Fondens stemningsscore
Fund Sentiment Score (fka Ownership Accumulation Score) finder de aktier, der bliver mest købt af fonde. Det er resultatet af en sofistikeret, multi-faktor kvantitativ model, der identificerer virksomheder med de højeste niveauer af institutionel akkumulering. Scoringsmodellen bruger en kombination af den samlede stigning i oplyste ejere, ændringerne i porteføljeallokeringer i disse ejere og andre målinger. Tallet går fra 0 til 100, hvor højere tal indikerer et højere niveau af akkumulering for sine jævnaldrende, og 50 er gennemsnittet.
Opdateringsfrekvens: Dagligt
Se Ownership Explorer, som giver en liste over højest rangerende virksomheder.
AI+ Ask Fintel’s AI assistant about Invesco Exchange-Traded Fund Trust - Invesco S&P MidCap Value with Momentum ETF.
Select a question to share a public post with an AI-crafted answer.
Thinking of good questions…
Institutionel Put/Call-forhold
Ud over at indberette standardaktie- og gældsudstedelser skal institutter med mere end 100 mill. aktiver under forvaltning også oplyse deres put- og call-optionsbeholdninger. Da salgsoptioner generelt indikerer negativ stemning, og købsoptioner indikerer positiv stemning, kan vi få en fornemmelse af den overordnede institutionelle stemning ved at plotte forholdet mellem put og kald. Diagrammet til højre viser det historiske put/call-forhold for dette instrument.
Brug af Put/Call Ratio som en indikator for investorernes stemning overvinder en af de vigtigste mangler ved at bruge totalt institutionelt ejerskab, som er, at en betydelig mængde af aktiver under forvaltning investeres passivt for at spore indekser. Passivt forvaltede fonde køber typisk ikke optioner, så indikatoren for put/call-forholdet følger mere nøje følelsen af aktivt forvaltede fonde.
13F og NPORT arkivering
Detaljer om 13F-arkivering er gratis. Detaljer om NP-ansøgninger kræver et premium-medlemskab. Grønne rækker angiver nye positioner. Røde rækker angiver lukkede positioner. Klik på linket ikon for at se den fulde transaktionshistorik.
Opgrader
for at låse premium-data op og eksportere til Excel ![]() .
.
| Fil dato | Kilde | Investor | Type | Gennemsnitlig pris (Øst) |
Aktier | Δ Aktier (%) |
Rapporteret Værdi ($1000) |
Δ Værdi (%) |
Port Alloc (%) |
|
|---|---|---|---|---|---|---|---|---|---|---|
| 2026-01-20 | 13F | Thurston, Springer, Miller, Herd & Titak, Inc. | 65 | 4 | ||||||
| 2026-02-05 | 13F | Cornerstone Wealth Management, LLC | 6.794 | -3,12 | 436 | 0,69 | ||||
| 2026-02-17 | 13F | Fmr Llc | 634 | 0,96 | 41 | 5,26 | ||||
| 2026-02-05 | 13F | Allworth Financial LP | 50 | 0,00 | 3 | 0,00 | ||||
| 2026-02-12 | 13F | Betterment LLC | 6.360 | 0 | ||||||
| 2026-02-05 | 13F | Cambridge Investment Research Advisors, Inc. | 31.952 | 27,28 | 2 | 100,00 | ||||
| 2026-02-12 | 13F | Steward Partners Investment Advisory, Llc | 1.339 | 0,00 | 86 | 3,66 | ||||
| 2026-02-18 | 13F | GWM Advisors LLC | 0 | -100,00 | 0 | |||||
| 2026-01-26 | 13F | Roman Butler Fullerton & Co | 20.429 | 86,18 | 1.364 | 109,52 | ||||
| 2026-01-23 | 13F | Guidance Capital, Inc | 39.089 | 5,65 | 2.610 | 17,36 | ||||
| 2026-02-12 | 13F | Beacon Capital Management, Inc. | 381 | -0,78 | 24 | 4,35 | ||||
| 2026-02-13 | 13F | Morgan Stanley | 177.803 | -14,51 | 11.408 | -11,01 | ||||
| 2026-01-07 | 13F | Harbor Investment Advisory, Llc | 825 | 0,00 | 53 | 4,00 | ||||
| 2026-01-08 | 13F | True Wealth Design, LLC | 1.665 | 0,00 | 107 | 3,92 | ||||
| 2026-02-17 | 13F | Royal Bank Of Canada | 79.297 | 6,82 | 5.087 | 11,19 | ||||
| 2026-01-23 | 13F | Armbruster Capital Management, Inc. | 8.749 | 0,00 | 561 | 4,08 | ||||
| 2026-02-17 | 13F | Equitable Holdings, Inc. | 21.318 | 176,93 | 1.368 | 188,40 | ||||
| 2026-02-17 | 13F | Jones Financial Companies Lllp | 16.442 | 89,47 | 1.055 | 96,28 | ||||
| 2026-02-17 | 13F | Warren Averett Asset Management, LLC | 8.292 | 1,64 | 532 | 5,98 | ||||
| 2026-02-06 | 13F | Tanglewood Legacy Advisors, LLC | 295 | 0,00 | 19 | 0,00 | ||||
| 2026-02-03 | 13F | International Assets Investment Management, Llc | 1.191 | 76 | ||||||
| 2025-11-06 | 13F | Financial Advocates Investment Management | 0 | -100,00 | 0 | |||||
| 2026-01-21 | 13F | Sound Income Strategies, LLC | 86 | 6 | ||||||
| 2026-02-10 | 13F | Sarver Vrooman Wealth Advisors | 980 | 63 | ||||||
| 2026-02-05 | 13F | Thrivent Financial For Lutherans | 45.320 | 3 | ||||||
| 2026-01-06 | 13F | Nelson, Van Denburg & Campbell Wealth Management Group, LLC | 507.916 | -1,48 | 32.588 | 2,56 | ||||
| 2026-02-12 | 13F | Commonwealth Equity Services, Llc | 67.146 | -39,05 | 4.308 | 71.700,00 | ||||
| 2026-02-12 | 13F | Founders Financial Alliance, LLC | 1 | 0,00 | 0 | |||||
| 2026-01-29 | 13F | Sanctuary Advisors, LLC | 23.611 | 0,00 | 1.515 | 4,05 | ||||
| 2026-02-09 | 13F | Solutions 4 Wealth, Ltd | 5.268 | 338 | ||||||
| 2026-02-09 | 13F | Hantz Financial Services, Inc. | 337 | 0,00 | 0 | |||||
| 2026-02-17 | 13F | Advisor Group Holdings, Inc. | 76.292 | 103,36 | 4.897 | 112,68 | ||||
| 2026-02-13 | 13F | Golden State Wealth Management, LLC | 5.922 | -28,92 | 380 | -26,12 | ||||
| 2026-01-09 | 13F | Breakwater Capital Group | 17.622 | -6,55 | 1.131 | -2,75 | ||||
| 2026-01-29 | 13F | UBS Group AG | 0 | -100,00 | 0 | |||||
| 2026-02-13 | 13F | Ausdal Financial Partners, Inc. | 10.101 | 2,87 | 648 | 7,11 | ||||
| 2025-11-03 | 13F | TD Waterhouse Canada Inc. | 0 | -100,00 | 0 | |||||
| 2026-02-10 | 13F | Bnp Paribas Arbitrage, Sa | 0 | -100,00 | 0 | |||||
| 2026-02-17 | 13F | Susquehanna International Group, Llp | 3.147 | 202 | ||||||
| 2025-10-30 | 13F | Ridgewood Investments LLC | 0 | -100,00 | 0 | |||||
| 2025-11-14 | 13F | Skopos Labs, Inc. | 0 | -100,00 | 0 | |||||
| 2026-02-09 | 13F | Harbour Investments, Inc. | 433 | 0,00 | 28 | 3,85 | ||||
| 2026-01-30 | 13F | Sigma Planning Corp | 7.423 | 3,72 | 486 | 9,98 | ||||
| 2026-01-30 | 13F | Us Bancorp \de\ | 2.023 | -0,34 | 130 | 3,20 | ||||
| 2026-02-11 | 13F | Comprehensive Financial Planning, Inc./PA | 5.853 | 0,43 | 376 | 4,46 | ||||
| 2026-02-17 | 13F | Captrust Financial Advisors | 58.365 | -8,12 | 3.745 | -4,34 | ||||
| 2026-03-04 | 13F | SHP Wealth Management | 1.608 | 103 | ||||||
| 2026-02-09 | 13F | Keating Financial Advisory Services, Inc. | 6.724 | 431 | ||||||
| 2025-10-14 | 13F | Parcion Private Wealth LLC | 0 | -100,00 | 0 | |||||
| 2026-02-11 | 13F | LPL Financial LLC | 562.745 | 3,33 | 36.106 | 7,57 | ||||
| 2026-01-28 | 13F | Geneos Wealth Management Inc. | 1.106 | 122,98 | 71 | 133,33 | ||||
| 2026-02-06 | 13F | Signature Estate & Investment Advisors Llc | 5.358 | 1,30 | 344 | 5,54 | ||||
| 2026-02-13 | 13F | Kestra Advisory Services, LLC | 2.083 | 134 | ||||||
| 2026-01-09 | 13F | Silverlake Wealth Management Llc | 4.000 | 0,00 | 257 | 4,07 | ||||
| 2026-02-03 | 13F | RFG Advisory, LLC | 3.628 | 233 | ||||||
| 2026-02-17 | 13F | Raymond James Financial Inc | 148.278 | -0,65 | 9.514 | 3,44 | ||||
| 2026-02-04 | 13F | Ameritas Advisory Services, LLC | 0 | -100,00 | 0 | |||||
| 2026-02-10 | 13F/A | Northwestern Mutual Wealth Management Co | 148.670 | 14,57 | 9.539 | 19,27 | ||||
| 2026-02-06 | 13F | IFP Advisors, Inc | 671 | 43 | ||||||
| 2026-01-14 | 13F | Nova Wealth Management, Inc. | 306 | 0,00 | 20 | 5,56 | ||||
| 2026-02-17 | 13F | Cetera Investment Advisers | 64.763 | 147,58 | 4.155 | 157,75 | ||||
| 2026-01-21 | 13F | Flagship Harbor Advisors, Llc | 65 | 4 | ||||||
| 2026-02-12 | 13F | Ullmann Financial Group, Inc. | 5.283 | 0,00 | 317 | -2,46 | ||||
| 2026-01-16 | 13F | Ronald Blue Trust, Inc. | 0 | -100,00 | 0 | |||||
| 2026-02-17 | 13F | Advisory Services Network, LLC | 0 | -100,00 | 0 | |||||
| 2026-02-02 | 13F | Benjamin Edwards Inc | 3.507 | 0,00 | 225 | 4,17 | ||||
| 2026-01-22 | 13F | Whitaker-Myers Wealth Managers, LTD. | 213.510 | -6,28 | 13.699 | -2,44 | ||||
| 2026-02-11 | 13F | Janney Montgomery Scott LLC | 4.696 | 23,42 | 0 | |||||
| 2026-02-20 | 13F | Sunbelt Securities, Inc. | 101 | 0,00 | 6 | 0,00 | ||||
| 2026-01-26 | 13F | Private Trust Co Na | 694 | 46,41 | 45 | 51,72 | ||||
| 2026-02-13 | 13F | Mariner, LLC | 19.573 | -1,98 | 1.256 | 2,03 | ||||
| 2026-02-17 | 13F | Ameriprise Financial Inc | 179.321 | -0,62 | 11.496 | 3,03 | ||||
| 2026-02-11 | 13F | Jpmorgan Chase & Co | 53 | 3 | ||||||
| 2026-02-13 | 13F | Change Path, LLC | 3.898 | 250 | ||||||
| 2026-02-04 | 13F | Money Concepts Capital Corp | 31.507 | -1,51 | 2.022 | 2,54 | ||||
| 2026-02-17 | 13F | Bank Of America Corp /de/ | 559.971 | 114,53 | 35.928 | 123,34 | ||||
| 2026-02-13 | 13F | MAI Capital Management | 296 | 0,00 | 19 | 0,00 | ||||
| 2026-01-14 | 13F | ORG Wealth Partners, LLC | 498 | 0,00 | 32 | 6,67 | ||||
| 2026-01-27 | 13F | Institute for Wealth Management, LLC. | 9.380 | -5,04 | 602 | -1,15 | ||||
| 2026-02-11 | 13F | WESCAP Management Group, Inc. | 4.955 | -1,26 | 318 | 2,59 | ||||
| 2026-02-06 | 13F | GPS Wealth Strategies Group, LLC | 0 | -100,00 | 0 | |||||
| 2026-02-12 | 13F | Principal Securities, Inc. | 6.064 | -0,88 | 389 | 3,18 | ||||
| 2026-02-10 | 13F | Envestnet Asset Management Inc | 68.588 | 3,07 | 4.401 | 7,29 | ||||
| 2026-02-10 | 13F | Thoroughbred Financial Services, Llc | 15.282 | -0,98 | 1 | |||||
| 2026-02-17 | 13F | Two Sigma Investments, Lp | 5.700 | 366 | ||||||
| 2026-02-13 | 13F | Mml Investors Services, Llc | 64.727 | 10,54 | 4.153 | 15,08 | ||||
| 2026-02-13 | 13F | Wells Fargo & Company/mn | 25.981 | 8,36 | 1.667 | 12,80 | ||||
| 2026-02-05 | 13F | Pacific Sun Financial Corp | 6.353 | 408 | ||||||
| 2026-02-13 | 13F | Citigroup Inc | 39.177 | -1,62 | 2.514 | 2,40 | ||||
| 2026-01-15 | 13F | MOR Wealth Management, LLC | 3.513 | 225 |