Grundlæggende statistik
| Institutionelle ejere | 71 total, 71 long only, 0 short only, 0 long/short - change of -2,70% MRQ |
| Gennemsnitlig porteføljeallokering | 0.0342 % - change of -82,29% MRQ |
| Institutionelle aktier (lange) | 12.017.700 (ex 13D/G) - change of -0,94MM shares -7,23% MRQ |
| Institutionel værdi (lang) | $ 138.015 USD ($1000) |
Institutionelt ejerskab og aktionærer
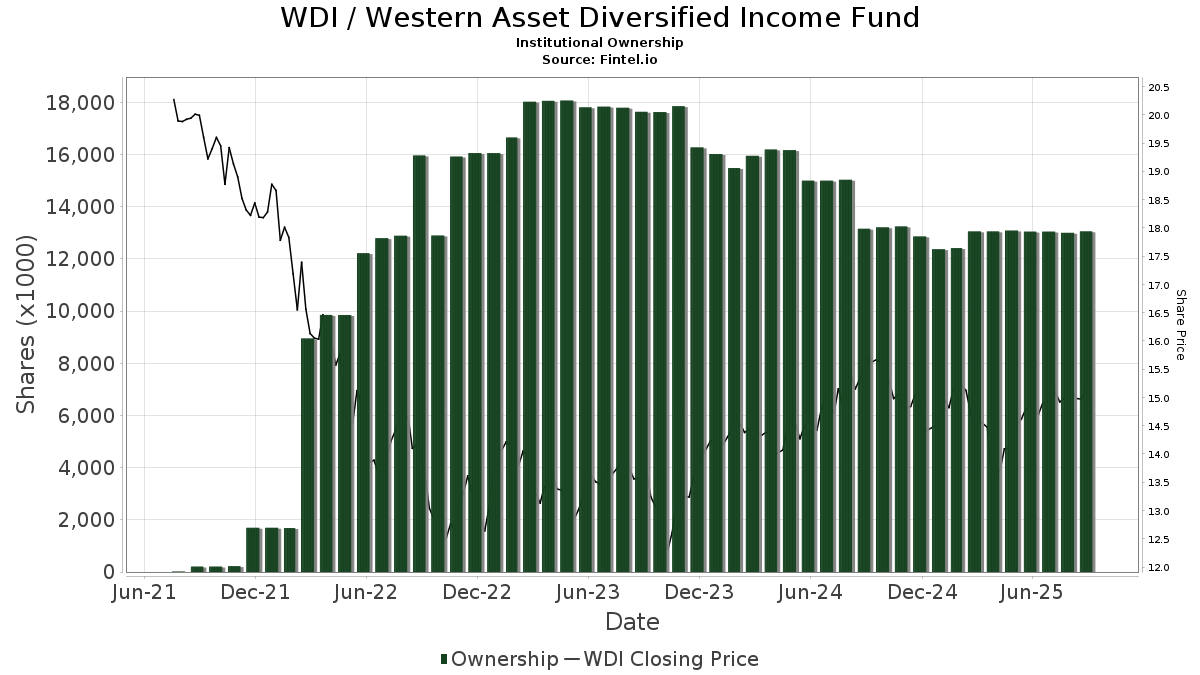
Western Asset Diversified Income Fund (US:WDI) har 71 institutionelle ejere og aktionærer, der har indsendt 13D/G- eller 13F-formularer til Securities Exchange Commission (SEC). Disse institutioner har i alt 12,017,700 aktier. Største aktionærer omfatter Morgan Stanley, Penserra Capital Management LLC, Wells Fargo & Company/mn, Raymond James Financial Inc, Hennion & Walsh Asset Management, Inc., Bank Of America Corp /de/, Advisors Asset Management, Inc., Cohen & Steers, Inc., Wiley Bros.-aintree Capital, Llc, and Royal Bank Of Canada .
Western Asset Diversified Income Fund (NYSE:WDI) institutionel ejerskabsstruktur viser aktuelle positioner i virksomheden efter institutioner og fonde, samt seneste ændringer i positionsstørrelse. Større aktionærer kan omfatte individuelle investorer, investeringsforeninger, hedgefonde eller institutioner. Skema 13D angiver, at investoren besidder (eller besidder) mere end 5 % af virksomheden og har til hensigt (eller har til hensigt at) aktivt at forfølge en ændring i forretningsstrategi. Skema 13G indikerer en passiv investering på over 5%.
The share price as of April 24, 2026 is 13,68 / share. Previously, on April 28, 2025, the share price was 14,02 / share. This represents a decline of 2,43% over that period.
Fondens stemningsscore
Fund Sentiment Score (fka Ownership Accumulation Score) finder de aktier, der bliver mest købt af fonde. Det er resultatet af en sofistikeret, multi-faktor kvantitativ model, der identificerer virksomheder med de højeste niveauer af institutionel akkumulering. Scoringsmodellen bruger en kombination af den samlede stigning i oplyste ejere, ændringerne i porteføljeallokeringer i disse ejere og andre målinger. Tallet går fra 0 til 100, hvor højere tal indikerer et højere niveau af akkumulering for sine jævnaldrende, og 50 er gennemsnittet.
Opdateringsfrekvens: Dagligt
Se Ownership Explorer, som giver en liste over højest rangerende virksomheder.
AI+ Ask Fintel’s AI assistant about Western Asset Diversified Income Fund.
Select a question to share a public post with an AI-crafted answer.
Thinking of good questions…
Institutionel Put/Call-forhold
Ud over at indberette standardaktie- og gældsudstedelser skal institutter med mere end 100 mill. aktiver under forvaltning også oplyse deres put- og call-optionsbeholdninger. Da salgsoptioner generelt indikerer negativ stemning, og købsoptioner indikerer positiv stemning, kan vi få en fornemmelse af den overordnede institutionelle stemning ved at plotte forholdet mellem put og kald. Diagrammet til højre viser det historiske put/call-forhold for dette instrument.
Brug af Put/Call Ratio som en indikator for investorernes stemning overvinder en af de vigtigste mangler ved at bruge totalt institutionelt ejerskab, som er, at en betydelig mængde af aktiver under forvaltning investeres passivt for at spore indekser. Passivt forvaltede fonde køber typisk ikke optioner, så indikatoren for put/call-forholdet følger mere nøje følelsen af aktivt forvaltede fonde.
13F og NPORT arkivering
Detaljer om 13F-arkivering er gratis. Detaljer om NP-ansøgninger kræver et premium-medlemskab. Grønne rækker angiver nye positioner. Røde rækker angiver lukkede positioner. Klik på linket ikon for at se den fulde transaktionshistorik.
Opgrader
for at låse premium-data op og eksportere til Excel ![]() .
.
| Fil dato | Kilde | Investor | Type | Gennemsnitlig pris (Øst) |
Aktier | Δ Aktier (%) |
Rapporteret Værdi ($1000) |
Δ Værdi (%) |
Port Alloc (%) |
|
|---|---|---|---|---|---|---|---|---|---|---|
| 2026-02-17 | 13F | Raymond James Financial Inc | 531.289 | 455,72 | 7.337 | 421,83 | ||||
| 2026-02-17 | 13F | Polar Asset Management Partners Inc. | 0 | -100,00 | 0 | |||||
| 2025-11-14 | 13F | Virtu Financial LLC | 0 | -100,00 | 0 | |||||
| 2026-02-17 | 13F | SageView Advisory Group, LLC | 400 | 6 | ||||||
| 2026-02-12 | 13F | Hrt Financial Lp | 0 | -100,00 | 0 | |||||
| 2026-02-17 | 13F | XTX Topco Ltd | 14.052 | 194 | ||||||
| 2025-11-14 | 13F | Wetherby Asset Management Inc | 11.400 | 0,00 | 168 | -1,18 | ||||
| 2026-04-23 | 13F | Oppenheimer & Co Inc | 59.622 | 0,38 | 801 | -2,32 | ||||
| 2026-02-18 | 13F | GWM Advisors LLC | 35.505 | 45,76 | 490 | 36,87 | ||||
| 2026-01-23 | 13F | Assetmark, Inc | 185 | 0,00 | 3 | 0,00 | ||||
| 2026-02-13 | 13F | Cohen & Steers, Inc. | 272.993 | 0,00 | 4 | -25,00 | ||||
| 2026-02-10 | 13F | COFG Advisors, LLC | 31.264 | 432 | ||||||
| 2026-02-17 | 13F | Cetera Investment Advisers | 43.374 | -0,89 | 599 | -7,00 | ||||
| 2025-11-12 | 13F | Principal Securities, Inc. | 0 | -100,00 | 0 | |||||
| 2026-04-02 | 13F | Marex Group plc | 0 | -100,00 | 0 | |||||
| 2026-02-12 | 13F | Jane Street Group, Llc | 50.172 | 33,39 | 693 | 25,14 | ||||
| 2026-02-13 | 13F | Integrated Wealth Concepts LLC | 50.596 | 16,52 | 699 | 9,40 | ||||
| 2026-04-21 | 13F | Wedbush Securities Inc | 22.609 | -2,16 | 0 | |||||
| 2026-02-06 | 13F | Prevail Innovative Wealth Advisors, Llc | 135.929 | 1,69 | 1.877 | -4,53 | ||||
| 2025-11-06 | 13F | Naviter Wealth, LLC | 0 | -100,00 | 0 | |||||
| 2026-04-06 | 13F | Highline Wealth Partners Llc | 212 | 14,59 | 3 | 0,00 | ||||
| 2026-01-29 | 13F | UBS Group AG | 42.416 | -12,05 | 586 | -17,49 | ||||
| 2026-02-17 | 13F | Guggenheim Capital Llc | 194.802 | 10,60 | 2.690 | 3,82 | ||||
| 2026-02-17 | 13F | Susquehanna International Group, Llp | 29.706 | 188,55 | 410 | 171,52 | ||||
| 2026-02-17 | 13F | Bank Of America Corp /de/ | 430.240 | -0,84 | 5.942 | -6,91 | ||||
| 2026-02-02 | 13F | Truist Financial Corp | 10.268 | -14,85 | 142 | -20,34 | ||||
| 2026-02-10 | 13F | Envestnet Asset Management Inc | 24.786 | -0,95 | 342 | -7,07 | ||||
| 2026-04-07 | 13F | CoreCap Advisors, LLC | 8.000 | 108 | ||||||
| 2026-02-12 | 13F | BlackRock, Inc. | 14.416 | 106,53 | 199 | 95,10 | ||||
| 2026-01-26 | 13F | Consolidated Portfolio Review Corp | 0 | -100,00 | 0 | |||||
| 2026-02-13 | 13F | Pin Oak Investment Advisors Inc | 0 | -100,00 | 0 | |||||
| 2025-11-14 | 13F | Robinson Capital Management, Llc | 0 | -100,00 | 0 | |||||
| 2026-04-16 | 13F | Evolve Private Wealth, Llc | 37.769 | -0,96 | 508 | -4,70 | ||||
| 2025-11-14 | 13F | Hilltop Holdings Inc. | 0 | -100,00 | 0 | -100,00 | ||||
| 2026-04-02 | 13F | Noble Wealth Management PBC | 1.000 | 13 | ||||||
| 2026-01-29 | 13F | Comerica Bank | 10.087 | -1,04 | 139 | -6,71 | ||||
| 2026-02-17 | 13F | Royal Bank Of Canada | 222.980 | 2,36 | 3.079 | -3,93 | ||||
| 2026-02-10 | 13F | Lido Advisors, LLC | 10.125 | 0,00 | 150 | 0,00 | ||||
| 2025-11-14 | 13F | Northwestern Mutual Wealth Management Co | 0 | -100,00 | 0 | |||||
| 2026-01-26 | 13F | Cwm, Llc | 2.477 | 1,89 | 0 | |||||
| 2026-04-07 | 13F | Farther Finance Advisors, LLC | 0 | -100,00 | 0 | |||||
| 2026-02-13 | 13F | First Trust Advisors Lp | 163.755 | 7,91 | 2.261 | 1,30 | ||||
| 2025-12-16 | 13F | Garde Capital, Inc. | 0 | -100,00 | 0 | |||||
| 2026-04-07 | 13F | Signaturefd, Llc | 0 | -100,00 | 0 | |||||
| 2026-01-26 | 13F | Shaker Financial Services, LLC | 133.212 | 1.859 | ||||||
| 2026-04-15 | 13F | Seacrest Wealth Management, Llc | 15.587 | -4,27 | 209 | -6,28 | ||||
| 2026-01-29 | 13F | Sanctuary Advisors, LLC | 19.000 | 262 | ||||||
| 2026-01-21 | 13F | Newbridge Financial Services Group, Inc. | 0 | -100,00 | 0 | |||||
| 2026-02-09 | 13F | Harbour Investments, Inc. | 690 | 0,00 | 10 | -10,00 | ||||
| 2026-02-11 | 13F | Closed-End Fund Advisors, Inc. | 27.348 | 378 | ||||||
| 2026-02-13 | 13F | MAI Capital Management | 1.410 | 19 | ||||||
| 2026-02-14 | 13F | Rockefeller Capital Management L.P. | 82.102 | 0,00 | 1.134 | -6,13 | ||||
| 2026-02-12 | 13F | Advisors Asset Management, Inc. | 289.051 | -27,39 | 3.992 | -31,85 | ||||
| 2026-02-17 | 13F | Advisor Group Holdings, Inc. | 18.016 | 12,49 | 249 | 3,33 | ||||
| 2026-01-14 | 13F | Hennion & Walsh Asset Management, Inc. | 447.851 | -2,41 | 6.185 | -8,39 | ||||
| 2026-02-03 | 13F | Anfield Capital Management, LLC | 3.906 | 0,00 | 54 | -7,02 | ||||
| 2026-02-19 | 13F | Invesco Ltd. | 122.917 | -26,41 | 1.697 | -30,93 | ||||
| 2026-02-12 | 13F | Penserra Capital Management LLC | 1.468.516 | 10,20 | 20 | 5,26 | ||||
| 2026-04-17 | 13F | AdvisorNet Financial, Inc | 4.517 | -18,32 | 61 | -21,05 | ||||
| 2026-01-28 | 13F | WPG Advisers, LLC | 2.422 | -7,70 | 33 | -13,16 | ||||
| 2026-02-12 | 13F | CIBC Private Wealth Group, LLC | 1.800 | 0,00 | 25 | -7,69 | ||||
| 2026-02-13 | 13F | Allie Family Office LLC | 10.000 | 0,00 | 138 | -6,12 | ||||
| 2026-02-12 | 13F | Sit Investment Associates Inc | 191.637 | 3 | ||||||
| 2026-02-12 | 13F | Commonwealth Equity Services, Llc | 14.778 | -94,55 | 204 | 6.700,00 | ||||
| 2026-02-13 | 13F | Landscape Capital Management, L.l.c. | 53.843 | 744 | ||||||
| 2026-02-13 | 13F | Baird Financial Group, Inc. | 43.734 | 33,03 | 604 | 24,84 | ||||
| 2026-02-05 | 13F | Cambridge Investment Research Advisors, Inc. | 12.666 | -69,44 | 0 | |||||
| 2026-04-15 | 13F | Merit Financial Group, LLC | 10.748 | 2,29 | 144 | -0,69 | ||||
| 2026-04-15 | 13F | Journey Strategic Wealth Llc | 24.000 | -14,29 | 323 | -16,58 | ||||
| 2026-02-06 | 13F | Global Retirement Partners, LLC | 13.860 | 710,53 | 191 | 664,00 | ||||
| 2026-01-16 | 13F | FNY Investment Advisers, LLC | 0 | -100,00 | 0 | |||||
| 2026-02-13 | 13F | Morgan Stanley | 4.350.906 | -7,08 | 60.086 | -12,76 | ||||
| 2026-04-10 | 13F | Centurion Wealth Management LLC | 21.551 | 0,01 | 290 | -2,69 | ||||
| 2026-02-17 | 13F | Private Advisor Group, LLC | 14.978 | 4,20 | 207 | -2,37 | ||||
| 2026-04-20 | 13F | Concurrent Investment Advisors, LLC | 0 | -100,00 | 0 | -100,00 | ||||
| 2026-02-17 | 13F | Advisory Services Network, LLC | 0 | -100,00 | 0 | |||||
| 2026-02-17 | 13F | Bramshill Investments, LLC | 47.185 | 0,68 | 652 | -5,52 | ||||
| 2026-02-05 | 13F | Thrivent Financial For Lutherans | 50.220 | 56,94 | 1 | |||||
| 2026-02-12 | 13F | Steward Partners Investment Advisory, Llc | 32.670 | 0,00 | 451 | -6,04 | ||||
| 2026-02-13 | 13F | Stifel Financial Corp | 215.582 | 8,34 | 2.977 | 1,74 | ||||
| 2026-02-11 | 13F | LPL Financial LLC | 173.591 | -2,14 | 2.397 | -8,13 | ||||
| 2026-02-17 | 13F | Balyasny Asset Management Llc | 88.811 | 1.226 | ||||||
| 2026-02-11 | 13F | Jpmorgan Chase & Co | 176.359 | 0,37 | 2.436 | -5,77 | ||||
| 2026-02-13 | 13F | Mariner, LLC | 13.463 | -15,31 | 186 | -20,60 | ||||
| 2026-02-13 | 13F | Pinnacle Wealth Planning Services, Inc. | 5.572 | 77 | ||||||
| 2026-02-17 | 13F | Readystate Asset Management Lp | 210.479 | 2.907 | ||||||
| 2025-11-14 | 13F | Elequin Capital Lp | 0 | -100,00 | 0 | -100,00 | ||||
| 2026-02-17 | 13F | Wiley Bros.-aintree Capital, Llc | 224.817 | 3.105 | ||||||
| 2026-01-26 | 13F | Decker Retirement Planning Inc. | 0 | -100,00 | 0 | |||||
| 2026-02-05 | 13F | Allworth Financial LP | 1.000 | 0,00 | 14 | -7,14 | ||||
| 2026-02-13 | 13F | Wells Fargo & Company/mn | 914.476 | -14,43 | 12.629 | -19,66 |