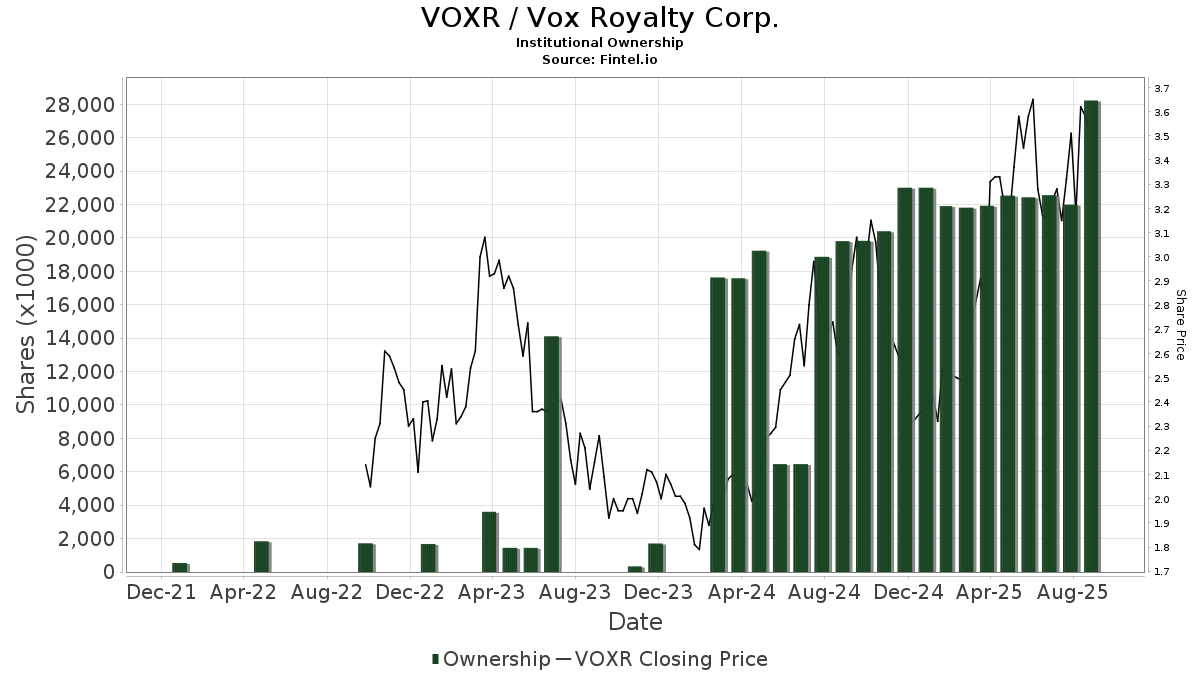
Grundlæggende statistik
| Institutionelle aktier (lange) | 37.683.070 - 55,20% (ex 13D/G) - change of 1,44MM shares 3,98% MRQ |
| Institutionel værdi (lang) | $ 177.811 USD ($1000) |
Institutionelt ejerskab og aktionærer
Vox Royalty Corp. (US:VOXR) har 113 institutionelle ejere og aktionærer, der har indsendt 13D/G- eller 13F-formularer til Securities Exchange Commission (SEC). Disse institutioner har i alt 37,683,070 aktier. Største aktionærer omfatter ORG Partners LLC, BlackRock, Inc., Ashford Capital Management Inc, U S Global Investors Inc, Sanders Morris Harris Llc, CDC Financial, Inc., Geode Capital Management, Llc, Walleye Capital LLC, King Luther Capital Management Corp, and Extract Advisors LLC .
Vox Royalty Corp. (NasdaqCM:VOXR) institutionel ejerskabsstruktur viser aktuelle positioner i virksomheden efter institutioner og fonde, samt seneste ændringer i positionsstørrelse. Større aktionærer kan omfatte individuelle investorer, investeringsforeninger, hedgefonde eller institutioner. Skema 13D angiver, at investoren besidder (eller besidder) mere end 5 % af virksomheden og har til hensigt (eller har til hensigt at) aktivt at forfølge en ændring i forretningsstrategi. Skema 13G indikerer en passiv investering på over 5%.
The share price as of March 27, 2026 is 4,84 / share. Previously, on March 31, 2025, the share price was 2,92 / share. This represents an increase of 65,75% over that period.
Fondens stemningsscore
Fund Sentiment Score (fka Ownership Accumulation Score) finder de aktier, der bliver mest købt af fonde. Det er resultatet af en sofistikeret, multi-faktor kvantitativ model, der identificerer virksomheder med de højeste niveauer af institutionel akkumulering. Scoringsmodellen bruger en kombination af den samlede stigning i oplyste ejere, ændringerne i porteføljeallokeringer i disse ejere og andre målinger. Tallet går fra 0 til 100, hvor højere tal indikerer et højere niveau af akkumulering for sine jævnaldrende, og 50 er gennemsnittet.
Opdateringsfrekvens: Dagligt
Se Ownership Explorer, som giver en liste over højest rangerende virksomheder.
AI+ Ask Fintel’s AI assistant about Vox Royalty Corp..
Select a question to share a public post with an AI-crafted answer.
Thinking of good questions…
Institutionel Put/Call-forhold
Ud over at indberette standardaktie- og gældsudstedelser skal institutter med mere end 100 mill. aktiver under forvaltning også oplyse deres put- og call-optionsbeholdninger. Da salgsoptioner generelt indikerer negativ stemning, og købsoptioner indikerer positiv stemning, kan vi få en fornemmelse af den overordnede institutionelle stemning ved at plotte forholdet mellem put og kald. Diagrammet til højre viser det historiske put/call-forhold for dette instrument.
Brug af Put/Call Ratio som en indikator for investorernes stemning overvinder en af de vigtigste mangler ved at bruge totalt institutionelt ejerskab, som er, at en betydelig mængde af aktiver under forvaltning investeres passivt for at spore indekser. Passivt forvaltede fonde køber typisk ikke optioner, så indikatoren for put/call-forholdet følger mere nøje følelsen af aktivt forvaltede fonde.
13F og NPORT arkivering
Detaljer om 13F-arkivering er gratis. Detaljer om NP-ansøgninger kræver et premium-medlemskab. Grønne rækker angiver nye positioner. Røde rækker angiver lukkede positioner. Klik på linket ikon for at se den fulde transaktionshistorik.
Opgrader
for at låse premium-data op og eksportere til Excel ![]() .
.
| Fil dato | Kilde | Investor | Type | Gennemsnitlig pris (Øst) |
Aktier | Δ Aktier (%) |
Rapporteret Værdi ($1000) |
Δ Værdi (%) |
Port Alloc (%) |
|
|---|---|---|---|---|---|---|---|---|---|---|
| 2026-01-23 | 13F | Tectonic Advisors Llc | 195.417 | 27,22 | 926 | 40,30 | ||||
| 2026-01-23 | 13F | State of Alaska, Department of Revenue | 13.562 | 0 | ||||||
| 2026-01-05 | 13F | GAMMA Investing LLC | 365 | 2 | ||||||
| 2026-01-15 | 13F | Nisa Investment Advisors, Llc | 61 | 0 | ||||||
| 2026-01-14 | 13F | ORG Partners LLC | 11.758.052 | -3,08 | 55.733 | 6,84 | ||||
| 2026-02-17 | 13F | Tower Research Capital LLC (TRC) | 1.650 | -45,72 | 8 | -46,15 | ||||
| 2026-02-13 | 13F | K2 Principal Fund, L.p. | 317.500 | 0,00 | 1.505 | 10,18 | ||||
| 2026-02-11 | 13F | Total Wealth Planning & Management, Inc. | 52.720 | -38,19 | 250 | -7,43 | ||||
| 2026-02-10 | 13F | Rothschild Investment Llc | 4 | 0 | ||||||
| 2026-02-13 | 13F | Charles Schwab Investment Management Inc | 145.585 | 29,00 | 690 | 42,27 | ||||
| 2026-02-12 | 13F | BRYN MAWR TRUST Co | 3.500 | 12,90 | 17 | 23,08 | ||||
| 2026-02-12 | 13F | Renaissance Technologies Llc | 266.500 | -58,78 | 1.263 | -54,57 | ||||
| 2026-02-17 | 13F | Russell Investments Group, Ltd. | 411.317 | -2,60 | 1.950 | 7,38 | ||||
| 2026-02-23 | 13F | Virtu Financial LLC | 39.040 | 260,51 | 0 | |||||
| 2026-01-28 | 13F | Cranbrook Wealth Management, LLC | 700 | 0,00 | 3 | 0,00 | ||||
| 2026-01-30 | 13F | Us Bancorp \de\ | 175 | 1 | ||||||
| 2026-02-17 | 13F | Susquehanna International Group, Llp | 12.137 | 58 | ||||||
| 2026-02-13 | 13F | Rhumbline Advisers | 57.234 | -3,08 | 271 | 7,11 | ||||
| 2025-11-13 | 13F | Acadian Asset Management Llc | 0 | -100,00 | 0 | |||||
| 2026-02-17 | 13F | Aqr Capital Management Llc | 10.514 | 50 | ||||||
| 2026-02-17 | 13F | SageView Advisory Group, LLC | 76 | 0 | ||||||
| 2026-02-09 | 13F | King Luther Capital Management Corp | 680.000 | 0,00 | 3.223 | 10,23 | ||||
| 2026-02-13 | 13F | Ashford Capital Management Inc | 3.152.370 | 23,26 | 14.942 | 35,89 | ||||
| 2026-02-05 | 13F | Allworth Financial LP | 4.332 | 6.088,57 | 21 | |||||
| 2026-02-13 | 13F | Citigroup Inc | 1.347 | -28,62 | 7 | -25,00 | ||||
| 2026-01-29 | 13F | UBS Group AG | 6.689 | -56,20 | 32 | -52,31 | ||||
| 2026-02-10 | 13F | CIBC World Markets Inc. | 29.000 | 140 | ||||||
| 2026-02-17 | 13F | Creative Planning | 65.992 | 313 | ||||||
| 2026-02-10 | 13F | Quantbot Technologies LP | 37.055 | 176 | ||||||
| 2026-02-13 | 13F | Manufacturers Life Insurance Company, The | 0 | -100,00 | 0 | |||||
| 2026-02-13 | 13F | Wells Fargo & Company/mn | 65.110 | 138,52 | 309 | 163,25 | ||||
| 2026-01-29 | 13F | Vanguard Group Inc | 402.231 | 36,39 | 1.907 | 50,32 | ||||
| 2026-02-13 | 13F | NewGen Asset Management Ltd | 0 | -100,00 | 0 | -100,00 | ||||
| 2026-02-10 | 13F | Bank of New York Mellon Corp | 116.438 | 22,93 | 552 | 35,38 | ||||
| 2026-02-13 | 13F | Alyeska Investment Group, L.P. | 425.000 | 0,00 | 2.014 | 10,24 | ||||
| 2026-02-11 | 13F | Deutsche Bank Ag\ | 51.458 | -8,54 | 244 | 0,83 | ||||
| 2026-02-12 | 13F | Nuveen, LLC | 68.462 | 36,51 | 325 | 50,70 | ||||
| 2026-02-17 | 13F | XTX Topco Ltd | 33.543 | -54,94 | 159 | -50,62 | ||||
| 2026-02-17 | 13F | Ancora Advisors, LLC | 416.013 | -16,23 | 1.972 | -7,68 | ||||
| 2025-11-13 | 13F | NewGen Equity Long/Short Fund | 617.500 | 2.637 | ||||||
| 2026-02-13 | 13F | Eschler Asset Management LLP | 64.200 | 0,00 | 304 | 10,14 | ||||
| 2026-02-17 | 13F | Advisor Group Holdings, Inc. | 1.010 | 11,23 | 5 | 33,33 | ||||
| 2026-02-17 | 13F | Two Sigma Advisers, Lp | 60.082 | 183,41 | 285 | 212,09 | ||||
| 2026-01-08 | 13F | True Wealth Design, LLC | 4 | 0,00 | 0 | |||||
| 2026-02-12 | 13F | MetLife Investment Management, LLC | 34.765 | 24,13 | 165 | 36,67 | ||||
| 2026-02-17 | 13F | Two Sigma Investments, Lp | 354.412 | 207,39 | 1.680 | 239,19 | ||||
| 2026-02-10 | 13F | Intech Investment Management Llc | 19.539 | 11,04 | 93 | 22,67 | ||||
| 2026-02-17 | 13F | Moon Capital Management Lp | 0 | -100,00 | 0 | |||||
| 2026-02-10 | 13F | Bnp Paribas Arbitrage, Sa | 43.060 | 223,44 | 204 | 257,89 | ||||
| 2025-11-14 | 13F | Point72 (DIFC) Ltd | 456 | 2 | ||||||
| 2026-02-12 | 13F | BlackRock, Inc. | 6.037.296 | 21,29 | 28.617 | 33,70 | ||||
| 2026-02-17 | 13F | Perritt Capital Management Inc | 0 | -100,00 | 0 | -100,00 | ||||
| 2026-02-17 | 13F | Fmr Llc | 3.830 | 490,14 | 18 | 800,00 | ||||
| 2026-01-28 | 13F | U S Global Investors Inc | 1.562.000 | 0,00 | 7.404 | 10,23 | ||||
| 2026-02-17 | 13F | Price T Rowe Associates Inc /md/ | 29.938 | 48,00 | 0 | |||||
| 2026-02-17 | 13F | Alliancebernstein L.p. | 19.600 | 93 | ||||||
| 2025-11-14 | 13F | Cubist Systematic Strategies, LLC | 60.403 | -10,61 | 260 | 21,60 | ||||
| 2026-02-02 | 13F | Oppenheimer Asset Management Inc. | 16.800 | -0,43 | 80 | 9,72 | ||||
| 2026-01-22 | 13F | Financial Consulate, Inc | 500 | 2 | ||||||
| 2026-02-10 | 13F | Goldman Sachs Group Inc | 47.635 | 91,96 | 226 | 112,26 | ||||
| 2026-02-13 | 13F | Marshall Wace, Llp | 0 | -100,00 | 0 | |||||
| 2026-02-17 | 13F | Millennium Management Llc | 29.744 | -82,66 | 141 | -81,00 | ||||
| 2026-02-18 | 13F | Caitlin John, LLC | 14.200 | -4,54 | 67 | 6,35 | ||||
| 2026-02-18 | 13F | Papamarkou Wellner Asset Management inc. | 106.250 | -21,58 | 504 | -13,57 | ||||
| 2025-11-13 | 13F | Diversify Advisory Services, LLC | 0 | -100,00 | 0 | |||||
| 2026-02-11 | 13F | Gwn Securities Inc. | 69.493 | 329 | ||||||
| 2026-01-20 | 13F | AdvisorNet Financial, Inc | 150 | -86,96 | 1 | -100,00 | ||||
| 2025-10-30 | 13F | Ridgewood Investments LLC | 0 | -100,00 | 0 | -100,00 | ||||
| 2026-02-11 | 13F | Hodges Capital Management Inc. | 528.600 | 15,85 | 2.506 | 27,68 | ||||
| 2026-02-13 | 13F | Sterling Capital Management LLC | 366 | 238,89 | 2 | |||||
| 2026-02-13 | 13F | Barclays Plc | 102.016 | 59,92 | 484 | 76,28 | ||||
| 2026-02-17 | 13F | Medici Capital Llc | 0 | -100,00 | 0 | -100,00 | ||||
| 2026-02-17 | 13F | Twin Focus Capital Partners, Llc | 558.988 | 0,00 | 2.650 | 10,24 | ||||
| 2026-02-19 | 13F | Invesco Ltd. | 33.333 | 17,71 | 158 | 29,75 | ||||
| 2026-02-12 | 13F | New York State Common Retirement Fund | 1.300 | 0,00 | 6 | 20,00 | ||||
| 2026-02-11 | 13F | Jpmorgan Chase & Co | 31.395 | -8,03 | 149 | 1,37 | ||||
| 2026-01-27 | 13F | TD Waterhouse Canada Inc. | 4.700 | 0,00 | 21 | 16,67 | ||||
| 2026-02-06 | 13F | ProShare Advisors LLC | 10.877 | 52 | ||||||
| 2025-11-14 | 13F | Squarepoint Ops LLC | 0 | -100,00 | 0 | -100,00 | ||||
| 2026-02-13 | 13F | Arrowstreet Capital, Limited Partnership | 38.252 | 184 | ||||||
| 2026-02-13 | 13F | State Street Corp | 556.316 | 92,25 | 2.644 | 111,95 | ||||
| 2026-02-13 | 13F | Police & Firemen's Retirement System of New Jersey | 16.015 | 64,31 | 76 | 82,93 | ||||
| 2026-03-25 | 13F | McAlvany Wealth Management LLC | 549.413 | 2.604 | ||||||
| 2025-11-12 | 13F | Sprott Inc. | 0 | -100,00 | 0 | -100,00 | ||||
| 2026-02-06 | 13F | Pnc Financial Services Group, Inc. | 482 | -79,47 | 2 | -80,00 | ||||
| 2026-02-12 | 13F | Campbell & CO Investment Adviser LLC | 20.909 | 99 | ||||||
| 2026-02-17 | 13F | Royal Bank Of Canada | 20.119 | 10,39 | 95 | 20,25 | ||||
| 2026-01-20 | 13F | Signaturefd, Llc | 84 | 0 | ||||||
| 2026-01-09 | 13F | SG Americas Securities, LLC | 12.773 | 0 | ||||||
| 2026-02-13 | 13F | National Bank Of Canada /fi/ | 28.191 | -18,46 | 128 | -6,57 | ||||
| 2026-02-09 | 13F | Legal & General Group Plc | 6.355 | 43,36 | 30 | 57,89 | ||||
| 2026-02-17 | 13F | California State Teachers Retirement System | 3.665 | 46,31 | 17 | 70,00 | ||||
| 2026-01-26 | 13F | Cwm, Llc | 475 | 4,17 | 0 | |||||
| 2026-02-17 | 13F | Bridgeway Capital Management Inc | 58.000 | 275 | ||||||
| 2026-02-17 | 13F | Quadrature Capital Ltd | 0 | -100,00 | 0 | -100,00 | ||||
| 2026-01-20 | 13F | Stratos Wealth Partners, LTD. | 19.608 | 34,35 | 93 | 48,39 | ||||
| 2026-02-13 | 13F | Walleye Capital LLC | 691.536 | 85,51 | 3.278 | 104,56 | ||||
| 2026-02-05 | 13F | Cambridge Investment Research Advisors, Inc. | 67.547 | 0 | ||||||
| 2026-02-17 | 13F | Citadel Advisors Llc | 95.446 | -70,67 | 452 | -67,69 | ||||
| 2026-02-13 | 13F | Meixler Investment Management, Ltd. | 188.279 | -12,34 | 892 | -3,36 | ||||
| 2026-02-17 | 13F | MIRAE ASSET GLOBAL ETFS HOLDINGS Ltd. | 27.630 | 33,85 | 131 | 47,73 | ||||
| 2026-02-17 | 13F | Point72 Asset Management, L.P. | 190.342 | 902 | ||||||
| 2026-02-17 | 13F | Ameriprise Financial Inc | 111.781 | 4,48 | 530 | 15,00 | ||||
| 2026-02-12 | 13F | Federation des caisses Desjardins du Quebec | 2.000 | 0,00 | 9 | 12,50 | ||||
| 2026-02-10 | 13F | Axq Capital, Lp | 27.627 | 131 | ||||||
| 2026-02-09 | 13F | Geode Capital Management, Llc | 733.661 | 36,74 | 3.478 | 50,72 | ||||
| 2026-02-13 | 13F | SRS Capital Advisors, Inc. | 0 | -100,00 | 0 | |||||
| 2026-02-13 | 13F | Extract Advisors LLC | 652.114 | 3.091 | ||||||
| 2026-01-08 | 13F | Sanders Morris Harris Llc | 1.400.903 | 0,00 | 7.131 | 18,38 | ||||
| 2026-02-17 | 13F | Parvin Asset Management, LLC | 1.400 | 0,00 | 7 | 0,00 | ||||
| 2026-01-15 | 13F | Highline Wealth Partners Llc | 300 | 20,00 | 1 | 0,00 | ||||
| 2026-02-11 | 13F | Ameritas Investment Partners, Inc. | 4.095 | 0,00 | 19 | 11,76 | ||||
| 2026-02-12 | 13F | Jane Street Group, Llc | 0 | -100,00 | 0 | -100,00 | ||||
| 2026-03-20 | 13F/A | Hsbc Holdings Plc | 12.165 | 58 | ||||||
| 2026-02-13 | 13F | CDC Financial, Inc. | 1.264.804 | 5.995 | ||||||
| 2026-02-17 | 13F | Bank Of America Corp /de/ | 414.462 | 131,50 | 1.965 | 155,40 | ||||
| 2026-02-17 | 13F | Northern Trust Corp | 293.694 | 18,79 | 1.392 | 30,95 | ||||
| 2026-02-12 | 13F | Arbiter Partners Capital Management LLC | 121.920 | 409,70 | 578 | 465,69 | ||||
| 2026-02-11 | 13F | Los Angeles Capital Management Llc | 349.070 | 217,07 | 1.508 | 218,60 | ||||
| 2026-02-17 | 13F | Engineers Gate Manager LP | 17.831 | 85 | ||||||
| 2026-02-12 | 13F | Bank Of Montreal /can/ | 24.122 | 116 | ||||||
| 2026-02-13 | 13F | Morgan Stanley | 284.210 | 120,21 | 1.347 | 143,14 | ||||
| 2026-02-05 | 13F | Amalgamated Bank | 1.870 | 36,50 | 0 | |||||
| 2026-02-17 | 13F | Jump Financial, LLC | 67.371 | 319 | ||||||
| 2026-01-07 | 13F | Massmutual Trust Co Fsb/adv | 292 | 0,00 | 1 | 0,00 | ||||
| 2026-02-06 | 13F | EverSource Wealth Advisors, LLC | 75 | 0,00 | 0 | |||||
| 2026-02-12 | 13F | Federated Hermes, Inc. | 275 | -41,61 | 1 | -50,00 |
Other Listings
| CA:VOXR | 6,71 CA$ |